Categories
Financial Technology Investing

SelfWealth Review: What You Should Know Before Switching To SelfWealth

In this SelfWealth Review, we take a look at one of the leading platforms in a new breed of Australian trading apps making the stock market more accessible to investors than ever before.

SelfWealth is one of the growing number of app-first brokerage services aimed at self-directed investors in Australia.

Offering a zero commission, fixed brokerage fee model paired with some powerful research and analysis tools, SelfWealth serves about 80,000 Australian customers.

In this SelfWealth review, we’ll cover the changing investment landscape that’s led to services like SelfWealth, STAKE and others entering the market and competing with more established brokerage services.

We’ll review SelfWealth’s features, some pros and cons, fees, support and account types.

We’ll also explain how to buy shares on the SelfWealth platform and show you how you can pair apps like this with other services (like this portfolio tracker) designed to help self-directed investors manage and understand their investment portfolios.

SelfWealth: Changing The Investing Game Since 2012

In 2012, SelfWealth joined the likes of Superhero, STAKE and eToro in the trading app market.

Like its competitors, SelfWealth offers an alternative to the problem Australian investors have faced for decades; Investing in the share market without having to pay exorbitant brokerage fees.

Since 2016, SelfWealth has offered flat free brokerage of $9.50 on every trade, no matter the size.

While they now offer much more than just flat-fee trading, this feature of the SelfWealth platform is what sets it (and its competitors) apart from the Australian investment establishment.

SelfWealth allows you to trade Australian-listed and US-listed shares in the iOS and Android apps.

Behind the scenes, SelfWealth are partnered with ANZ and OpenMarkets.

When you create your account, you’re automatically set up with an ANZ holding account (you’ll be given a Holder Identification Number, or HIN).

(You can’t use an existing account.)

All your trades on SelfWealth are executed and settled by OpenMarkets.

While this is convenient if you don’t have a pre-existing account or a preference, it may be a drawback for some.

For example, if you are trading large amounts and need to hold hundreds of thousands of dollars, you might prefer an account that pays you interest on the cash. SelfWealth’s default ANZ account does not pay interest. This is worth considering before you sign up.

Overall though, most Australian users seem to like SelfWealth’s accessibility and simplicity.

SelfWealth has twice won awards for being Australia’s cheapest online broker, and are now at a point where they’re expanding their offering beyond just low-cost, fixed-fee trading.

Part of this expansion is SelfWealth Premium, a members-only paid side of the platform where you can not only trade and track investments, but anonymously watch and follow other SelfWealth members’ investment portfolios.

We’ll dive into more detail about the free and premium features in this in-depth SelfWealth review.

To sign up, you’ll need to provide standard identification and proof of Australian residential address, as per industry know-your-customer standards.

The process is relatively straightforward and no more time consuming than signing up for CommSec or any other share trading platform Australia.

According to SelfWealth, the standard wait time for setting up a new account is two days.

SelfWealth Share Trading Platform Features & Tools

SelfWealth offers CHESS-sponsored shares on its platform.

If you don’t know about CHESS, here’s a simple explanation.

Australian stock brokers let you trade two types of stocks; those that are CHESS-sponsored, and those that are not.

When a stock is CHESS-sponsored, it means the Australian Securities exchange keeps a record of everyone who owns shares in it.

Without this sponsorship, you rely on your broker, or the company itself, to keep a record of you owning its shares.

In other words, were SelfWealth to close tomorrow, all the shares you owned through it would be recorded by the exchange itself — meaning you’re not at risk of losing your investments.

CHESS-sponsored shares allow you to own them directly. Not via a third-party, which is how some other trading platforms and apps operate.

This is a major benefit for SelfWealth users, as it backs up the platform’s many tools and features with a strong level of basic investment security.

Now, to the platform itself.

SelfWealth doesn’t just provide stock broking and share trading services.

The platform can be broken down into the following areas:

  • Trading
  • Research & Reporting
  • Diagnostics
  • Community & Benchmarking

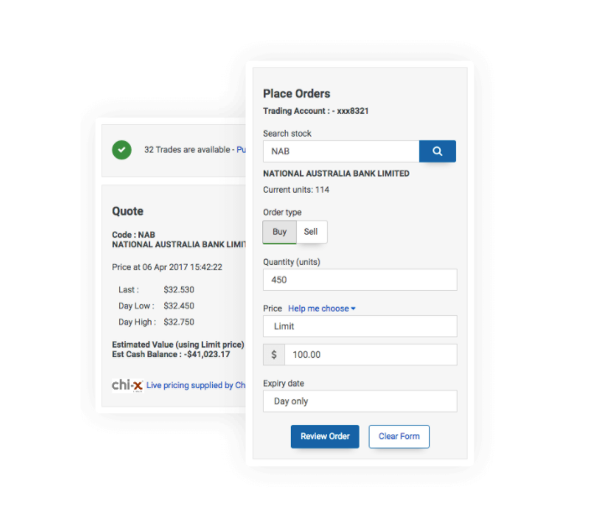
Making trades on Self Wealth is similar to most online trading platforms. You can trade all ASX-listed stocks plus those listed on the NYSE and NASDAQ in the US.
SelfWealth review

You can move funds between Australian dollars and US dollars in your holding accounts. You’ll pay 0.6% when exchanging to and from US dollars — which SelfWealth claims is cheaper than its competitors.

Whether you’re trading ASX or US stocks, the process is simple and self-explanatory on SelfWealth.

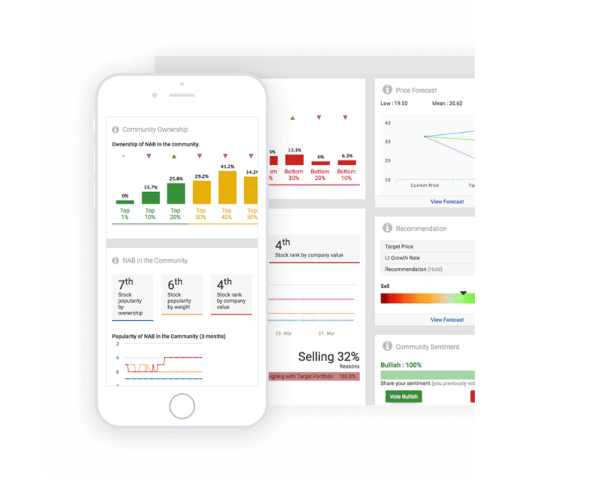
The platform’s research and reporting tools are becoming increasingly powerful.
SelfWealth review

Thanks to SelfWealth’s partnership with Thomson Reuters, the platform gives you a considerable amount of information with which to research, analyze and screen stocks you might be considering investing in.

The information includes the company’s financials, relevant market news, analyst’s price forecast and, as part of SelfWealth’s push to expand the community aspect of its service, a measure of sentiment from among other users on the platform, as well as other statistics.

SelfWealth delivers its stock data via the official market feeds from the ASX, NYSE and NASDAQ with a 20-minute delay.

You can also easily set up a watchlist of equities or funds you’d like to monitor, allowing you to track them in one place and keep an eye on their progress.

The SelfWealth portfolio tracking and diagnostics tools are also helpful when checking in on your performance.

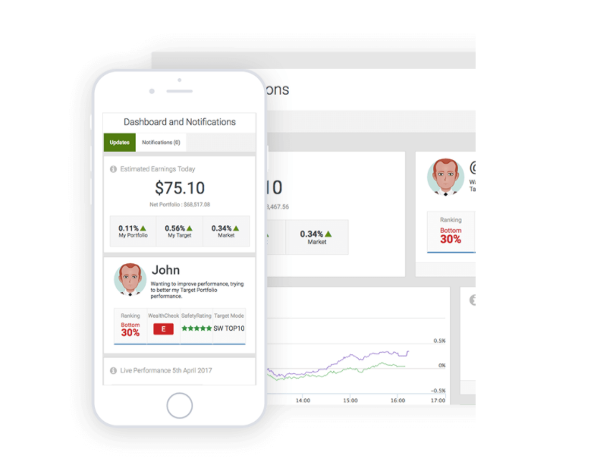
You have a standard dashboard screen showing your account balance, your daily performance relative to the market and several other in-platform metrics.

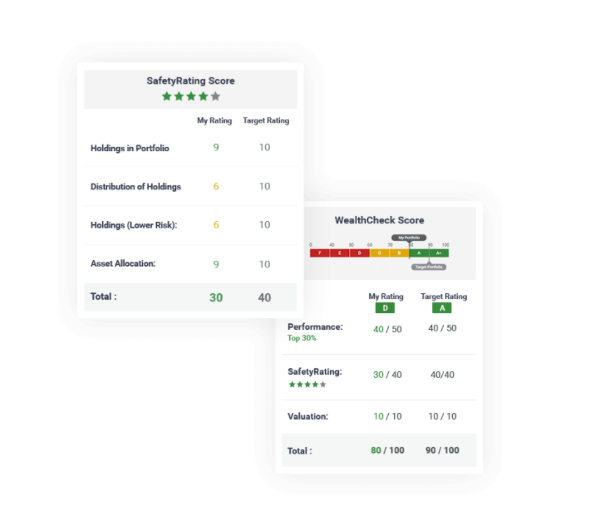
SelfWealth’s Safety Rating scores your portfolio out of 40 to give you a measure of your investments’ diversification, which it says helps protect your portfolio from ‘the inevitable bumps in each sector of the stock market’.

The app calculates your rating based on the number of holdings, distribution, number of what it classifies as ‘lower risk’ holdings and overall asset allocation.

It gives you a target of 10 for each metric, meaning you’re encouraged to make certain trades to meet those.

For the beginner investor who requires a lot of guidance and is perhaps buying shares for the first time, this is a nice tool. But, as Aussie Moneyman points out, for the more advanced investor who’s working with a pre-existing methodology, these tools can get in the way of SelfWealth’s core function as a trading platform.

Similarly, the WealthCheck Score rates your portfolio from F to A+, giving you an idea of your overall account strength relative to performance, SafetyRating and valuation.
SelfWealth Premium, Target Portfolios & Alignment

When you create a SelfWealth account, you’re automatically enrolled in their Premium membership plan.

Several of the tools and features mentioned above are part of the Premium plan, which you can access free for 90 days — a generous trial period — before deciding whether to downgrade to the more basic free version, or paying $20 a month.

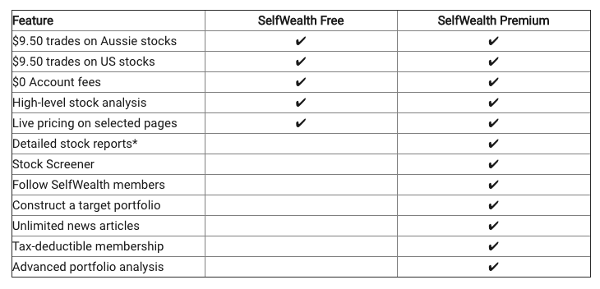
The big difference between the free and paid versions of SelfWealth is community interaction and portfolio analytics.

As a Premium member, you can follow other members (anonymously) to see what they’re trading and how their portfolio is performing. Then, you can create a target portfolio based off the top 10 performing members you follow.

This is a model portfolio based on the top weighted holdings in those portfolios.

Why would you need to do this? Because SelfWealth Premium then uses the Alignment Tool to show you the extent to which your portfolio differs from your target portfolio. 

SelfWealth pitches this as a modern, superior alternative to simply benchmarking your portfolio against the market. While it might be useful to invest using a target portfolio made up of your favourite traders’ biggest positions, Aussie Moneyman’s opinion that some of SelfWealth’s features won’t suit the more advanced, self-directed investor applies here.

Because SelfWealth Premium’s community remain anonymous from you (and you from them), it could be difficult to determine whether the users you’re following have generated their returns by design or by accident.

And since the market is a reflection of the opinions of many parties, there would appear to be a risk that SelfWealth users may stumble upon good portfolio performance simply by following others, as opposed to doing their own research or following their own investment methodology.

SelfWealth Supports Individuals, Companies, Trusts & More

As we mentioned, there’s two levels of SelfWealth membership; Free and Premium.

Both come with an ANZ holding account and HIN as standard. Both execute and settle trades using OpenMarkets.

Whether you downgrade after your 90-day Premium trial, or you opt to stay with Premium for $20 a month, you’ll only ever pay $9.50 for each trade (and 0.6% on AUD/USD exchange when shifting funds to trade either Australian or US-listed shares).

Here’s the full list of paywalled features:
SelfWealth review

SelfWealth, despite its name, isn’t only available to private, solo investors.

The platform supports individual trading accounts, joint accounts (married couples investing together, for example), company accounts, trust accounts and even Self Managed Super Funds (SMSFs).

This makes the platform accessible for many different purposes and gives investors from right across the spectrum an affordable on-ramp to the Australian and US stock markets.

What you won’t find on SelfWealth are cryptocurrencies. While you can trade stocks and ETFs as an individual, company, trust or SMSF, you can’t access Bitcoin, Ethereum or any of the other cryptos many platforms are making available to their users.

While SelfWealth does provide a valuable, low-cost platform with plenty of options for research, trading and investing, they’re missing what’s fast becoming a major part of Australian investors’ (especially younger investors’) portfolios.

By 2025, more than half of Australians under the age of 40 are predicted to own cryptocurrency.

If you’re one of these people, this is a downside to SelfWealth. It means you need to have a SelfWealth account for your traditional investments, and another — like eToro, for example — for your crypto trading.

If you are investing in both and you end up with two accounts for stocks and crypto, then you can track, analyze and compare both portfolios in Navexa

The SelfWealth Customer Support System

Like many modern trading platforms, which are replacing the face-to-face customer-broker relationship of decades past, SelfWealth provides customer support and communication exclusively by email and live chat.

Their website points out that in order to maintain their $9.50 flat brokerage fees, they save money by not offering phone support.

For most customers, this doesn’t seem to be any drawback to trading with SelfWealth.

SelfWealth’s client services team aims to respond to all email enquiries within two days. But it’s their live chat channel where they focus on instant assistance and resolution. Open from 10am to 4pm Monday to Friday (and closed public holidays, just like the markets), SelfWealth’s live chat support is great for getting prompt responses to questions that might arise while using your account.

You can access their client services team through SelfWealth’s social channels, plus find answers to common, non-account specific queries on their blog and FAQ page.

Overall, SelfWealth’s customer service is prompt, accessible and befitting of a digital-first trading service that focuses on providing an affordable, straightforward online experience.

SelfWealth Trading Fees & Commissions

SelfWealth’s $9.50 flat fee is (nearly) the lowest in Australia. When you compare it with the big four banks, like ANZ for example, it’s about 50% cheaper.

For larger trades, SelfWealth’s flat fee becomes even more competitive.

Take a look at CommSec’s trading fees, and you’ll see that on a $50,000 trade, you’ll pay about $600 in brokerage compared with the flat $9.50 on SelfWealth — a fraction of the price.

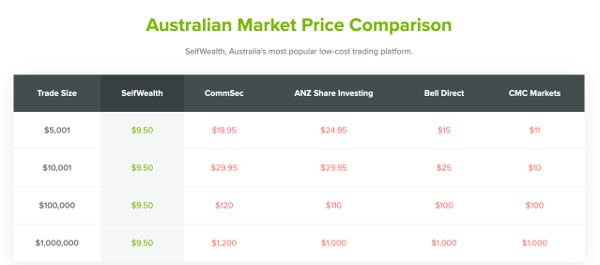
Unsurprisingly, SelfWealth point out just how much cheaper they are compared with some of their established competition. See the graphic from their website:
SelfWealth review

You can see that, especially as your trade size increases, the savings you can make become substantial.

For instance, were you to enter a trade for $1,000,000, SelfWealth’s flat $9.50 works out to be just 0.79% of what CommSec will charge for the same transaction.

While CommSec does offer perhaps the most powerful research-led trading platform in Australia, on a fees-only basis, SelfWealth is far more attractive.

Especially when you consider, as we mention above, that thanks to SelfWealth’s partnerships with ANZ and OpenMarkets, they offer you a HIN-equipped cash account and access to CHESS-sponsored shares.

But trading fees are just one aspect of SelfWealth’s financial proposition.

It’s important to note that as well as charging $9.50 per trade — no matter the amount — SelfWealth does not take a commission on any profits you make from your trades.

This is significant, since there are some situations (like investing with a portfolio manager or adviser, for example) in which you’d have to pay a percentage of your returns.

If you made a 50% gain on a million-dollar trade, for instance, and you had to pay a 2% commission, that’d be $10,000 you’d have to hand over.

You don’t need to worry about this when trading with SelfWealth.

How To Buy Shares On SelfWealth

Buying shares on SelfWealth is fairly self-explanatory and similar to what you’ll find across other apps and more traditional trading platforms.

Before we walk you through the simple steps you need to take to set up and execute a trade, there’s a couple of things you should know.

First, there’s no minimum balance required when you open a SelfWealth account. And you don’t need to keep up a certain balance requirement, nor make a certain number of traders per month.

While some services might require you to keep a minimum balance or trade number in order to keep your account active, SelfWealth doesn’t impose these requirements — which fits well with their ethos of accessible, affordable trading for everyday Australian investors.

The one limitation you will find when making a trade on SelfWealth is the ASX’s standard minimum trade value of $500.

Here’s how to enter a trade.

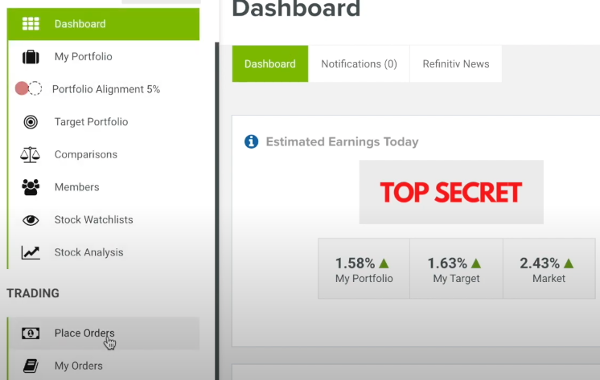
On your SelfWealth dashboard, you’ll see a section called ‘Trading’.

The first option in this section is ‘Place Orders’.
SelfWealth review

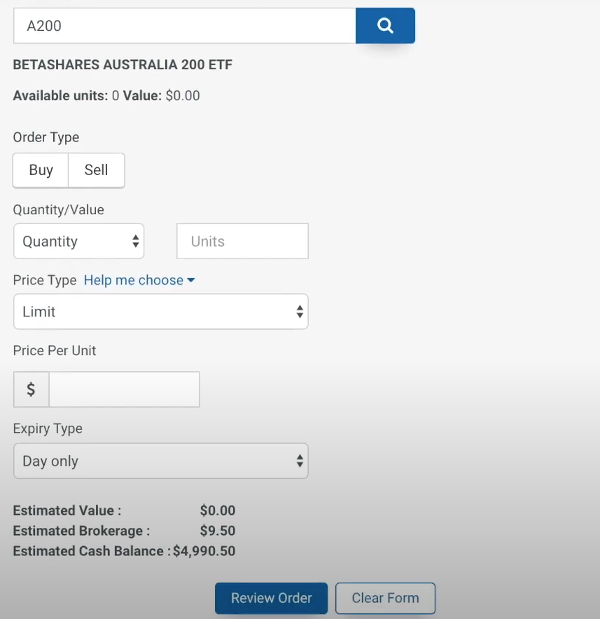
This will take you to a standard order form similar to what you’ll find on CommSec, for example.

First, use the ticker symbol to search for and select the stock or fund you want to trade.

If you already hold shares in it, you’ll see the amount and value displayed right below the search field.
SelfWealth review

From here, the fields and buttons are straightforward.

Select ‘Buy’ or ‘Sell’. Choose whether to trade based on quantity or value, how you’d like to select the price you pay, price per unit and the expiry type for the trade.

Completing these fields will populate the numbers you see at the bottom; Estimated Value, Estimated Brokerage (always $9.50 when trading with SelfWealth, of course) and your Estimated Cash Balance once the trade is completed.

There are two other panels on the trading screen.

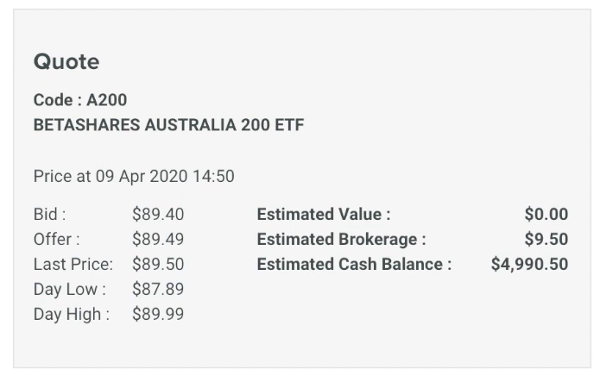
At the time you select the stock or fund in the search field, SelfWealth generates a quote to help you set up your trade.

As you can see below, the quote gives you key numbers: Bid price (what buyers are paying at the time of the quote), offer price (what sellers are prepared to sell for), the last price the stock or fund traded for and the day’s low and high price.
SelfWealth review

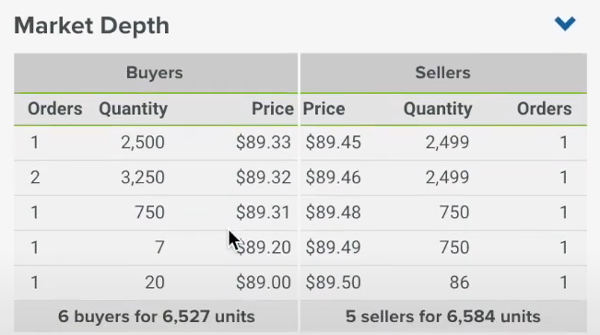
The quote panel is a useful guide for setting up your trade. But it’s not the only tool on the trading screen. You can also view ‘Market Depth’.

This panel shows you the most recent trades. You can see a snapshot of how many shares have changed hands and at what price. This can be helpful for getting an idea of liquidity and sentiment around the stock or fund you’re trading.
SelfWealth review

For a more detailed breakdown of how to trade on SelfWealth, check out this video guide.

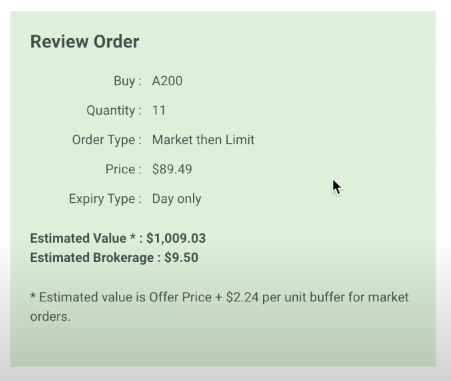
Once you’ve set up your trade and you’re happy with all the details and ready to proceed, it’s time to hit ‘Review Order’ at the bottom of the fields.

This will bring you through to the review screen:
SelfWealth review

Double check your order details and if everything looks good, click confirm.

You’ll also see a short questionnaire on the right of the review page.

This is optional, and allows SelfWealth to collect information on the stock or fund, your reasons for trading it and, probably most importantly, whether you’re bearish or bullish on the trade.

Our SelfWealth Review: The Verdict 

This brings us nearly to the end of our SelfWealth review.

We’ve covered SelfWealth’s background, features and tools, account types, trading fees, customer support and walked you through the basics of how to execute a trade.

SelfWealth is a great example of a modern trading app that gives you an affordable, accessible way to trade Australian and US shares and ETFs.

It’s flat $9.50 trading fee makes it if not the cheapest service of its kind in Australia, then certainly one of the cheapest.

When you compare SelfWealth to the likes of CommSec, you can see that on larger trades, you stand to save substantial amounts of money by using this platform.

Not only is SelfWealth — and other apps like it — disrupting the investing establishment with their low fees, but there’s plenty on the platform that leverages the online world that younger investors are familiar with to enhance the trading experience.

Specifically, SelfWealth’s target portfolio and user profile and following functions provide novel and interesting ways for beginner investors, in particular, to start trading and building a portfolio.

As always though, we encourage you to do plenty of research of your own on SelfWealth — and its competitors — to determine which trading platform might suit you and your investing style best.

Trading With SelfWealth? Track With Navexa.

One part of SelfWealth that’s not as thorough — since it’s not the platform’s core service — is its portfolio tracking.

Your portfolio page is great for gaining a snapshot of your portfolio day to day.

But what you won’t find on SelfWealth are in-depth, real money-terms portfolio analytics.

Yes, you can benchmark your account to the wider market.

But you can only track your progress so far.

Let us explain.

The rise of self-directed and the so-called ‘democratization’ of investing (the movement of which SelfWealth and its competitor platforms are a part) is making it easier than ever to invest and trade.

But what many new investors are forgetting — or not being told the first place — is that there’s a difference between gains and true performance.

Your trading account might show you how much money you’ve put into your portfolio, and how much you’ve gained or lost. But the reality is, that is only a part of the full financial picture you need to see when it comes to growing and managing your investments.
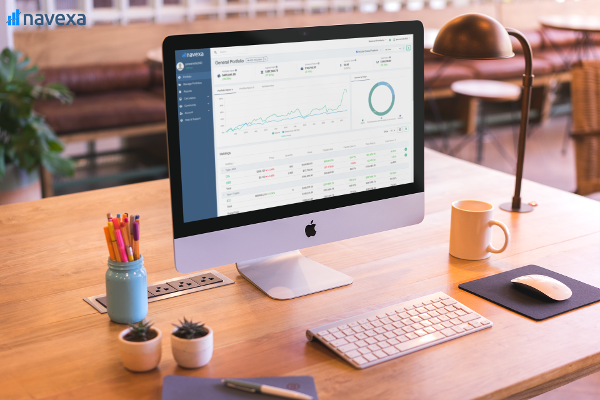
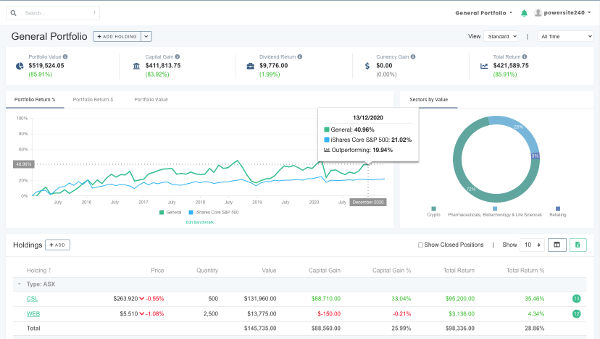
Navexa portfolio tracker

Four Things You Must Know About Your Portfolio Performance

Here are four vital things you need to know in order to fully understand the value and performance of a given investment, and your wider portfolio.

  1. How much time have you invested to generate a return? Consider that a 100% gain in a year is far more desirable than a 100% gain in five years.

  2. How much tax do you pay on your investments? Do you know how much you need, or might need, to pay on the returns you earn from an investment or portfolio? If you have to give 20% of your returns to taxation, you need to see that reflected in your portfolio performance — since that money isn’t going to stay in your account.

  3. How much income have you earned from dividend payments? One stock our founder owns has paid him back 40% of his investment in dividends. This substantially affects how you should view an investment’s performance.

  4. How much have you spent in fees? If you’ve been investing for 20 years, making, say 25 trades a year at $20 a trade, that’s $10,000. However much you spend on fees in the course of your trading, you need to factor that in to fully understand your portfolio performance.
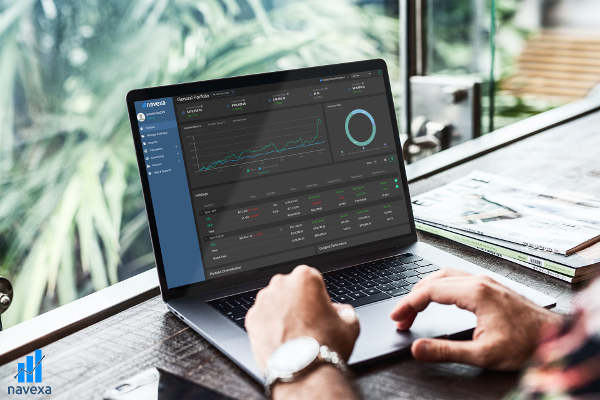
Navexa portfolio tracker

When you’re buying and selling stocks and building up a portfolio, many of us think it’s enough to see our ‘gains’ in our trading account.

Here at Navexa, we believe that in the most connected and data-rich era of financial history, there’s no excuse for not knowing the exact details of every dollar going into and out of your portfolio.

The truth is that there’s are many more things impacting your portfolio than just whether or not the investments in it have gone up or down this week or month. 

This is why we developed Navexa. It’s a portfolio tracker that accounts for every factor impacting your investments — time, taxation, income and fees.

You can use Navexa seamlessly with a SelfWealth account (you can add your historical trades and link your account in minutes) to see your portfolio in the depth and detail you need to fully understand your performance.

Plus, you can generate a variety of reports, from calculating unrealized capital gains and taxable investment income, to analyzing portfolio diversification contributions, and much more.

Take a free trial of the Navexa portfolio tracker here.

Categories
Financial Literacy Investing

Stock Trading Strategies Every Trader Should Know

Trading the stock market is a complex and ever-changing challenge. Here are seven common trading strategies investors use to navigate it.  

Do you consider yourself an investor, or a trader? If you’re the type who prefers to buy and sell shares in the stock market often, instead of holding onto an investment perhaps for several years at a time, you’d probably be considered a stock trader.

You may have heard the terms ‘passive’ and ‘active’ investing.

Passive investing is generally long-term investing. You might research and value a stock, invest in some of its shares, and leave that investment alone for many years to let it appreciate in value.

Active investing is the opposite.

Active investing is the domain of the trader, as opposed to the investor.

Traders don’t look for long-term investments. Rather, they buy and sell stocks with the objective of making a quick profit from short-term price movement.

Some traders may make hundreds or thousands of trades a day, aiming to cycle their capital between positions — often looking to profit from both upward and downward price movement.

In this post, we’re going to introduce some of the essential components of trading strategies, from some of the common terms and ideas to important factors every trader, indeed every investor, should be familiar with.

Then, we’ll cover seven commonly used stock trading strategies traders of many different kinds are using in the stock market today.

trading strategies

Essential Components Of Every Trading Strategy

Trading in the stock market — regardless of which trading strategy you choose — requires a significant amount of knowledge.

Even beginning traders should invest substantial effort into educating themselves on the processes and terminology of the market and the wide variety of assets trading on it.

Volume: Volume refers to the amount of shares being bought or sold in a given stock at a given time. Most stock charts will show you the volume relative to the price movement — often with a bar graphic displayed over the price movement line. Volume shows you how much money is changing hands for that asset in the market.

Liquidity: Liquidity relates directly to volume. The more shares are being exchanged in a stock, the easier it should be to find a buyer or seller to trade with. Low liquidity might mean it takes time to execute your trade — which could mean the price shifts while you wait.

Volatility: This is the extent to which the stock’s price moves up and down. If the share price moved between, say, $100 and $105 over a one-month period, you’d say it showed low volatility compared with another that moved between $5 and $50 in the same timeframe.

Float & Short Float: When you hear traders talk about the ‘float’, they’re referring to the number of shares available to the public to buy and sell. The float has an effect on a stock’s liquidity. The ‘short float’ refers to the number of available shares that have been borrowed for short selling (this is a key indicator of short interest).

Long and Short: You may have heard the phrase ‘going long’ or ‘going short’. These are stock market terms for betting on a stock rising or falling in price. A ‘long’ position is where you buy shares and aim to sell them at a higher price. A ‘short’ position is where you borrow shares and agree to sell them at a lower price, capturing the difference as profit.

Moving Average: Traders will use the moving average to determine a stock’s trend over a given time frame. Many charting tools will allow you to set and view a moving average line over the price movement. This allows you to ‘zoom out’ and get a different perspective on a stock from price alone.

Stop Loss: Traders and investors alike commonly use stop loss orders to protect their capital. When you enter a trade with your broker, you can set that order to automatically sell you out of part, or all, of your position when the stock falls to a given price. This can save you losing more capital on a losing trade. It can also result in being ‘stopped out’ of a good trade during temporary price drop.

Limit Order: The limit order works similarly to the stop loss order. But in this case, you enter the trade with the condition to buy shares at a certain price. Say you’re keen to buy 100 shares in Stock X, but you don’t want to pay the current price of $20, you can enter a limit order so that if the price comes down to $15 within a given time frame, your broker will try to buy you those 100 shares.

These are just some of the key terms you need to be familiar with when entering the stock market as a trader or investors.

Remember, all investing carries risk and it’s vital to educate yourself, seek advice and be clear about the risks to your capital when you enter the market.

trading strategies

Seven Commonly Used Stock Trading Strategies

Now that we’ve covered some of the basics above, let’s get into the actual trading strategies you can choose from when looking to make money in the stock market.

Day Trading: Fast, High Impact Buying & Selling

You’ve probably heard of day trading. Day trading is exactly what it sounds like — a style of trading where all the buying and selling occurs within a single trading day.

The idea with day trading is to use large amounts of capital — and often ‘leverage’ (money borrowed for trading) — to profit from intraday price movements in stocks.

Day trading depends heavily on technical analysis. In other words, interpreting stock charts to determine the likelihood of small price movements one way or another.

Day trading relies heavily on technical analysis. The day trader tries to predict a short-term price movement, and bet a large amount of capital on that movement with a view to closing out the trade that same day.

For example, a day trader might calculate Stock X is going to increase from $10 to $10.25 that day.

They might put $100,000 of their own money into that trade, plus another $200,000 of leverage (borrowed money from their broker). They’ll probably use a stop loss to protect against critical losses, too.

If that price move does play out, it’s only a 2.5% gain. But with the $300,000 they traded with, that’s a $7,500 profit (minus the leverage fee, of course). 

That’s day trading in a nutshell! Of course, the potential big rewards come with the equal amount of risk.

Day trading is an often-talked about trading strategy which, like all stock trading strategies, carries with it the risk of losing money.

Position Trading: Looking to Profit From Medium-Term Trend Prediction

While day trading hinges on making trades within a single day, and trying to leverage tiny price movements for big profits, position trading is a relatively slower trading strategy.

Position trading, or ‘trend trading’ is similar to day trading in that the position trader will use charts and technical analysis (ADD TA ABOVE!) to determine whether a stock or market is likely to move up or down.

The difference is that position traders don’t worry about trying to predict prices. Instead, they use an array of tools, calculations and indicators — the moving average being a major one — to determine the trend.

Once they’re satisfied that a stock is trending a certain way, they’ll enter a trade with a view to holding that position until the trend changes.

This could mean they hold a stock for weeks or months. It could also mean they exit with a 5% gain or a 50% return. To the position trader, the length of the investment and the price change don’t matter. What matters is the trend.

Whatever they’ve put their money in, the trend trader monitors the investment’s trend. As soon as they see a clear indication the trend is about to change, they exit the position. They’ll also commonly employ stop loss orders to protect their capital.

Generally speaking, position or trend trading becomes is a difficult trading strategy in highly volatile markets, since it’s more difficult to determine medium and long-term trends when prices are rising and falling dramatically.

trading strategies

Swing Trading: Buying & Selling Based On Changes In Market Sentiment

Day trading is by definition a very short-term trading strategy. Position, or trend, trading is a longer term approach.

Between day trading and position trading, sits the swing trading strategy. Swing trading isn’t about trends, nor tiny movements in price. Rather, the swing trader focuses on changes in market sentiment about particular stocks.

Moving average indicators are key to swing trading. That’s because they help the trader interpret how the market feels about a given stock. Remember, the stock market is largely a measure of how people feel about companies and businesses.

A swing trader employs a particular kind of moving average called the exponential moving average, or EMA. The EMA doesn’t only reflect the average of a stock’s price for a given period. It also factors in the latest data points for that stock.

These might include company announcements, market news or relevant current events that could impact its stock (consider the extent to which the COVID-19 pandemic impacted airline and tourism businesses, for instance).

By interpreting these data using the EMA, the swing trader, will try to determine where bullish (optimistic) market sentiment changes, or swings, to bearish (pessimistic) sentiment.

They’ll use that data to time their entry and exit points for a trade — going either long or short depending on the swing and looking to exit a position once they believe the sentiment is set to swing back.

News Trading: Predicting Market Reactions To Current Events

Many trading strategies have a lot in common with each other.

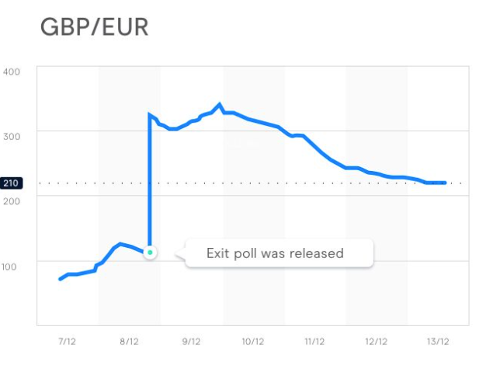
You could think of news trading as swing trading’s cousin. But rather than using technical analysis to determine when prices are likely to move up or down, the news trader monitors current events to predict how a market might react.

 Again, consider the airline example above. A news trader might interpret the breaking pandemic stories as a signal airline stocks are about to fall, and either place short trades to profit from the downside, or wait to buy shares after the fall. 

scalping trading strategy
Source: CMC Markets

See the chart above for an example of how the Brexit news had an immediate impact on the Pound/Euro exchange rate.

News trading requires a lot of research and time. It’s a less exact trading strategy that carries its own unique risks.

Scalping: Aiming to Accumulate Many Quick, Small Gains

Scalping is similar to day trading and trend trading strategies. The scalper will look for quick opportunities to profit using a combination of technical analysis and maybe some trend following.

But, rather than wait for a trend to establish itself, or change, the scalping trading strategy dictates that you get out of every trade fast.

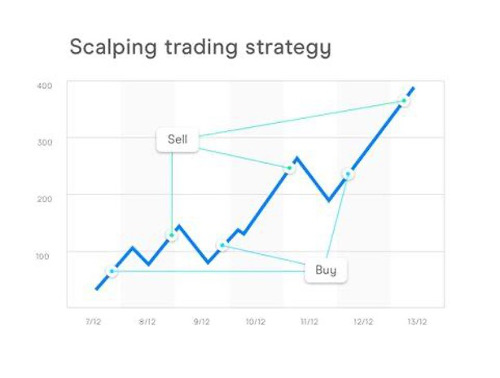
Rather than trading, say, one or two positions a day, you’d trade maybe five or 10, with the aim of gathering up a handful of small wins that amount to a solid return.

The image illustrates how a scalper might approach a trading position.

trading strategy
Source: CMC Markets

While there’s no overnight risk (as scalping is a type of day trading), this trading strategy does require discipline, focus, and a tolerance for stress.

Algorithmic Trading Strategy: The Way of Wall Street’s Elite

All the stock trading strategies above have one thing in common: The trader makes the decisions on what they’ll buy and sell, when, and for what reason.

But all those trading strategies can be augmented with another.

In algorithmic trading, the onus is on a piece of software to decide what you should trade.

Algorithmic trading — also called black box trading, or automated trading) involves a computer interpreting huge amounts of market data to determine the best way to trade the market on a given day.

The algorithm produces trading recommendations which you can either manually follow, or automate, depending on the system.

This type of trading relies heavily on the quality of the algorithm you use (and the talent of the people who create it — check out Motion Trader for an example of a very successful trading algorithm).

How To Learn Stock Trading Strategies And Get Started As A Trader

 The stock trading strategies we’ve outlined above are just a few of the main types in the market.

There’s many more — and more being created and refined all the time as markets and technologies evolve.

If you want to learn, you have a centuries worth of knowledge to draw on in the form of books, online courses, YouTube channels and more.

The best thing to do is to start learning, talk with other traders and seek to build your knowledge.

If you’re not investing already and are just starting out, you might want to consider this brilliant stock simulator where you can start testing your ideas without any risk to your capital.

portfolio tracker

However You Choose To Trade The Market, You Must Do This…

Whether you’re day trading, swing trading or an algorithmic trader, there’s one tool you should make sure you have for your journey: A dedicated portfolio tracker.

When we invest and trade, we often just focus on stock prices and returns. But, in reality, there’s many more factors that impact how much money we actually make (or lose) in the market.

That’s why you need to portfolio tracker that calculates your true, annualized performance for your portfolio and the holdings in it.

True performance is different from the simple ‘gain’ you’ll see in your trading account. It accounts for how long you’ve held a position, trading fees, currency gain, taxation and dividend income.

The portfolio tracker we run here at Navexa does all this (plus, you can generate a variety of reports, from calculating unrealized capital gains to taxable income, portfolio contributions, and many more).

Take a free trial of the Navexa portfolio tracker and see for yourself what your portfolio’s true performance really is.

Categories
Financial Literacy Investing

Short Float: What, Why, How & Examples

For the everyday investor, the world of short selling can seem like a dark and mysterious art. Perhaps one of the least understood terms in it is the ‘short float’. In this article, we explain what short float means, how it fits into trading, and how some investors use it to find profitable trades.

What is a short float?

Like many jargon terms you encounter when you get into the investing world, the short float is an often misunderstood — but relatively easy to grasp — term.

In this post, we explain what a short float means, why it exists, and how understanding it applies to everyday investing.

Plus, we share some examples of how investors and traders use the short float when they’re researching and executing trades.

Breaking It Down: What Is A Stock’s Float?

In the context of investing, the ‘float’ refers to the number of a company’s shares that are available to the public at a given time.

See, not all a stock’s shares are available for the everyday investor to buy or sell.

Shares are generally divided up into restricted and unrestricted groups.

Restricted shares are those issues to directors, executives and corporate affiliates.

The rest are available to the market.

It’s these unrestricted shares that constitute a stock’s float.

It’s important to understand that the size of a stock’s float (in other words, the total number of shares available on the open market) can impact its volatility.

A smaller float could mean it’s more difficult to buy or sell shares.

You might think checking a stock’s ‘shares outstanding’ figure will give you an indication of its potential liquidity.

But, it’s important to understand that the float is different from shares outstanding.

While shares outstanding refers to the total number of shares a stock has (including restricted shares), the float refers only to those actually available for everyday investors to buy and sell.

Short Selling: A Brief Explanation

You might have heard the term ‘short selling’ when the Gamestop story was in the headlines in early 2021.

Short selling — or just ‘shorting’ for… well, short — is when you borrow shares from a stock broker and sell them to another investor for a given price.

You also agree that you will buy those shares back at a specific time.

If you borrowed $5,000 worth of shares in a company you thought was going to be trading 50% lower in three months — and your prediction proved correct — you’d be able to buy those shares back for $2,500, return them to your broker and pocket the other $2,500.

That’s shorting in a nutshell.

It’s a way to potentially profit from prices falling instead of rising.

It’s important to note that you can’t short sell shares you own.

You have to borrow them, sell them, buy them back and return them to make money from shorting.

There have been many famous and infamous examples of traders making their fortunes by shorting assets and markets.

Kyle Bass, for example, bet about $4 billion against US subprime mortgage-backed securities right before they sent the global markets into a crash.

The Short Float Explained

A stock’s short float is the percentage of shares which investors are shorting relative to the total available — or floated — shares.

Another term for it is ‘short interest’, which says it all.

Learning about a stock’s short float means you’re learning how many investors are betting that the share price is going to fall.

According to ragingbull.com, the short float for a given stock rarely exceeds 50% — although it’s not impossible.

Generally speaking, you could say a stock had substantial short interest if the short float were above 40%.

A figure like that tells you that 40 in every hundred of a company’s unrestricted shares have been borrowed by short sellers.

Remember, shorting a stock involves borrowing from a broker, selling at market prices and agreeing to buy back and return at a specified time.

What does that mean for the everyday investor?

Primarily, you might look to the short float as an indicator of market sentiment.

While I personally prefer a value-based fundamental analysis approach, you could, for example, use the short float information to compare against a stock’s fundamentals to gain a clearer idea of where the price might be going.

How Do You Find Information On A Stock’s Short Float?

The exchange on which a stock trades should publish the numbers indicating short interest regularly.

The NYSE publishes short numbers twice a month, for instance.

Check with your local exchange to make sure you know where and when to access the data.

How Understanding A Stock’s Short Float Could Help

While the short float isn’t a complete indicator of coming price action or sentiment around a stock, it can help you understand a couple of things.

If you find that a stock has high short interest, this may mean that the company is struggling and that prices are indeed on their way lower.

If you are comfortable and competent with short selling, perhaps you’ll choose to use that as an opportunity to short.

Or, according to ragingbull.com, high short interest may be indicating that while a stock could be about to drop in value, investors are expecting the price to bounce back.

They may be trying to short the stock lower and then buy shares before it rebounds — trying to profit on the way down and the way up.

It’s never going to be obvious exactly what high short interest indicates about a given stock. There’s many possibilities.

That’s why, in my case at least, I’d be looking to pair my understanding of the short float with other forms of analysis.

For me, that would be fundamental analysis and company valuation.

For others, maybe that means technical analysis or research into news around the business and future events that could impact its profitability.

If 40% Is A High Short Float, What’s A Low One?

This trader points out that in 10 years of trading, they’ve seen a lot of short float data.

It’s possible that a short float can go to zero — that there are no borrowed shares at all and no one willing or able to short the stock.

That’s rare though.

Generally, you’d consider a stock to have a low short float if it were around 10%-20%.

When there’s little supply, as in a low float, it won’t take as much volume to produce a price movement.

For example, 10,000 shares changing hands in a stock that has a float of 1 million would, in theory, create a bigger price movement than if that stock’s float were 10 million.

In terms of the short float, this relationship between the amount of shares available and the volume matters, too.

  • It’s important to understand that float matters relative to volume.
  • You can think of the float as the supply of shares at any given time.
  • You can think of volume as the demand.

Calculating The Short Interest Ratio

The short interest ratio is a means of understanding what a stock’s short float could tell you about upcoming price action.

You can work out the extent to which short sellers are targeting a stock by calculating its short interest ratio.

How do you do it?

It’s easy.

You just need to find the short float number — remember, that’s just the amount of available shares traders have borrowed for short positions.

Then, divide that number by the stock’s average daily volume.

Some investors will refer to this ratio as ‘days to cover’.

The short interest ratio will give you the approximate number of days it would take for the market to ‘cover’, or buy, all the short positions in the stock.

The bigger the ratio, the longer it could take for the market to buy the shares from the short sellers.

And the longer it would take the market to buy those shorted shares, the higher you’d judge the short interest in that stock.

The short interest ratio will rise and fall as trades and volume fluctuate.

How Investors Can Use The Short Interest Ratio

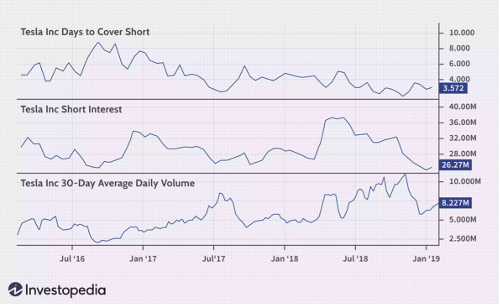
Here’s a great example of the short interest ratio at play with Tesla.

Take a look at the charts:

short float

The three charts show…

  1. How many days it would take for the market to cover the Tesla short positions — in other words, the short interest ratio.

  2. The number of shares borrowed for short selling (the short float).

  3. The daily average trading volume for Tesla stock.

This example illustrates that the relationship between the short float, short interest ratio and volume don’t always move in sync with each other.

According to the article:

In July and August 2016, the short interest ratio rose despite the number of shares short falling.

That was because the daily average volume fell sharply during that time.

Additionally, the short interest was steadily declining in 2018 despite short interest being elevated because the average daily volume was steadily rising on the stock.’

You can see that — as with most things in investing — understanding the short interest in a stock is not an exact science.

It’s important to consider information like the short float, short interest ratio and volume in relation to one another.

Short Interest Ratio Limitations

One of the main limitations of the short interest ratio — and the short float — as an indicator, is that it’s only updated relatively infrequently.

Generally, the market reports the short float (and therefore the short interest ratio) every fortnight.

By the time that information reaches the market, the short positions in a stock could have grown or shrunk.

Volume, too, fluctuates far more frequently than every two weeks!

The short interest ratio — even if were updated on a daily basis — is really only a guide.

Current events and market news also impact trading volumes greatly.

Think of the stock in the example from Investopedia above, Tesla.

This is a stock that often produces dramatic price movement thanks to its high profile business operations and highly visible CEO.

If you were looking at the short interest ratio on the day Tesla announced its massive Bitcoin investment in early 2021, for instance, and that information was two weeks old, the numbers probably wouldn’t be accurate at that time.

Short Float Versus Short Interest Ratio

Now that you know what the short float and the short interest ratio are, be sure to understand the difference between the two.

Remember, the short float is the number of unrestricted shares investors have borrowed to short sell in the hope that they can buy them back at a lower price.

Investors will sometimes refer to the short float as short interest.

But short interest and the short interest ratio are two different things.

The short interest ratio is a formula you use to determine how many days it would take the market to buy — or cover — all the shorted shares.

Now You Know How To Determine & Interpret The Short Float

If you came into this blog post unsure about what short selling, short float and short interest meant, I hope you now have a much better idea.

Like other methods of analyzing a stock, trying to interpret short interest isn’t an exact science.

When you’re sizing up a potential investment and trying to determine whether you want to risk your capital on it — and bearing in mind this post is general information, not investment advice — you can never be 100% sure what a stock is going to do next.

But, what you can be sure of is how your investments and portfolio are performing to date given the decisions you’ve made.

While past performance is no guide to future returns, understanding the details of your portfolio performance is, I believe, a crucial part of forging a profitable wealth building journey.

That’s why my team and I developed the Navexa portfolio tracker — a platform that gives you in-depth true performance analytics on your stocks, ETFs, cash accounts, cryptocurrencies and even unlisted investments like property.

Categories
Financial Technology Investing

Direct vs. Portfolio Investment: We Weigh Up The Pros & Cons

You have two main options for exposing your capital to the stock market: Direct and portfolio investment. Which suits investors best depends on a variety of factors. Let’s take a look at the case for direct versus portfolio investment. 

Should you buy a stock, or buy an exchange-traded fund? In other words, should you buy shares in a single company, or buy shares in many companies, to generate the best return?

It’s a question that divides investors and analysts alike, largely because the answer depends on the individual’s objectives and risk tolerance.

In my eight years’ investing experience, I’ve opted exclusively for stocks instead of funds. That’s because I prefer to research companies directly. It just suits me to invest directly, too.

And that’s not to say I have anything against ETFs or ‘portfolio investing’. As you’ll see in this post, each method has its own merits and potential drawbacks.

Buying Individual Stocks vs. Buying Shares In A Fund

When you buy shares in an individual stock, you’re tying your capital to the fortune — or misfortune — of a single company. You’re not investing on the basis that the wider market, or the sector in which your stock operates, is going to rise.

You’re betting that this single company is going to outperform its competition and ultimately beat the market’s returns. On the other hand, when you buy shares in an ETF, you’re buying a sector, or bundle of stocks that share a common property.

This ties your capital to what happens to the group as a whole, not the performance of a single company.

We sometimes refer to this as ‘portfolio investing’, since you are in effect buying a slice of a pre     defined portfolio of equities     , rather than directly buying stocks for your own portfolio.

The Advantages Of Direct Investment Into Stocks

I’m biased here, because as I said, I have invested exclusively in individual companies as opposed to ETFs or portfolio investments. But, I am going to cover the advantages and disadvantages of both.

Please bear in mind, that this is general information on this topic and it does not constitute financial advice. Each of us has our own unique set of preferences, goals and challenges.

So I encourage you to do your own research and seek professional advice before you make any investment decisions one way or the other.

So, to direct investment in stocks.

Here’s the biggest advantage: If you’re a keen and diligent investor who’s not afraid of putting in the hard yards to research and value individual stocks, you may be able to generate a higher return than just parking your money in an ETF.

Each company trading in the market has an extensive set of factors driving its stock price at any given time. It could be a new technology or product, an acquisition or deal, a piece of legislation that impacts the business… whatever it is, events often impact certain stocks in certain ways.

If your research leads you to one of these opportunities — say, a biotech stock trialling a revolutionary treatment that could save millions of lives, for instance — then direct investment into that one stock could potentially make you more money than an ETF than contains that stock in its portfolio.

The Disadvantages Of Direct Investment Into Stocks

As we pointed out in our blog on the pros and cons of dividend reinvestment policies, concentrated exposure of capital to a particular investment brings as much risk as it does potential reward.

If you’re the type of investor who puts in the research to find and buy great stocks that deliver strong returns, then direct investment could be a profitable strategy for you.

However, no amount of research will change the fact that buying shares in a single company means you expose your capital to its stock’s potential to rise and fall.

The old ‘eggs in baskets’ analogy is useful here. Buying a single stock as opposed to buying a portfolio of stocks in the form of an ETF is akin to putting your eggs in one basket.

It’s a question of risk.

Just as a particular company can outperform a sector or market, so can it underperform and drop in price even when other, similar stocks are performing relatively well.

Diversification is perhaps the most common idea when we talk about managing and mitigating risk in an investment portfolio.

Direct investment in one stock is about as far from diversified as you can get, whereas ETFs are created by professional portfolio managers to whom diversification and risk management are often their primary objective.

KEY TAKEAWAYS

  • Expose your capital to the exact stocks and companies you choose.
  • Requires more independent research.
  • Potential for high returns if the individual companies you invest in outperform the market.
  • Investing in just a few stocks may compromise your portfolio’s diversification.
  • Risk of lower returns if individual companies you invest in underperform their sector or the wider market.

Read more here.

The Advantages Of Investing In A Portfolio or ETF

I don’t personally invest in ETFs. And I’m certainly not advising whether direct or indirect investment is best for you.

The idea of indirect investment in markets or sectors through ETFs is a valid and increasingly popular one today. Many of us know we need to be exposed to the stock market in order to build out wealth over the long term.

But, equally, many of us don’t have the time to put in the long hours of research and analysis to find the particular stocks that might suit our goals.

An ETF is like a mini-portfolio of investments. Depending on what’s in the ETF, it may offer investors some risk-management in the form of diversification.

For example, if you bought a biotechnology ETF comprised of, say, 100 companies, you’d get exposure to that sector and the performance of all the equities in the fund.

The fund might include assets that hedge against risks to the biotechnology sector. This indirect way of getting exposure to these companies might then come with less risk than picking and investing in a single one.

Also, when you consider the time and energy it takes to research, execute and monitor investments, indirect investment in an ETF can alleviate some of the burden that comes with direct investing.

If you want to gain exposure to biotech stocks and you simply don’t have the time to dive in to all the research on the various companies and factors in their performance, you could opt to buy a fund that broadly, indirectly exposes you instead.

The Disadvantages Of Portfolio Investing

As with direct investment in individual stocks, ETF, or portfolio investing, comes with potential downsides, too.

I’m not saying these apply to every ETF out there, but the following points you may want to consider when weighing up direct versus indirect investment.

  1. An ETF may not be as diversified as you’d like: With stability and risk management high on the list of fund managers’ concerns, ETFs may skew towards large and mid-cap companies. This might mean you miss exposure to potentially high-growth small cap stocks in the sector.

  2. You may pay higher investment fees: When you buy a single stock, you’ll pay a brokerage fee. When you buy shares in an ETF, you’ll pay a brokerage fee and a management fee — usually as a percentage of your investment’s returns — to the people running the fund.

  3. Your dividend yields may be lower: Because ETFs by design track a broader market or sector, they generally don’t prioritise yield. Having said that, there are some funds out there that focus more on income than capital gain.

The sheer variety of stocks and funds out there means these pros and cons certainly don’t apply across the board. And remember, it’s important to do your own research and consider your goals and risk tolerance.

KEY TAKEAWAYS

  • Quicker way to get exposure to an entire sector or market.
  • Allows you to effectively outsource the research to the fund managers.
  • Gives you more diversification because one share of an ETF exposes you to the portfolio of the fund’s investments.
  • Potentially higher investment and management fees.
  • Potentially lower dividend yields.

My Personal Preference: Direct Investment In Stocks I Know Well

As I’ve said, I don’t buy ETFS.

I’ve never bought shares in anything other than individual stocks. Why? Because, in the same way some of us prefer to drive a manual car over an automatic, I prefer having a greater degree of control over my investments.

That’s not to say that because I prefer stocks I am more in control of my returns. But, in my experience, I am more in control of the assets to which my capital is exposed by being in the market.

Research, for me, isn’t a chore. I enjoy digging into a company’s price movement, financials and business model to uncover investment opportunities I believe are going to make me great long-term returns.

Direct investment means I can control every aspect of my portfolio’s composition, diversification, the extent to which I’m targeting income versus capital gains, and so forth.

While there may come a time when indirect investment suits my needs, right now I prefer to have my portfolio in my own hands — not the hands of fund managers.

However You Prefer To Invest, You Must Track Your Performance

I hope you now grasp some of the pros and cons of both direct and indirect investment. Like I say, it’s really up to you how much diversification you seek and risk you take on.

Your financial objectives and challenges are no doubt different from my own.

But, whether you prefer investing in single stocks, or the broader exposure you can get by indirectly owning large groups of stocks through an ETF, there’s one thing you absolutely should start doing.

If you don’t do this already, you may not have a clear picture of how your investments are performing for you. What am I talking about?

Tracking your true portfolio performance.

Over my eight years as a self-directed investor, and more recently launching a dedicated portfolio tracking platform, I’ve learned that far too many people ignore crucial facts about their investment performance.

One of the main reasons for this is, in my opinion, the average broker doesn’t provide sufficient detail for you to accurately measure and analyse your portfolio.

For instance, if I tell you that a single stock investment and an ETF investment have produced the same return, say 100%, would you say there’s nothing to choose between them?

Looking at the average broker account, it might seem that way, since most display a simple ‘gain’ metric.

But what if I told you that the stock took a year to return that 100% and the ETF took three?

You’d see that the stock was the better option, right? So, if you’re serious about generating great returns for yourself over the long term, I encourage you to look beyond just ‘gains’.

Three Tools I Use To Better Understand My Returns
(And, Hopefully, Make Better Investing Decisions)

As a dedicated portfolio tracker, Navexa gives me insights into my portfolio performance I simply cannot get through my broker. Here are three tools I use to better understand portfolio.

Annualized Returns: Navexa’s performance calculation factors in everything that affects my portfolio. Time, taxation, trading fees, dividend income, currency gain and losses — everything that impacts what I would exit the trade with when all is said and done. When I look at my portfolio in my account, I know I’m seeing my true performance.

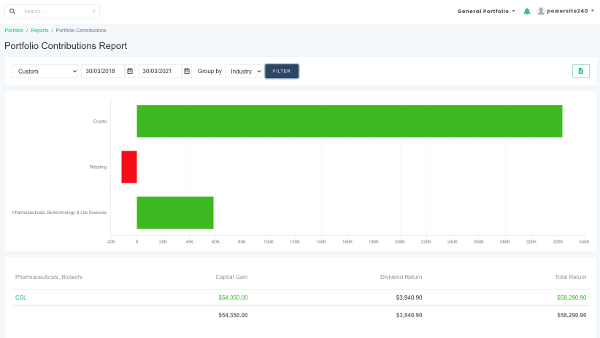
Portfolio Contributions: This reporting tool shows me which holdings are boosting, and which are dragging down, my overall returns. This helps me to make decisions on which stocks to sell and keep.

Direct vs Portfolio Investment

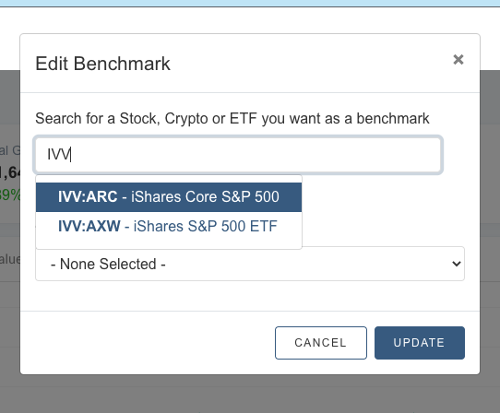
Custom Benchmarking: This one is especially useful if you’re comparing your portfolio against an ETF. If you have a portfolio of individual stocks, like I do, and you see that a given ETF (Navexa lets you benchmark against any security or fund traded on the ASX, NYSE or NASDAQ) is outperforming your portfolio, you might consider switching up your strategy!

Direct vs Portfolio Investment

I hope this post has helped you understand some of the differences between direct and indirect investment. Remember, you’re on your own investing journey — none of the above is financial advice.

Whether you directly invest in stocks, or you opt for a portfolio investing strategy through ETFs, always remember you’re risking your capital in the stock market.

Risk is the price we pay for the chance to earn better returns than leaving our money in the bank.

And the elevated risk levels I live with as a self-directed investor are a big part of why I founded Navexa.

Learn more about our dedicated portfolio tracker.

Categories
Financial Technology Investing

CommSec Review 2022: Is CommSec’s Trading Platform Still Worth It?

CommSec is one of the most popular trading platforms in Australia. I’ve been a customer for nearly a decade. In this in-depth CommSec review, I share my experiences and give my honest opinion on the pros and cons. 

If you’re investing in Australia, chances are you’ve heard of CommSec. 

The trading platform attached to one of the country’s biggest banks (Commonwealth Bank of Australia) is one of the highest-profile stock brokers in the national market. 

More than half of Australian investors choose CommSec for their share trading, investment research, and more.  While the platform’s brokerage fees are among the highest in Australia, it remains a massively popular share trading account choice.
That’s despite the proliferation in recent years of several digital-first trading platforms — like SelfWealth, STAKE and Pearler — giving greater numbers of investors greater choice in who they can invest with, with low or even no trading fees.

Run by Commonwealth Bank of Australia, CommSec has been in business nearly 30 years, having launched in 1995. Today, CommSec share trading encompasses both its extensive web platform as well as CommSec Pocket, an ETF-focused mobile app.

My CommSec Review: What I Love — And Dislike — After 10 Years As A Customer

This in-depth CommSec review gives you my honest opinions about the platform.

I’ve been using CommSec to trade since 2013. In my nearly 10 years of researching and executing trades in Australian shares and exchange traded funds with Australia’s largest broker, I have a lot of experience with the platform’s features, strengths, and weaknesses.

I wouldn’t continue to use it were it not a robust, reliable provider of brokerage and settlement services. But, as you’ll see in this CommSec review, while the platform does deliver a lot of value, in my opinion, it’s not perfectly suited to all my needs around measuring and tracking performance.

This CommSec Review will cover:

  • How to open and set up a CommSec share trading account
  • How to buy and sell shares using CommSec
  • A review and comparison of CommSec’s trading fees
  • A guide to the CommSec share trading platform’s key tools and benefits
  • One critical weakness to CommSec — and other major Australian share trading account providers
  • A tool my team and I have designed to help CommSec customers get better, more accurate information about their investments and portfolio performance.

Before you read on, full disclosure: I’m the founder of Navexa, a dedicated portfolio tracking platform. While my product doesn’t compete with CommSec in any way, my views on certain aspects of the CommSec platform may be (let’s face it, they are) biased. 

Opening a CommSec Account: Here’s What You’ll Need

If you’re an Australian resident with all your basic credentials at hand, it’s pretty straightforward to open a CommSec account. 

Make sure you have these details ready:

  1. The personal details from an official ID like your passport or driver’s license. 
  2. A valid Australian residential and postal address.
  3. A valid email address.
  4. Your mobile phone number.
  5. Your Australian (or, if applicable, overseas) tax information. 

Got all that? Then you’re good to go.

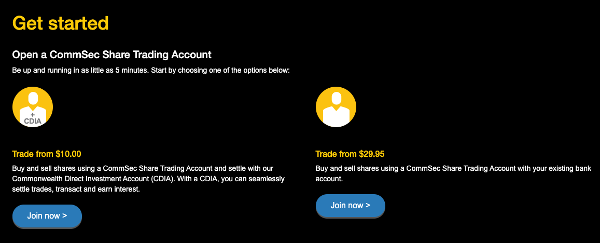
Now, you have two options when you create your CommSec account.

Commsec Review

The first lets you create a CDIA (Commonwealth Direct Investment Account) when you create your trading account.

The second lets you use your existing bank account for your trading transactions and settlements. 

As you can see, CommSec incentivizes you to open a CDIA with them rather than use another bank account. 

Transacting and settling with them means you can trade for as little as $10 as opposed to about three times that if you choose not to. 

Your next stop is a standard series of forms, which, I have to say, are pretty painless given the high level of regulation around investment services. 

Buying & Selling Shares Using Your CommSec Account

So you’ve set up and verified your CommSec trading account.

You’re ready to buy shares. 

Shares, I should add, that are fully CHESS sponsored. CHESS sponsored simply means that any shares you buy through a CommSec share trading account are recorded by the ASX’s Clearing House Electronic Subregister System — the system which the Australian Stock Exchange uses to manage share transactions.

You’ll find a lot of opinion and comparison online about CHESS sponsored share trading. What it boils down to is that when you buy a stock through CHESS sponsored trading accounts, your ownership of the shares is recorded directly with the exchange, as opposed to a third party, like a broker.

According to CommSec, the benefits of CHESS sponsored shares include the ability to make faster sell trades (thanks to trade information being stored directly with the exchange) and being able to ‘automatically keep track of your portfolio and its market value’.

That last point isn’t, as you’ll see, entirely accurate. But, I’ll get to that shortly.

Here’s a quick guide to making a trade in your CommSec trading account.

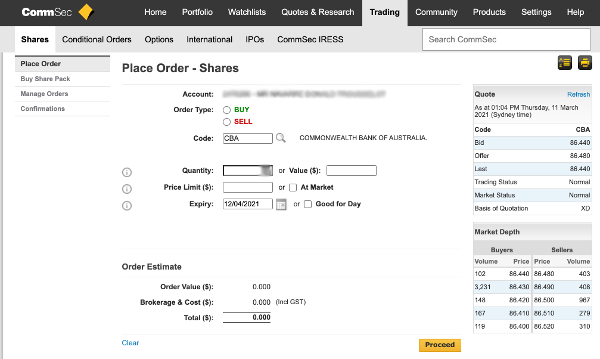
Along the navigation bar at the top of your account, click ‘Trading’.

That will bring you to the screen below:

CommSec Review

Buying And Selling Shares In CommSec

Like most traditional trading platforms, CommSec’s buy and sell function is pretty self-explanatory. 

  1. Select either BUY or SELL.
  2. Enter the ticker symbol of the stock or fund you wish to trade — this will bring up a useful table to the right showing you the current quote details and market depth data below that.
  3. Enter either the quantity or value you wish to buy or sell.
  4. Then, enter the price limit or select ‘At Market’ if you’re not worried about short-term price fluctuations while CommSec fulfills your order. 
  5. Finally, use the dropdown menu to choose an expiry date for your order, or select ‘Good for Day’.

Now, you’ll see the order details estimated in the table below.

From there, just hit ‘proceed’.

In my experience, executing trades in my CommSec account is straightforward.

I like that I can control my buy and sell limits, and set orders to stay in the market until an expiry date if I need to. 

I also value the quote/market depth snapshot I get each time I enter a ticker symbol before I enter the particulars of a trade. 

Buying & Selling International Shares With CommSec

It’s worth noting that buying and selling foreign shares through CommSec’s share trading account isn’t as straightforward as some of the newer, app-first trading platforms have made it.

To trade internationally, CommSec requires that you create something called a Pershing account. To do this, you have to complete the W8-BEN-E US tax form, which CommSec will lodge with the IRS for you. Other platforms don’t require this, and have automated the US tax registration process as part of their onboarding, since US shares and ETFs are front and centre of their product offering.

Not only is this manual form requirement a bit of a hassle, CommSec’s fees for international trading are definitely at the more expensive end of the market — as are their fees for trading Australian shares, which we’ll cover in the following section.

Not The Smoothest Onboarding Process For International Share Trading

Some customers have found CommSec’s international trading process so clunky they’ve given up after multiple failed attempts at completing the registration. One even reported having to print and scan physical documentation — which in 2022, seems unnecessarily time consuming when so many other share trading platforms have nailed smooth, automated onboarding.

So, those are the basics of getting started — creating your CommSec account and placing your first trades.

Now, let’s dive in and review some of the key features CommSec offers customers.

As I said, I’ve been trading on the platform since 2013. What follows are my personal opinions based on my experience. 

Let’s start with CommSec’s fees.

CommSec Share Trading Fees: Some Of Australia’s More Expensive Brokerage Fees

CommSec encourages you to choose their CDIA-linked trading account by saying ‘Trade from $10.00’.

While that’s a good price for a single buy or sell, I want to point out that this only applies to trades up to $1,000.

For trades over $1,000 and up to $10,000, you’ll pay $19.95.

For trades over $10,000 and up to $25,000, CommSec will charge you $29.95.

Above $25K, you’ll pay percentage-based brokerage fees; 0.12%.

As this list shows, there are plenty of trading platforms that will charge you much lower trading fees. 

Over on CommSec’s Pocket mobile app, the fees are different. They’ll charge you just $2 for trades up to and including $1,000, and 0.2% on anything above that. Bear in mind, though, that CommSec Pocket is aimed at beginner investors and offers a limited selection of ‘themed’ ETFs, as opposed to the full range of shares, funds, derivatives, options and CFDs you can find in the full CommSec platform.

For international trading, CommSec’s brokerage fee structure is as follows:

  • USD $19.95 for trades up to USD $5,000
  • USD $29.95 for trades up to USD $10,000
  • 0.31% for trades above USD $10,000

See a complete brokerage fee schedule for CommSec share trading accounts.

For me, while CommSec’s fees may not be the lowest available, the platform does justify its pricing in one other key area. I’ll cover that later in this Commsec review. And with approximately 55% of Australian investors choosing to trade with a CommSec share trading account despite the relatively high costs (and less-than-optimal international share trading registration process), it would appear I’m not alone.

Everyone’s personal situation is different, but I know that in my own investing, I prefer to take my time with research and strategy before making a trade. This means I tend to place few trades, and hold positions for longer periods than other investors might. So CommSec’s higher trading fees don’t impact me as much as someone who’s placing multiple trades a week, for example.

CommSec’s Portfolio Section

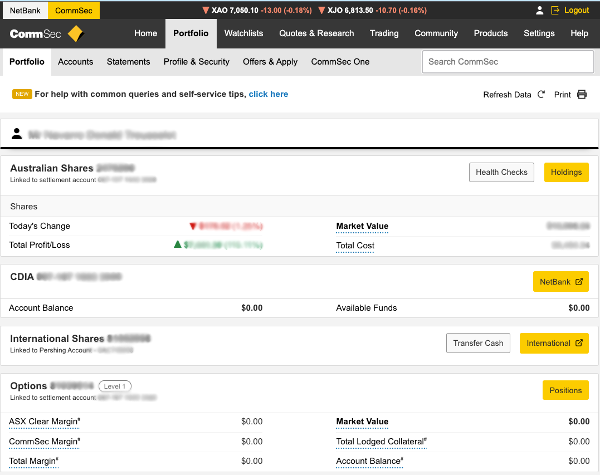
Let’s take a look at the CommSec share trading account in a bit more detail. The interface has two rows of navigation. 

Along the top, you see the major sections, including Portfolio. When you click one of these tabs, you’ll see a sub-menu below it.

In the case of the Portfolio tab, you’ll also see Accounts, Statements, Profile & Security, Offers & Apply, and CommSec One — a high level service for advanced traders.

In my opinion, you can’t criticize CommSec for a lack of information and resources. My account is packed full of data and tools to help me research and execute trades smoothly and securely. 

I also know from my own experience and talking with fellow investors, that CommSec’s long-established dominance in the trading industry here in Australia provides a sense of security which sometimes isn’t apparent with newer, smaller trading platforms and apps.

I’ll quickly walk you through all the information you can find under the Portfolio tab.

First, you’ll see an overview of your trading account:

  • Today’s change in dollars and percentage terms.
  • Your total profit or loss. 
  • Your CDIA account balance (if you’ve selected it during setup). 
  • Information on international shares and options, if these apply to you.

I don’t personally trade international shares, options, or other more complex financial products, so I can’t review these parts of the CommSec service. I prefer to invest in companies and ETFs. Derivative and CFDs have a track record of losing money for most retail investors who trade them, which is part of the reason I’d rather keep it simple!

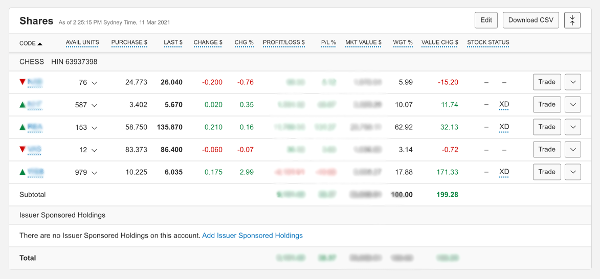
Under Accounts, you’ll see a holding-by-holding breakdown of your portfolio.

CommSec-Review

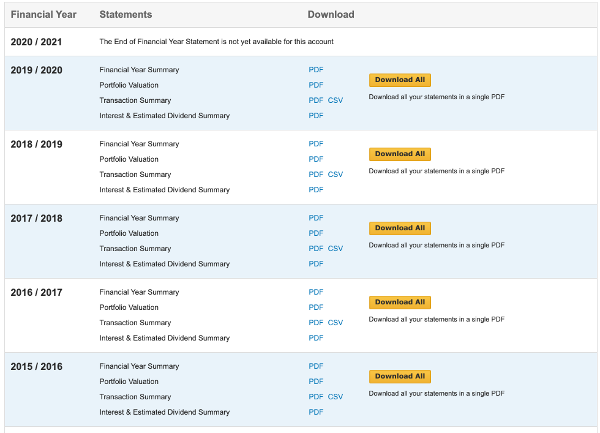
Under Statements, you can view and download trading account statements by financial year. 

CommSec Review

Profile & Security contains your CommSec accounts display, personal and password settings.

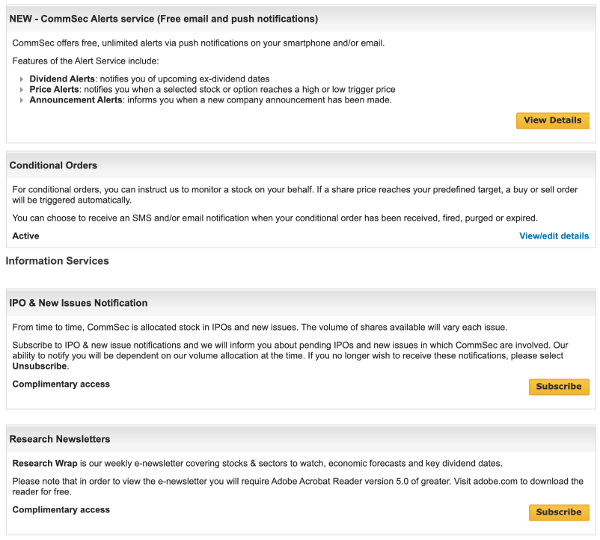
Offers & Apply may at first seem like nothing more than a screen on which to set your email promotion alert preferences, but scroll down and you’ll see a large amount of potentially very helpful options!

CommSec Review

Here you can subscribe to research newsletters, IPO alerts, and CommSec’s email and push notification alert service for updates on trigger prices, upcoming ex-dividend dates, and more. 
This is a great example of the serious firepower CommSec offers investors who want tailored, up-to-date data about their portfolio or investments they’re researching. 

Great Market Intel & Trade Research Tools

I can’t fault Australia’s largest share trading platform for the wide range and depth of tools they’ve packed into it for investors over nearly 30 years in business. But, as I’ve alluded to, it amazes me that even after so long at the top of the country’s online share trading market, CommSec and parent company CommonWealth Bank, like pretty much all other trading platforms out there, don’t make it easy to fully understand portfolio performance.

As I’ll explain shortly, price action and holding value are, of course, important to investors. But they’re not the only factors in actual investment performance.

Still, in my experience, CommSec makes it easy to access information about both your existing trades and the relevant market intelligence you want for your next potential buy or sell. While plenty of new share trading platforms have entered the market since I became a customer — many of which have campaigned for my business on the basis of low or non-existent brokerage fees — CommSec has retained me in the changing market largely due to the range and depth of trading and research tools in my account.

This brings me to the next feature I want to highlight.

How CommSec’s Watchlist Can Help Your Investment Research

One of my favourite features of the CommSec platform is the Watchlist section. 

You can find it between the Portfolio and Quotes & Research tab along the top of your account. 

When I make an investment — a buy or a sell — I prefer to do a lot of research into the company, its stock, and especially its valuation. 

I’m a disciple of the Warren Buffet and Charlie Munger school of investing. This means I prefer to adopt a ‘deep dive’ approach into individual businesses to uncover companies that are trading below fair value. Although to be honest, these days I am growing more enamoured by exchange traded fund investing and the way it lets you buy into large trends, themes and sectors.

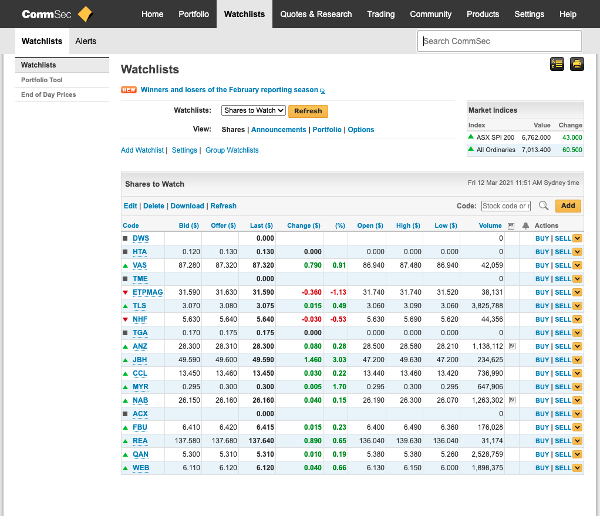
Whether I’m looking at a company or an ETF investment, the watchlist tool in my CommSec account provides me with an excellent way to shortlist and monitor potential trades.

I can easily create multiple lists of stocks and funds I want to analyze and track — sometimes for months.

CommSec Review

When I check my watchlist, I can see at a glance what these assets are doing in the market.

I can rank them by price movement, open, close, volume, and more.
And, I can just click the end of each row to open a buy or sell trade on any of them. 

I can also toggle the view and see things like announcements, which I find useful in the research phase.

This part of my investing — the research — is largely what keeps me on board as a CommSec customer. That, in my experience, mitigates the CommSec share trading account’s relatively higher fees and explains why the CommonWealth Bank of Australia owned trading platform remains such a dominant player in the market.

Let’s dive into the research side of a CommSec account in more detail.

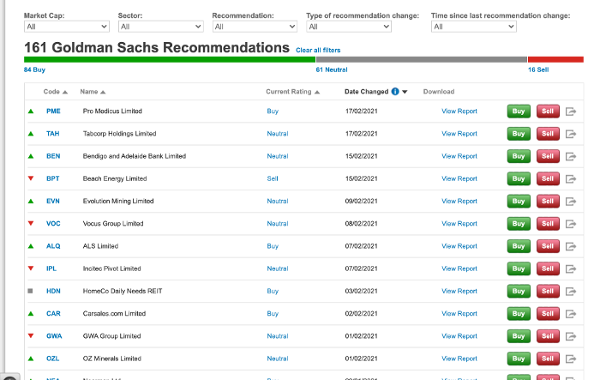
CommSec’s Research Tools Are Second To None In Australia 

If you click Quotes & Research, you’ll come through to what, in my opinion, is an absolute war chest of investment research.

One that, as I’ve said, makes CommSec’s relatively high trading fees a little easier to stomach.

Some of the tools and resources CommSec have packed into the platform are, in my own and others’ experience, far superior to what you’ll get access to with other trading accounts — particularly the newer generation of lean, app-first brokers.

In the Market tab, you can see what’s happening on the ASX right now.

  • A performance heat map.
  • Latest headlines.
  • Official CommSec summaries. 
  • Video reports.
  • A list of upcoming dividends.

These make this page alone super useful to anyone wanting to keep their finger on the market’s pulse. It’s why some investors I know barely use any other platform for keeping track of market news, announcements and analysis.

The Sectors tab lets you drill down on each of the ASX’s sectors with performance graphics, peer analysis, headlines, and research from Goldman Sachs — a global leader in investment research.

You can also see market-sensitive announcements and trending searches!

One particularly useful tab — and one that in my opinion is great for those just learning about investing in the market — is Trading Ideas

The Trading Ideas screen comprises recommendations from Morningstar and Goldman Sachs on which investments their analysts believe are worth buying, selling, or holding. 

You can find more from Goldman and Morningstar on the Recommendations tab.

You’ll also find an ETF Screener and Stock Screener among many other useful tools. As my own interest in ETF investing has grown in the past couple of years, I’ve found resources like this super useful. And they’ve only reinforced my decision to open a CommSec account and remain a customer.

Having access to stock-specific research from providers of this calibre is a huge asset for the everyday investor. I can compare my own findings and opinions against detailed research papers from some of the biggest names in the investment intelligence business. 

CommSec Review

At the time of writing, there were 161 Goldman recommendations in my CommSec account. And I don’t just mean the ‘Buy’, ‘Sell’ or ‘Neutral’ in the ‘Current Rating’ column. If you click on ‘View Report’ you’ll go through to an incredibly detailed, in-depth research paper the bank has published on that stock.

For instance, the Pro Medicus Limited report is 16 pages long and packed with more charts and commentary than you might find in an hour of your own independent research online. 

Diving this deep into your CommSec account does deliver some major firepower when it comes to acquiring knowledge on a potential investment. In practice, though, I wonder how many of CommSec’s legion of customers use the full extent of their platform. With so many investment options and research tools supporting those investment options, there is certainly a risk of information overload and analysis paralysis.

In my opinion, not only is CommSec a robust, secure, and reputable (if not the cheapest) trading platform. It’s a portal for self-directed investors to connect with market-leading research and recommendations from some highly respected and credible sources.

For this reason alone, I believe CommSec is a brilliant trading platform for Australian investors. The numbers show I’m far from alone in judging Australia’s most popular trading account in this way.

However, when I consider all my needs as a self-directed investor, there’s one area where I feel CommSec is lacking. And this isn’t something you’ll find in many, if any, other CommSec review posts doing the rounds online. While it’s common knowledge that CommSec charges some of the highest brokerage fees in the industry (yet maintains market dominance despite competitors offering little to no brokerage fees!), it’s perhaps not as widely known that there is a significant hole in the platform’s performance tracking.

CommSec Customer Service: Multiple Ways To Get Support

One of the other benefits to using CommSec is that Australia’s dominant trading platform offers myriad ways to resolve issues and seek help with your account.

From a well-structured FAQ page, full product disclosure statement documentation, and plenty of guides on the various processes you can use CommSec for, you’ll likely be able to find what you need without escalating a query to live support.

But, if you do need to reach out, CommSec has branches for email support, phone contact in Australia and from overseas, plus this Twitter account, which seems to be actively monitored and can provide pretty prompt assistance.

CommSec’s Weak Point: Portfolio Performance Tracking

Full disclosure: I am the founder and lead developer of a dedicated portfolio tracking platform designed purely to help self-directed investors understand their true returns and performance.

My platform, Navexa, which hosts this blog, is a broker-agnostic performance tracker and tax reporting tool. While any performance tracking and analysis you get within your brokerage account will limited to the trades you’ve placed within that platform, we’ve built Navexa to allow investors to track everything in one place. Whether it’s crypto, stocks, unlisted investments like property — and whether you have those investment in one or 15 different accounts — you can track every gain, dividend, trading fee and much more in our platform.

So you could say I’m a little biased on the point of assessing broker platforms’ performance tracking — even a platform I’m a long-term, satisfied customer with.

But here’s the thing.

Despite giving me loads of valuable information on the market and the various recommendations I just mentioned, CommSec doesn’t deliver a huge amount in the way of data, analytics and reporting about my portfolio itself. 

Take a look at the portfolio screen.

CommSec Review

Having been in the market since 2013, and done my fair share of buying and selling, all I can see are two performance metrics: Today’s Change, and Total Profit/Loss.

To be blunt, that’s not enough for me.

Why? Because portfolio performance is a lot more complex than just my total profit or today’s change.  I need to see lots more. 

My annualized return, for one. What about brokerage fees? Taxes? Dividend income? All these factors impact my returns, so I want to see them all when I’m checking my portfolio in my CommSec account. 

I bought NAB shares a few years ago. After a while, I checked how my trade was doing in my CommSec account, according to which I had made no gain, 0% return. Now, based on that information alone, I might have said to myself, ‘this trade is going nowhere, I’d be better selling my shares and buying something else’. If I’d done that, by the way, I would have of course incurred another round of trading fees, which when you track them — especially for a more expensive provider like CommSec — quickly add up to a significant impact on your actual returns.

But the reality of my NAB investment was not what CommSec was showing me. In fact, I’d earned a significant amount of dividend income during the holding period. So much dividend income, in fact, that the income return had pretty much meant I’d realized a nearly 100% gain, despite not seeing any significant change in the share price.

That’s just one example of how a lack of complete portfolio performance tracking can lead investors to form a mistaken opinion about their investments.

I don’t point this out to bash CommSec. CommSec is a trading platform designed to deliver robust brokerage services and market intelligence. It does not promise or deliver extensive portfolio performance tracking. It delivers massive value in terms of trading tools and investment research. But the lack of comprehensive portfolio performance tracking is the reason this CommSec review wouldn’t award a 10/10.

But — and this is also my personal, and obviously biased opinion — CommSec falls short of my requirements for tracking, analyzing, and understanding my portfolio performance beyond just my daily or annual gains.

CommSec: More Than Enough Value Despite The Brokerage High Fees

As I’ve said, I’ve used CommSec for my investing since 2013. 

The platform gives me more than enough functionality and value to justify trading on it. 

However, as a self-directed investor with an appetite for data and analytics, I ran into problems when trying to track my portfolio performance using my CommSec share trading account alone. 

That’s precisely why I created and launched a dedicated portfolio tracker, Navexa

The Navexa portfolio tracker

Navexa tracks the annualized, true performance of my portfolio and its constituent holdings with far more detail than I can access in my trading account. 

By ‘true’ performance, I mean my net gains (in dollar and percent terms) after I’ve accounted for the time in the market, trading fees, currency gains or losses, taxation, and dividend income.

In other words, my portfolio tracker gives me a complete picture of my actual portfolio performance, as opposed to a partial one. 

And as I mentioned earlier, our platform is broker-agnostic. This means you can track all your investments from as many different trading accounts as you like in the one place. This is especially powerful at tax time, when accurate and complete trade and transaction records are paramount.

Plus, I can generate a variety of reports, from calculating unrealized capital gains to taxable income, portfolio contributions, and many more. 

So, for me, pairing my CommSec trading account with a dedicated portfolio tracker like Navexa gives me everything I need.

I can research and execute my trades in my trading account.

And I can track and analyze those investments and my portfolio as a whole in Navexa.

I hope my CommSec review has been helpful for you.

If you’re interested in learning more about your true portfolio performance, beyond just what you can find in your CommSec account, check out Navexa

Categories
Financial Technology

Adding Your NAB Trade Portfolio to Navexa

It’s now easier than ever to export your historical trades from your NAB Trade account — and automatically add future buy and sell trades — to your Navexa portfolio tracker account.

Navexa’s portfolio tracker provides insights into holding and portfolio performance, returns, income, diversification, tax and more.

To deliver accurate and up-to-date tracking and analytics data on your portfolio, your Navexa account requires that you upload your data.

There are three ways to do this.

First, you can add your holdings manually, one at a time.

If you only hold a handful of stocks and you trade relatively infrequently, this might suit you just fine.

Just select ‘Add Holding’ next to your portfolio’s name when you’re viewing your portfolio in Navexa to add holdings manually.

The second way to add portfolio data to your account is to upload a .csv or .tsv file using our Portfolio File Uploader tool.

This requires that you collate and format the document and run it through our tool to ensure we correctly add each of your trades accurately.

To add data this way, select ‘Import Portfolio File’ from the dropdown menu next to your portfolio name.

But if you’re trading with NAB Trade, there’s a third, much quicker, more direct way to accurately add your historical trade data to your Navexa portfolio.

Quickly & Easily Add Your NAB
Trade Portfolio to Navexa

Here’s the best way to add your historical trades to Navexa if you’re a NAB Trade customer.

Next to ‘Add Holding’, you’ll see the option to ‘Import From Broker’.

Import From Broker
Import From Broker

This brings you to a list of brokers. Simply find and select NAB Trade.

Below the NAB Trade account screenshot, you’ll see a list of steps to go through to export and add your data to Navexa.

NAB Trade file uploader

Follow the instructions in the list:

Step 1: Click the ‘Trading’ menu.

Step 2: Then click ‘Confirmations’

Step 3: Set the date range to the maximum range you want to import and click the ‘Apply’ button.

Step 4: Click the ‘Download’ button.

Step 5: Once the file is downloaded, upload in Navexa below:

From here, select ‘Choose File’ to find it on your computer.

Then, click ‘Upload File’.

Now, you’ll see this:

Broker File Upload

It should only take a few minutes for your NAB Trade data to show up in your Navexa account.

You’ll receive an email confirming this.

Then, you’ll be able to use your Navexa account to browse all your historical NAB Trade trades and holdings!

Automatically Add New NAB Trade Buy & Sell Trades to Your Navexa Account

You can use Navexa Link to automatically forward your NAB Trade contract notes to your account.

This will mean every time you make a new trade, you’ll see it reflected in Navexa shortly afterward.

This is how you set it up.

Click ‘Manage Portfolios’.

Find the portfolio you want to update with your new trades, click ‘Actions’, then click ‘View/Edit’.

Under ‘Navexa Link’, you’ll see an email address.

This is your unique forwarding email address for the portfolio.

Copy it, go to the email account where you receive your NAB Trade contract notes, then create an email rule that forwards all future contract note emails to this address.

Just allow five minutes or so for us to set up your account to display the new trades.

Integrating Your NAB Trade Account
With Navexa Has Never Been Easier

With our NAB Trade Broker File Upload, and Navexa Link, you just need to complete two tasks when setting up your Navexa account.

Upload your historical trades to bring your Navexa account up to date with your NAB Trade account.

Then, set up Navexa Link contract forwarding for your portfolio or portfolios.

You’ll never have to manually add a trade again.

And if you want to create another portfolio, simply repeat the process for historical trades and contract note forwarding.

Categories
Financial Technology

Integrating Your CommSec Trading Account With Navexa

We’ve created an easy way for you to use data from your CommSec broker account in your Navexa portfolio tracking account. Read on to see how to add historical trades and automatically update new trades from your CommSec account.

The Navexa portfolio tracker serves self-directed investors in two key ways.

First, by calculating, tracking and displaying your true, annualized returns for the entire duration of your portfolio.

Second, as an impartial platform focused not on trading but on analytics and reporting, Navexa provides a range of tools to help you better understand and interpret your portfolio performance.

These include portfolio contributions and diversification reports and charts, extensive dividend recording and reporting tools, and taxable income reports for both capital gains, investment income and calculating unrealised gains tax obligations.

But to provide you with accurate and up-to-date portfolio tracking and analytics, you need to make sure your Navexa account contains complete and accurate historical trade data, and accurate data on any new buy or sell trades you make.

We solved the second part of that problem with Navexa Link, our tool for automatically forwarding contract notes to your Navexa account in order to effortlessly add your latest trades.

We also created a way for you to add historical trades by uploading .csv or .tsv file (go here for a simple guide to our Portfolio File Uploader).

If you trade with CommSec, there’s now an even better way to add your historical data from your trading account.

How To Easily Import Your Historical Trades From Your Commsec Account Into Navexa

In the portfolio page of your Navexa account, if you click on the dropdown menu next to ‘Add Holding’, you’ll see the option to ‘Import From Broker’.

Import From Broker

Click that link and you’ll go through to a list of brokers. Click CommSec.

CommSec

You’ll see a CommSec account screenshot and a list as follows.

CommSec

Follow the instructions in the list:

Step 1: Go to the ‘Portfolio’ tab.

Step 2: Then go to the ‘Accounts’ sub tab.

Step 3: Then go to the ‘Transactions’ sub tab.

Step 4: Set the date range to the maximum range you want to import and click the ‘Search’ button.

Step 5: Click the ‘Download’ button and select ‘CSV’.

Once you’ve downloaded the file from your CommSec account, hit ‘Choose File’ on this page and select it.

Then, click ‘Upload File’.

Then you’ll come through to this screen:

Broker File Upload

Depending on the size of the CommSec file you’re uploading, it should only take a few minutes for Navexa to add the historical trade data to your account.

You’ll see an email notification when the upload is complete.

Then, you’ll be able to use your Navexa account to browse all your historical trades and holdings!

This is the fastest way to add historical trade data from your CommSec trading account to your Navexa account.

So, what about future trades, after you’ve uploaded everything to date?

How To Automatically Update Your Navexa Account With The Latest Trades From Your Commsec Account

You can manually add each new trade you make to your Navexa account.

But, it takes time.

And, it could impact the accuracy of your portfolio performance calculations if you make any errors when manually adding the trade data.

Our Navexa Link contract notes forwarding tool solves both those problems.

Here’s how it works.

Click ‘Manage Portfolios’ in your account.

Find the portfolio you want to automate your trades for and click ‘Actions’, then select ‘View/Edit’.

Under the heading Navexa Link, you’ll see an email address.

This is your unique forwarding email address for the selected portfolio.

Copy that email address, go to the email account where you receive your contract notes from your broker, and create an email rule that forwards all future contract note emails to this address.

Once you’ve created the automatic forwarding in your email account, you’re good to go.

Just allow five minutes or so for us to set up your account to receive and reflect the new trades you’ll be forwarding.

Then, you’ll see every trade you make automatically displayed in your Navexa account and factored into your portfolio performance.

This will save time and ensure your Navexa portfolio’s accuracy.

We’ve Made It Easy To Integrate Your CommSec & Navexa Accounts

Between our historical trades importing tool for CommSec trading accounts, and our Navexa Link tool for automatically adding new trades to your account, you really only need to complete two tasks when creating your Navexa account.

First, upload your historical trades to bring your Navexa account up to date with your CommSec account.

Then, set up Navexa Link contract forwarding for your portfolio or portfolios.

From there you’ll never have to manually add a trade again.

And if you want to create another portfolio, simple repeat the process for historical trades and contract note forwarding.

It’s all part of our mission to create seamless, simple portfolio tracking for CommSec customers using Navexa.

Categories
Financial Literacy Investing

Dividend Reinvestment Plans: Some of the Key Pros & Cons

Dividends don’t always arrive in the form of cash. Some stocks allow investors to automatically reinvest their dividend payments into additional shares. Here, we take a look at some of the positives and negatives associated with reinvesting investment income instead of receiving dividend payouts as cash.

So, you’re collecting dividend income from your investments.

Great!

Investing in quality dividend-paying stocks can be a brilliant way to boost your returns — see how one of my income investments paid back nearly half my capital in just four years.

There’s more to dividend investing than just getting paid to hold shares, though.

Some stocks don’t simply pay you a cash dividend on a regular basis.

They give you the option to reinvest your dividend income into additional shares.

As you’ll see in our post explaining dividend reinvestment plans (DRPs), this option can have powerful effects on long-term returns.

On a long enough timeline, a DRP could be the difference between making a few hundred thousand dollars on an investments, and a couple of million.

But that doesn’t mean that choosing a DRP for your investment income is always going to be the default best option.

In this post, I’m going to go through three pros and three cons of reinvesting your dividends.

I should point out, though, that this is by no means an exhaustive list.

(Nor does it constitute financial advice.) 

DRP Pros: Compounding Through Increased Exposure & Saving On Brokerage Fees

  • Compounding

I like what Einstein (allegedly) said about compound interest being the eighth wonder of the world.

The true wonder of compounding only becomes apparent with enough time.

As a long-sighted value investor, I try to let time work for me.

By that, I mean I look for quality, undervalued stocks and I buy them with a view to going ‘The Full Buffett’ and holding onto them for decades.

If you’re prepared to be patient and hold an investment for a long time, a DRP might work in your favour.

Why? Because over time, not only will your additional shares compound the size of your overall position, but you’ll receive more shares each time (since dividend amounts relate directly to your position size).

In some cases, with the right companies over a long enough time, you could double the size of your position simply by allowing reinvested dividends to accumulate.

  • Increasing Your Exposure

Another advantage of using the DRP on an investment is that, over time (and again, the more time you allow, the more powerful the effect could be) is that accumulating more shares increases your exposure to the stock.

If you’ve selected a quality company to invest in, and the company’s stock increases in price over time, you will have more shares exposing your portfolio to that capital gain.

In simple terms, if you had 1,000 shares worth $10,000 in a company that rose 100%, you’d have 1,000 shares worth $20,000.

But if you’d reinvested your dividends and that had netted you, say, an extra 200 shares, you’d have 1,200 worth $24,000.

  • Acquiring Extra Shares Without Paying For Them

One of the factors many investors neglect to consider when calculating their TRUE returns is brokerage fees and other transaction costs.

Generally, when you make a trade, you’ll pay your broker a fee to facilitate that trade.

This is another reason why I favour longer term, relatively inactive investing as opposed to buying and selling frequently, trying to chase trends or predict the market.

If I hold a single investment for 20 years, the fact that I paid, say, $100 brokerage becomes virtually irrelevant when I annualize my return.

And if you prefer not to let fees eat into your returns, you might like the DRP option, too.

Some stocks’ DRPs allow you to accumulate the additional shares for zero fees, since you’re not buying through a broker but rather have a direct agreement with the company itself.

So, those are three upsides to DRPs. In my view, investing this way only really delivers a meaningful advantage if you allow enough time for compounding, increased capital exposure, and the benefits of not paying brokerage on your additional shares to accumulate.

Now, let’s take a look at the downsides of DRPs.

DRP Downsides: Opportunity Cost, Less Control, And The Flipside of Increased Exposure

  • You Don’t Control The Price Of Your Additional Shares

Acquiring additional shares through a DRP is great, in principle. Like I said, on a long enough timeline, and provided you’ve invested in a quality company that grows stronger and more profitable, it’s a sound idea to acquire more shares.

But like I also said, I’m a value investor.

I only buy shares in a stock I calculate is trading under its intrinsic value.

If you share that approach to buying stock, you may find that a DRP has an unintended downside; acquiring additional shares at prices above what you’d choose to pay were you analysing the stock with fresh eyes as a new investor.

Not only do you not get to choose the price you pay for each bundle of additional shares, you don’t get to choose the timing of the reinvestment, either.

So, in terms of control and in the spirit of not paying more than you want to, a DRP may be a downside.

  • Opportunity Cost

The essence of the DRP is that you receive shares instead of cash.

As we know, this can have plenty of benefits, especially if you’re investing for the long term and intend to let the power of compounding work its magic over.

However, one potential downside of opting for a DRP over a cash dividend, is that you’ll miss out on opportunities to do things with that investment income other than automatically convert it into additional shares.

In other words, opting to reinvest your dividends could have a negative impact on your portfolio diversification.

Consider early 2021’s cryptocurrency bull market.

Say you’d been reinvesting your dividends in one of your stocks for five years, and you’d turned a $10,000 position into a $20,000 position (between capital gains and the DRP).

Not bad, a 100% gain.

But say you’d taken the cash dividend instead and invested it in Bitcoin, you could have exposed that income to far greater capital gains.

Of course, this is a simplistic example that benefits from hindsight (five years ago and even today, many still wouldn’t recommend cryptocurrency as a sound investment).

The takeaway here is, while a DRP can be a powerful tool in compounding your investment income and position size, it can also cost you the opportunity to invest your dividends in other assets and opportunities.

  • The Flipside Of Increased Capital Exposure

This potential downside is a reflection of the potential positive we mentioned above — increasing your exposure.

Because, of course, if a DRP increases your exposure to a quality stock’s capital gains, it can equally expose your capital to greater losses.

This is something you should always take into account if you’re reinvesting your dividends back into a stock — and of course any time you invest — your capital is always at risk.

While the stock market does generally rise over the long term, that doesn’t mean every stock does.

Everything, in theory, can go to zero.

So if you were invested in a company that collapsed or went bankrupt, that increased exposure through your DRP could result in you losing more money than you might have if you had simply collected your dividends as cash.

Dividend Income: To Take The Cash, Or Reinvest?

Dividend reinvestment can be a valuable tool for the investor.

Of course, like any decision we’re faced with when trying to build wealth in the market, there are pros and cons.

Using a DRP to compound your income and capital can be a powerful way to grow your portfolio.

Compounding, increased capital exposure, and zero or few brokerage fees are in my view key benefits of utilizing a DRP.

On the other hand, increased exposure could bring increased risk, while DRPs may also inhibit you from investing in other opportunities or diversifying your portfolio.

The other key potential downside to DRPs is that you lose control over the timing and price of the additional shares your dividends will earn you.

In my opinion — and bear in mind I am not a professional investor or advisor — it’s important to view a DRP investment in both the wider context of your overall portfolio and financial goals, and — in my opinion — through the lens of long term investing.

I hope this post on the pros and cons of DRPs has been helpful for you.

I’ll leave you with one of my favourite investing quotes, from Warren Buffet’s business partner, Charlie Munger:

“The big money is not in the buying and selling. But in the waiting.”

Categories
Financial Literacy Investing

Ex-Dividend Dates Explained: What, When & Why

What does it mean when a stock goes ‘ex-dividend’? As you’ll see in this brief guide, the ex-dividend date is an important part of the income investing — and, potentially the value investing — process. We explain what it means and why you should understand its impacts when buying stocks for both capital gains and dividend income.

If you’re new to income investing, you may think earning dividends from stocks you own is simple and straightforward.

In principle, it is; You buy shares in a profitable company that pays a portion of its earnings out as cash dividends to investors who’ve traded their capital for shares in the business.

I’ve personally been receiving income from some of my investments for years now.

I’ve seen first-hand how powerful a steady stream of dividends can be for your overall portfolio performance.

But understanding investment income is a little more complex than just buying and holding any stock that pays a dividend.

Here, we explain the finer points of dividend payments.

As you’ll see, the date a company pays out a dividend to shareholders is just one of the key dates you need to be aware of as an investor.

What Does It Mean When A Stock Goes Ex-Dividend?

There are four key dates around dividend payments.

The first is the declaration date. This is the date the company announces it will issue a cash dividend in the future.

Second, you have the record date. That’s the date the company goes through its list of shareholders to confirm those who are eligible to receive the upcoming dividend.

Third is the ex-dividend date.

This is an especially important one, as it determines which shareholders will be considered eligible on the record date.

The ex-dividend date is commonly set two days before the record date.

This means you must own shares in the company on or before that date in order to qualify for the upcoming dividend.

Finally, there’s the dividend payable date, or simply the payment date.

That’s exactly what it sounds like; the day the company pays out the dividend to the shareholders who’ve met the criteria to receive it.

Those are the four key stages of a dividend.

The ex-dividend date is arguably the most important because it’s the cut-off point for determining whether or not you will receive the next scheduled payment for your shares.

Is It Better To Buy A Stock Before Or After The Ex-Dividend Date?

In my opinion — and everything on our blog is opinion, it’s not financial advice — there’s no great advantage to buying before or after the ex-dividend date.

But that’s because I personally prefer to hold any shares I buy for a relatively long time.

If you’re looking for a quick cash gain, you may consider trying to buy shares in a stock right before the ex-dividend date.

On paper, that might not seem like a bad idea.

In reality, the market adjusts the stock price when a company trades ex-dividend. This takes account of the cash payment being made to shareholders.

Generally, the share price adjusts by the amount of the dividend, meaning if you buy right near the ex-dividend date and sell right after the dividend payable date, you could take a small capital loss despite having captured the income.

In other words, trying to dip in and out of a stock to grab the dividend may not work out as profitably as you’d hoped.

Even if that weren’t the case… and you could dip in and out of a stock quick and easy to claim some fast income, you’d still have fees and taxes to contend with, which would eat into your gains (see the full list of factors that impact your true portfolio performance).

Still, there probably are people out there who buy and sell around ex-dividend dates regardless of the downsides. So…

Are Ex-Dividend Dates Value Investing Opportunities?

I personally follow the value investing strategy set out by Benjamin Graham and, later, Warren Buffet.

I prefer to look for high quality companies trading below their true value.

If I find one of those, I’d rather buy shares and hold them for a (very) long time than trade frequently.

So, for me, an ex-dividend date isn’t necessarily an investment opportunity in itself.

But, if I calculate that this is a stock I want to own, I might look to get in before the ex-dividend date.

Having said that, since my investment strategy is a long term one, missing a single dividend payment by buying in after the ex-dividend date wouldn’t bother me one bit.

I’d be looking to hold (that’s stockspeak for ‘hodl’ if you’re joining us from the crypto world) those shares for many years, ideally capturing a long term capital gain plus the income the company pays out over that time.

But, that is just me. Not everyone invests the way I do (learn about my experience buying my first ever shares to see why I invest the way I do).

I hope this post has shed some light on ex-dividend dates, the process they’re part of, and the impacts they can have on both stock prices and investment income.

Categories
Investing

The Big Short (Squeeze): Unpacking The GameStop Saga

A subreddit community takes on the Wall Street elite. The battleground? A struggling brick-and-mortar games retailer. What does the GameStop short squeeze saga reveal about the changing investment landscape… and investing in a market where powerful, internet-driven trends can make seemingly worthless assets explode higher for no real reason?

Make no mistake; The GameStop story runs deeper than a group of investors collaborating on Reddit to push a stock to all-time highs for the sake of it.

ICYMI, GameStop, a video game and consumer electronics company floundering in recent years amid failed investments and the rising dominance of online retail, rocketed from $US17.25 to $US325 in the first month of 2021.

Why?

Because the users of r/wallstreetbets orchestrated a massive ‘short squeeze’ in a bid to push GameStop’s share price up to $1,000.

For some, the mission appears similar to a ‘crypto pump’, where investors band together to drive a tiny, cheap cryptocurrency’s price higher so they can cash out for massive, quick profits.

For others, however, the GameStop short squeeze appears to be about more than getting rich quick.

Because if the internet raiders can continue to push the stock’s price higher, they’ll cause the hedge funds and Wall Street elites trying to ‘short’ GameStop to lose large sums of money.

In other words, this is like the stock market equivalent of the people rising up against the vastly more powerful individuals whose wealth traditionally dominates the stock market and whose influence and power traditionally rakes in the biggest profits — often at the expense of everyday investors.

What Is A Short Squeeze?

To understand what a short squeeze is, you need to know what shorting is.

In simple terms, short selling is when you borrow shares from a broker and sell them for a given price, under an agreement that you will buy those shares back at a given point in the future.

If you borrowed $5,000 worth of shares in a company you thought was going to be trading 50% lower in three months — and your prediction proved correct — you’d be able to buy those shares back for $2,500, return them to your broker and pocket the other $2,500.

That’s the basic idea of short selling.

It’s a way to potentially profit from prices falling instead of rising.

A short squeeze is when upward price movement puts pressure on short sellers whose shorts are nearing expiry.

GameStop is a prime example.

Investors buy up the stock, driving the price higher. This pressures the short sellers to buy too, since they are trying to protect themselves against the losses they’ll incur if the stock doesn’t fall to their target price by the agreed date.

Another way to think of a short squeeze is that it’s a battle between those wanting to profit from higher prices, and those wanting to profit from lower prices.

Veteran Trader: Beware Ego, Bias & Thinking You Can Resist The Trend

Jason McIntosh is the founder of Motion Trader, an algorithmic trading and stock market advisory service.

Jason’s been investing and trading professionally for three decades.

Here, he shares his thoughts on short selling, the GameStop story and a dangerous idea many investors grapple with.

“Short selling is a dangerous game, even for the professionals.”

— Motion Trader’s Jason McIntosh

It’s a situation where there is unlimited downside and limited upside i.e. the most a stock can fall is 100%, but it could rise many times more (as the short sellers of GameStop experienced).

It’s basically the opposite to what investors should be looking for.

I target set-ups where I have “asymmetric” risk/reward. That is, I need the potential of making much more than I’m risking.

While short sellers can get this dynamic, it’s nowhere near as good as when you buy shares.

Before I invest in anything, I ask the question: Could I make a multiple of what I’m risking?

“No matter what your numbers say, all that matters is what the market does.”

— Motion Trader’s Jason McIntosh

Another thing to bear in mind is around following the price action.

I’m sure there was ego involved with the GameStop short sellers.

They did their numbers and they were sure they were right — this probably made resistant to taking an early loss.

But no matter what your numbers say, all that matters is what the market does.

It’s more important to exit and stay in the game, than fight on and risk being wiped out (something many retail investors experience).

“Simple lesson: Don’t fight the trend…”

— Motion Trader’s Jason McIntosh

The final point is that markets can run further than just about anyone can imagine.

This is why investing with the trend and letting winners run is so important.

GameStop, Tesla, Bitcoin, and many others had huge gains amidst widespread disbelief.

Many people have lost large sums of money fighting the trend. Others left big sums on the table by exiting too early.

Simple lesson: Don’t fight the trend and let your profits run.  

Buy The Hype? Or Ignore The Noise?

The conflict between fundamental value and market behaviour has always been a point of contention for investors.

The GameStop story — still unfolding at the time of writing — shows you two things.

First, the power of the market to make investors abandon ideas of fundamental value and pile in on a trend.

GameStop isn’t Tesla. It’s a beat-up traditional retailer that probably would still be trading flat were it not for r/wallstreetbets.

Second, the power of the internet to challenge the financial establishment.

As Jason points out, Bitcoin and GameStop aren’t that different.

One could take the view that they’re junk assets devoid of any meaningful fundamental value.

Or, one could look at the gains and accept that when a trend takes hold and creates events like these, you’re better off being in to win than sitting on the sidelines.

Whichever way you prefer to view it, the reality is that the GameStop short squeeze is going to make (and lose) a lot of people a lot of money.