From your Portfolio screen, you can click through to your individual holdings by clicking their ticker symbol in the holdings list.
Doing so will bring you through to this screen:
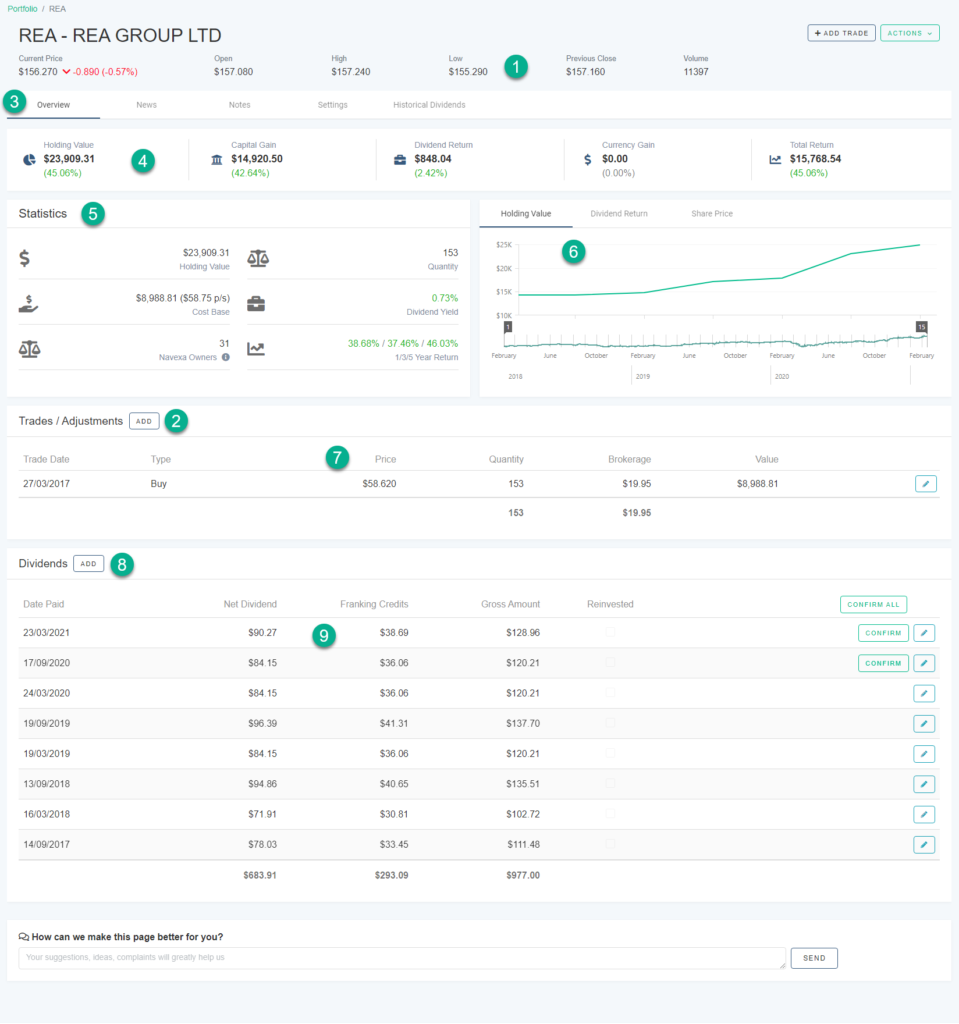
The Holding screen shows you a selection of detailed information about individual stock, ETF, unlisted investment or cryptocurrency you’ve selected.
The date range for this page is always set from the date you bought the holding.
- Asset Snapshot: Along the top of the Holding screen, you’ll see the holding’s current trading price, today’s open price, the high, the low, yesterday’s close and its latest market volume.
- Add Trade & Actions: You can add another trade for the holding by clicking the button next to ‘Trades/Adjustments’ or at the top right of the page. At the top right, you can also select the ‘Actions’ dropdown menu to select either ‘Transfer Holding’ or ‘Delete Holding’.
- Overview & (Much) More: Toggle the information you view on the Holding screen by choosing Overview (which displays the metrics and chart you see above), News (which shows a list of relevant web links for the holding) and Notes (where you can enter and review notes you keep on the holding), Settings (set whether the holding is part of a trust, and control your dividend reinvestment tracking settings) and Historical Dividends (a bar chart and table showing every dividend you’ve received since you owned the holding).
- Holding Performance Snapshot: These performance metrics are the same as those on the Portfolio page, except for the selected individual holding instead. From left to right: Holding Value, Capital Gain, Dividend Return, Currency Gain, Total Return.
- Statistics: Here, you can see useful statistics about your holding, including your Cost Base, Quantity, 1/3/5 Year Return and the number of Navexa Portfolio Tracker users who hold this asset.
- Holding Performance Chart: The chart displays the performance of the holding in dollar terms, or shows you the dividend return or share price depending which view you choose using the buttons above the chart.
- Trades: This table displays all the trades you’ve made for this holding (you can see the Type, Price, Quantity, Brokerage and Value). Use the button at the top left to add another. Use the edit buttons to the right of each trade to edit that trade if you need to.
- Add Dividend: Use this button to manually add a dividend to for the selected holding.
- Dividend Table: View and edit your dividends. View Date Paid, Net Dividend, Franking Credits and Gross amount, and use the check boxes, ‘Confirm’ buttons and edit buttons to change and update individual dividend records.