Categories
Financial Literacy Tax & Compliance

How To Calculate And Report Your Capital Gains In 2022

Your guide to calculating capital gains tax in Australia in 2022. From tax rates, CGT events, taxable income and more. Plus, discover four key tax reporting strategies investors use to adjust and optimize their total taxable capital gain.

Paying tax is a part of investing. It has long been a fact of life that a significant portion of our earnings will always be earmarked for payment to the state. This includes capital gains.

Tax is applied to a wide range of earnings including wages, salaries, and investment income from property, shares, and cryptocurrency.

In Australia, the tax rate that is applied to your investment income is known as the Capital Gains Tax, or CGT.

Whether you’re a seasoned investor or just starting out, it’s important to be aware of how CGT works. This article will explain how the CGT works, and how to calculate and report your capital gains in Australia in 2022.

While you can’t avoid paying CGT on your investment income, there are some strategies you should be aware of for minimizing the impact of tax on your capital gains. This blog post examines some of these strategies and provides examples of how they might look.

The Australian tax year, or financial year, runs from July 1 to June 30. This is the period for which you will need to submit your tax assessment based on any income you received during the financial year. This period is known as ‘tax season’.

How Does CGT Work?

The Australian Tax Office (ATO) requires individuals to declare investment activity in their tax return and pay tax on all investment earnings, including capital gains and dividend income. 

If you buy shares, invest in property, or hold other investments which you sell at a higher price than what you bought them for, you will have made a capital gain. This means you will be paying CGT.

CGT is the tax rate that is applied to net capital gains (total gains minus total losses). It is not a set rate, but is calculated according to your marginal tax rate. This is the tax rate that you usually pay on your personal income, and will be the tax rate applied to your investment earnings.

Australian tax rates

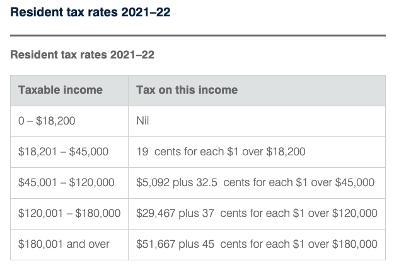
Capital gains are taxed at an individual’s marginal tax rate

While CGT rates for individuals vary according to their marginal tax rate, flat rates apply for companies and self-managed funds. 

Trading companies pay 26% if their annual turnover is less than $50 million, and if it exceeds $50 million, the CGT applied is 30%. Investment companies don’t qualify for the 26% rate and are taxed at 30%. Self-managed super funds are taxed at a lower rate of 15%. 

If you sold any assets during a financial year, you will need to work out your capital gain or capital loss for each asset. CGT will need to be paid on your net capital gains. 

To calculate your capital gains, you first need to know the ‘cost base’ or original purchase price of the asset. From there, you can work out how much profit you’ve made by subtracting the selling price from the cost base. 

Depending on how long you’ve held the shares for, you may or may not qualify for Australia’s 50% CGT discount on investments held longer than 12 months. 

The Navexa platform provides an automated solution for making these calculations — more on that later.

That’s how the CGT rate is determined. So, let’s take a closer look at which investments the CGT applies to.

What Does CGT Apply To In Australia?

CGT applies to a wide range of investment income in Australia, including earnings generated from real estate, shares, cryptocurrency, foreign exchange, and collectibles.

When you dispose of an asset for more than what you paid for it, you realize a capital gain which you will have to pay CGT on.

There are a range of other situations that will trigger the requirement to pay CGT. These are known as ‘CGT Events’. A CGT event occurs when an investor makes a capital gain or incur a capital loss on an asset. 

Here’s a comprehensive list of what constitutes a CGT Event.

The Australian Tax Office (ATO) imposes CGT when you make a capital gain or loss

How Does CGT Apply To Shares?

When you sell shares for more than what you paid for them and realize a capital gain, you will have to pay CGT. When other CGT events occur, you will also have to pay CGT on your shares. Examples include switching shares in a managed fund between funds, or owning shares in a company that is subject to a takeover or merger.

It is important to keep good records of all your share transactions, including amounts and dates of purchase. When you file your tax return, CGT will need to be calculated for any profits you made from selling your shares. 

Does CGT Apply To Dividend Pay-outs?

Many Australian investors enjoy investing in companies that pay out dividends (a percentage share of their profits) to their shareholders. But, like other forms of income, dividends are subject to taxation.

Dividends are paid from profits that have already been subjected to Australian company tax. Because the profits have already been taxed, shareholders won’t be taxed again when they receive the profits as dividends, provided that their marginal tax rate is lower than the tax rate paid by the company.

These dividends are described as being ‘franked’. A ‘franking credit’ is attached to the dividend and represents the tax that has already been paid by the company distributing the dividend. The shareholder who receives the dividend with an attached franking credit will either pay less than their usual tax rate, or receive a tax refund.

The general rule is that if your marginal tax rate is lower than the rate of tax paid by a company or fund, you might be entitled to claim a refund. However, if your marginal tax rate is higher than the tax already paid on the dividend, you may have to pay additional tax.

Does CGT Apply To Crypto?

If you were hoping to avoid paying CGT by investing in cryptocurrency, we have bad news for you. Cryptocurrency investment in Australia is also subject to taxation, in a similar way to other investment assets.

In recent years, the cryptocurrency market has grown rapidly, and the ATO has been quick to catch up. 

Bitcoin and other virtual currencies are taxed as property in Australia
Crypto gains are subject to CGT in Australia.

Cryptocurrency markets have exploded in recent years and the ATO is all over it

As with other assets, CGT may apply in circumstances other than just selling your crypto. The ATO classifies four main CGT events for crypto activity:

You’ll be taxed when you:

  1. Sell crypto.
  2. Exchange one crypto for another.
  3. Convert crypto to a fiat currency like AUD.
  4. Pay for goods or services in crypto.

Just like when you pay CGT at your marginal tax rate when you sell shares, you pay this rate when you sell crypto.

Generally, you could apply the same tax rules to your crypto portfolio as you would for investment in stocks.

Remember, the ATO knows about your cryptocurrency.

What About CGT And Property?

You must pay CGT when you realize a capital gain from property. This could include selling an investment property for more than what you paid for it or selling a block of land that you created through a subdivision process.

Your main residence is generally excluded from CGT if you meet certain criteria specified by the ATO:

  • You will need to have lived in the home for the whole period that you have owned it.
  • The home can’t have been used to produce income or have been bought with the intention of renovating and selling it for a profit.
  • It must be on land no greater than two hectares.

If you meet the criteria, you may be able to avoid paying CGT when you sell your house. If not, you may still qualify for a partial exemption. The ATO provides a property exemption tool on their website to help you make the calculations.

In Australia, investors can expect to pay CGT on shares, crypto, property and more.

Capital Gains Tax (CGT) has to be paid on investment income from property

If you acquired property on or prior to 20 September 1985, CGT does not apply. But it will apply to certain capital improvements made after this date. It is also important to keep track of any rental income you receive from property and include it in your tax return. For more details on CGT and property, visit the ATO.

If You Are An Investor, It Pays To Know About CGT

As you can see, CGT applies to a wide range of investment income. When you prepare your tax return, you will need to provide the ATO with your assessable income and any capital gains or capital losses you made that year. 

While this article isn’t financial advice, we do advise you to be well informed. The above is not an exhaustive list of what CGT applies to in Australia, so you should check with the ATO if you are unsure about what your tax obligations are.

You can’t escape having to file a tax return, but fortunately there are a few strategies you can use to reduce your tax burden, legally. 

Let’s explore some of the strategies that investors use to minimize investment tax.

Effective Strategies To Minimize Tax Payments

There are several legal investment strategies investors employ to minimize tax bills and claim tax deduction. This goes for both gains and income.

Below you’ll find some of the ways Australian investors hold on to as much of their investment gains and income as possible.

The following is not investment advice. As with all the information on the Navexa blog, it’s general investment information our writers have collated from other sources. For any financial or investment decisions, you should always understand the risks, and seek professional advice if necessary.

Strategy 1: Hold Onto Your Investments For Longer Than 12 Months

Australian tax law makes a distinction between short and long term capital gains. A long term capital gain is when you make a profit on an investment that you’ve held for longer than 12 months. It’s a short term capital gain if you’ve held the asset for shorter than 12 months.

As an investor, this is important to understand because of something known as the ‘CGT discount’.

If you’ve held an asset for longer than 12 months before a given ‘CGT event’ occurs, you may be able to claim a CGT discount of 50%. Remember, a ‘CGT event’ is the point at which you make a capital gain or loss on an asset.

Let’s say you made $30,000 profit from investments that you’d held for less than 12 months, and your marginal tax rate was 37%. You’d have a $11,100 tax liability.

However, if you’d held the asset for longer than 12 months before you sold, the CGT discount would mean your tax liability was just $5,500! That’s a significant amount saved on your tax bill.

Capital Gains Tax discount applies to a wide range of investment income, including shares, property, and cryptocurrency.

As you can see, holding onto your investments for longer than 12 months to take advantage of this discount can be much more tax effective than disposing of them quickly. 

Remember, you must be an Australian resident for tax purposes to take advantage of the CGT discount. There are also some other situations where the CGT discount does not apply. 

For example, the discount is not available if the asset is your home and you started using it as a rental property or business less than 12 months before disposing of it.

A CGT discount of 50% is available to Australian trusts, and complying super funds can receive a discount of 33.33%. However, companies can not take advantage of the CGT discount.

When you file your tax return, you must subtract any capital losses that you may have from your capital gains before applying the CGT discount. In most cases you will be eligible for the discount if the asset has been held for longer than 12 months.

Navexa provides a platform where you can easily track your portfolio performance and calculate both your taxable capital gains and taxable income. Our CGT Reporting Tool gives a detailed breakdown of which assets are ‘non-discountable’ from a CGT perspective (those which have been held for less than the required 12 months to qualify), reducing the amount of tedious leg-work at tax time.

Navexa’s tax reporting tools remove the need to manually calculate your portfolio’s tax obligations and show you the most tax effective way to prepare a tax return.

Provided the portfolio data in your account is correct and up-to-date, you can run an automated tax report in just a few seconds.

Capital gains tax summary
Navexa’s CGT Reporting Tool.

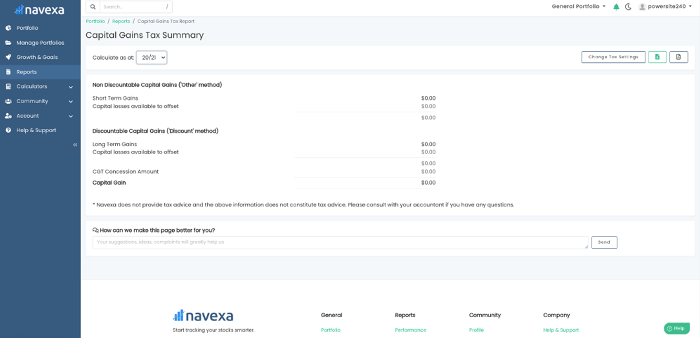
What you see above is Navexa’s CGT Report.

Navexa calculates your taxable gains and displays a detailed breakdown. Capital gains are displayed according to Short or Long Term status alongside your Capital Losses Available to Offset. The report also calculates your CGT Concession Amount and finally, your total Capital Gain.

Navexa’s CGT Reporting Tool makes it easy to categorize your investments for your tax return.

Find out more about how Navexa can help you manage your tax obligations.

Strategy 2: Offset Your Capital Gains With Capital Losses

Another useful strategy at tax time is using capital losses to offset your capital gains. While it would be nice if your assets always made gains and never losses, most of us who invest know that this isn’t the case. Thankfully, the silver lining here is that your capital losses can be used to reduce the tax you pay on your capital gains.

You will have made a capital loss when you sell an asset for less than what you paid for it. This loss can be deducted from capital gains that you made from other sources, to reduce the tax you pay. If you don’t have any capital gains to deduct from, the capital loss can generally be carried forward to future financial years. If you make capital gains in future years, the capital losses are still up your sleeve to deduct from any gains and reduce tax. 

While there is no time limit on how long you can carry the losses forward if you don’t make any gains, the ATO does require that capital losses are used at the first available opportunity. This means when you have a capital gain to declare and capital losses available to offset, you must do so. They also require the earliest losses to be used first.

For example, if an investor owed $5,000 in CGT for their investments in a financial year, but had declared losses of $1,500 the previous financial year, they could carry these losses over to offset their capital gain, resulting in a reduced tax bill of $3,500.

There are some capital losses that can’t be deducted, so be aware of these. These include personal use assets such as boats or furniture, or collectables below a certain value. The ATO also won’t allow capital losses to be deducted from collectables unless they are deducted from capital gains from collectables.

Capital losses can also be deducted from your cryptocurrency assets, too. Let’s say you bought $5,000 worth of Ethereum because it had been surging in price and you were experiencing crypto-FOMO. You buy near the peak and in subsequent weeks the price crashes heavily, after a large nation announces that it won’t endorse cryptocurrency in their economy. Despite this disappointment, don’t forget that if you sell the asset and realize a capital loss, it could be a handy tool to offset other capital gains in your portfolio.

Despite a few exclusions, however, most capital losses from your investments can be deducted from capital gains you have made from other assets. If you are unsure about whether you can deduct a particular capital loss, check with the ATO.

Strategy 3: Invest In Companies That Pay High Dividends And Franking Credits

We’ve already looked at how the ATO taxes dividends, so what does this mean for minimizing your income tax obligations? Again, this is not financial advice.

Remember that companies must pay the Australian Companies Tax on their profits. If an investor receiving a dividend has a tax rate greater than the company tax rate that has already been applied to the company’s profits, they will receive a franking credit.

Let’s look at an example. Say an investor with a 32.5% tax rate receives a $1,750 dividend with a $750 franking credit attached. The franking credit takes the taxable income to $2,500, with gross tax of $812.50 payable. The franking credit rebate of $750 is deducted from the gross tax and the investor is left to pay a reduced tax amount of $62.50, leaving them with $1,687.50 after tax income. As you can see, the impact of the franking credit rebate is significant. For a full breakdown of this and other franked dividend scenarios, click here.

The investor in the above situation manages to retain most of their dividend income. Because the franking credit offsets their CGT so significantly, the amount of tax the individual pays is greatly minimized. Obviously, if your marginal tax rate is lower than 32.5% you will pay less tax and receive a larger chunk of the dividend. If you’re in a higher tax bracket than this, you will receive less. 

Regardless of your marginal tax rate, franked dividends are a useful tool to reduce your tax obligations. Choosing to invest in companies that pay dividends, especially fully or highly franked dividends, is a popular strategy for minimizing tax paid on investment returns.

Navexa’s Taxable Income Reporting Tool

Navexa can help you accelerate the process of determining your taxable income. When you automate your portfolio tracking in Navexa, the Taxable Investment Income Report provides you with everything you need to know to prepare your tax return.

Income tax report Navexa
Navexa’s Taxable Investment Income Tool.

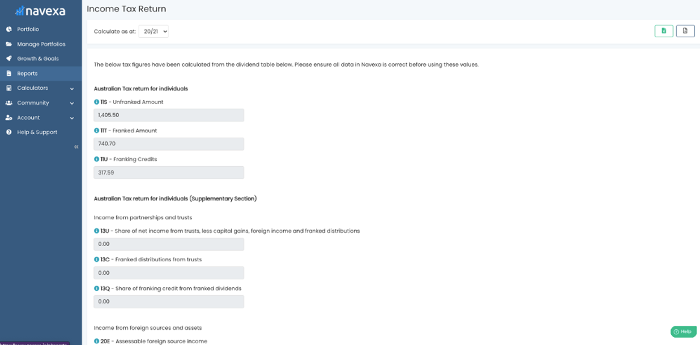
As you can see above, the Taxable Income Tool displays the Unfranked Amount and the Franked Amount for your dividends, as well as the total franking credits attached to them.

And in the below image, you can see the additional fields in the ‘Supplementary’ section. These display further tax-relevant information such as the amount of Franked Distributions From Trusts, the amount of Assessable Foreign Source Income, and your Foreign Income Tax Offset.

The report automatically categorizes sources and tax return codes.

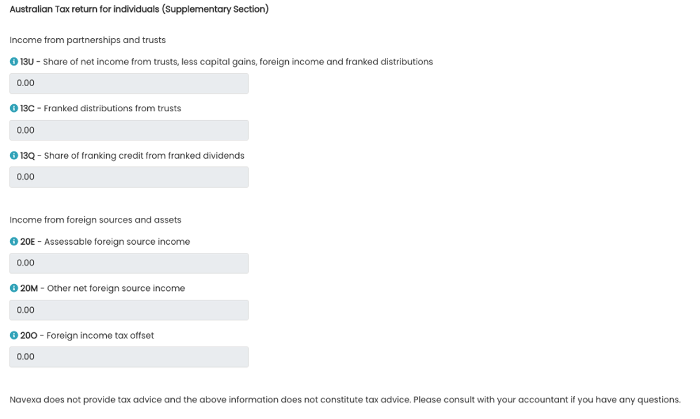
A foreign income tax offset is when you may have already paid tax on something in another country. This might be employment income or capital gains. In some instances, you may be able to claim a foreign tax offset as part of your tax return. Navexa’s Taxable Investment Income Tool will calculate and display these details for you.

Below these fields, you’ll be provided with a holding by holding breakdown of your taxable investment income, like this:

income tax report Navexa
Navexa’s holding by holding investment income breakdown.

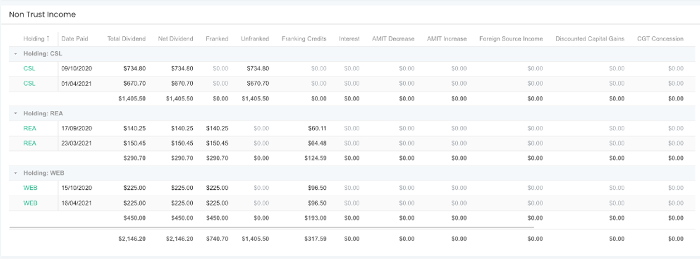
This shows you subtotals for payments from each holding, with grand totals for each column at the bottom. Assets are organized by the dates at which you acquired them, which has important tax implications.

At the top right of the report, you’ll find buttons for exporting the report as both an XLS and a PDF file.

This helps you accelerate the process of preparing your investment income for assessment.

Let’s take a look now at how different investors might choose to dispose of their assets.

Different Tax Strategies For Disposing Of Investments

When the time comes that you want to sell, it can be easy to get excited about the potential gains you are about to realize. This excitement can be dampened, however, when you are faced with the reality of your tax bill.

Choosing a particular method to dispose of your assets can have a major impact on the profits you generate and the tax you pay on them.

Please remember that this does not constitute financial advice. Our writers have collated a wide range of information relating to investment tax that we think is useful for you to consider. As always, we recommend you do your own research before making any investment decisions — tax or otherwise

Strategy 1: First-In-First-Out (FIFO)

The first-in-first-out (FIFO) approach is a common method used by investors when they sell holdings. When you purchase a group of shares at a given price, they will constitute a ‘parcel’.

You may acquire shares in the same company in several different transactions over a period of time. Each transaction forms its own parcel of shares.

The concept of FIFO relates to the disposal of investments. When you are ready to sell shares, you can choose which parcels — sometimes called ‘lots’ — of shares you would like to sell. 

Using the FIFO method, you would sell the parcels that have been held for the longest period. Provided that the share price has risen since the time of purchase, the FIFO method will ensure the greatest capital gain from the sale of a parcel of shares. Obviously, this won’t always be the case, and adopting a FIFO approach might not result in the greatest capital gain.

For example, if an investor purchased 100 shares in a company at $20 per share three years ago, and another 100 shares at $40 two years ago, they might choose to use the FIFO method when they choose to sell some of those shares.

Let’s say the company’s share price has now risen to $50. The investor sells using the FIFO method, disposing of the first 100 shares that were purchased at $20. Because the share price has grown $30 since they purchased them, they realize a gross profit of $3,000. However, if they had chosen to sell the more newly acquired shares parcel, they would only realize a gross profit of $1,000. 

As mentioned, FIFO will only result in the largest capital gain if the share price has risen consistently over time. If share prices have dropped since you bought them, the FIFO approach might not result in the greatest capital gain — but it could lower your tax burden.

Strategy 2: Last-In-First-Out

In the above example, the investor opted to sell their more recently acquired shares because they wanted to maximise their capital gains. Because the share price rose over time, the FIFO approach achieved this goal.

LIFO works in the opposite manner to FIFO — your newest shares are sold first. The LIFO method ‘typically results in the lowest tax burden when stock prices have increased, because your newer shares had a higher cost and therefore, your taxable gains are less’.

If we continue to assume a consistent growth in share price, LIFO would be a useful strategy to dispose of assets and realize less capital gain from the disposal — and subsequently pay less tax.

However, don’t forget that you can only qualify for the CGT discount if you’ve held shares for longer than 12 months.

Investors have four main ways to calculate their portfolio’s capital gains.

FIFO and LIFO are based on shares being organized by time

The FIFO and LIFO approaches above assume that share prices have risen over time. When the opposite is the case, a smaller capital gain may be realized by selling the newly acquired shares or vice versa. The degree to which FIFO or LIFO suits your goals will depend on how the share price has behaved since you acquired the asset.

Some investors might opt for a more precise method of disposal such as maximum or minimum gain, to ensure that they dispose of the parcels which will return the greatest capital gain or result in the lowest tax burden.

Strategy 3: Maximum Gain

The FIFO and LIFO methods are based on selling assets based on the time at which you acquired them. One alternative approach is maximum gain, which is focused on the price at which shares were bought, rather than the time they were bought.

The suitability of FIFO or LIFO will depend on what has happened with the share price since you bought, and what your goal is. Maximum gain focuses on disposing of the assets that were acquired for the lowest price, rather than those which were acquired first or last. This approach is suitable for those looking to ensure maximum capital gains when they sell.

An example of the maximum gain approach: A prospective home buyer has found their dream home and needs to prove to their bank that they can service a large mortgage. They carefully select the shares that were bought at the lowest price in their portfolio to sell, so they can realize the maximum possible capital gain from the sale. While they will pay the most tax using this method, the capital gain will be the largest, and this will help paint a healthy financial picture to the bank.

But, you may want to minimize your CGT obligations.

Strategy 4: Minimum Gain

The minimum gain approach works in the opposite way to maximum gain — you select the parcels of shares in your portfolio that you acquired for the most expensive price and sell these first. By choosing to sell the tax lots with the highest cost base, you will minimize your gain. 

This strategy is generally used by investors who want to minimize their CGT obligations. As we know, less capital gain = less tax paid.

Minimum and Maximum gain, as well as FIFO and LIFO approaches, will suit different investors depending on their requirements.

Regardless of what your aspirations are, and which approach you choose, it is important to make sure that your investment portfolio is kept in good order.

Record keeping is paramount in both portfolio management and personal finance — particularly as it concerns reporting your investment activity to the tax authorities.

Navexa makes this easy.

The above strategies are probably best deployed when you have a clear understanding of your portfolio’s performance. It is important to keep an accurate record of your transaction history, including the dates and prices at which you bought particular shares. This knowledge is vital if you wish to select the most tax-efficient disposal strategy that you can. Or in some instances, simply if you want to maximise your capital gains.

The Navexa Portfolio Tracker automates this entire process, from tracking trades and transactions to optimizing how you report CGT on a portfolio.

Remember, Navexa doesn’t offer tax advice. We always encourage you to consult your accountant or seek other professional advice when it comes to investments and taxes.

the Navexa portfolio tracker
The Navexa portfolio tracker’s portfolio overview.

Automate Your Portfolio Tax Reporting & Optimization With Navexa

Navexa is a platform for tracking your investment portfolio and displaying detailed information that will help you better understand your performance — and better handle investment tax reporting. 

When it is time to prepare your tax return, you should have a clear vision of what you want to achieve. Whether you are looking to maximise your capital gains or minimize the impact of CGT, Navexa makes the process fast and stress-free.

Our CGT and the Taxable Income tools can help you determine your obligations and options when it is time to file your tax return.

Join thousands of Australian investors already using Navexa to manage their investment portfolios.

With Navexa you can:

  • Track your stocks and crypto investments together in one account.
  • Automatically track capital gains, portfolio income, currency gains and losses and trading fees.
  • Benchmark your long-term portfolio performance against any index you choose.
  • Automatically track your dividend and distribution income from stocks, ETFs, LICs and Mutual/Managed Funds
  • Use the Dividend Reinvestment Plan (DRPs/DRIPs) feature to track the impact of DRP transactions on your performance (and tax)
  • See the complete picture of your investment performance, including the impact of brokerage fees, dividends, and capital gains with Navexa’s annualized performance calculation methodology
  • Run powerful tax reports to calculate your dividend income with the Taxable Income Report
  • Calculate your CGT obligations with our Australian Capital Gains Tax Report and the Unrealised Capital Gains Tax Report

Sign up for a FREE Navexa account and get started tracking your investment performance (and tax) today.

Categories
Financial Literacy Investing

The Rule of 72: What Is It, and How You Can Use It In Your Investing?

Using the Rule of 72 is a simple method for getting an approximate idea of how long it takes for your money to double. So how can you use it in tracking your investments?

In a perfect world, investors would like to know, in advance, how long it will take to double their money in the stock market. Knowing exactly how long this will take is helpful in planning out portfolio diversification, and eventually achieving financial freedom.

But, how does one go about working out how long it might take to double the value of a portfolio?. Investors can easily become confused. Especially when it comes to accounts that receive annual interest. Then, they may reach for complex formulae, and spreadsheets. 

But, there’s a simpler, better way of calculating the period it will take to double one’s investment.

One of the best ways is to use the Rule of 72 — one of the simplest methods of calculating when one’s portfolio will double in value.

What is the Rule of 72?

The Rule of 72 refers to the mathematical concept that shows how long it will take an investment to double in value (in theory). It’s a simple formula that anyone can use to determine the approximate time when an investment will double at a given annualized rate of return.

However, the Rule of 72 only works for calculating compounding growth. Investors can use the Rule of 72 only for an account that earns compound interest, not simple interest. Additionally, the Rule of 72 works better with an interest rate ranging from 6% to 10%.

Besides being used to show exponential growth of a portfolio, the Rule of 72 is also used to show exponential decay. For example, the loss of purchasing power caused by inflation, or the drop in the population numbers.

Compound Growth vs. Simple Growth

Interest helps the portfolio growth, and allocating a certain amount of money to an account that earns interest is a smart move investors make. There are two types of growth, or interest — simple and compound, and these are crucial for using the Rule of 72.

Compound interest is added to the already existing interest, plus the principal amount of the loan or deposit.

This type of interest is calculated with the following formula:

A = P (1 + r) (n)

On the other hand, simple interest is added only to the original investment. The formula for simple interest is:

A = P (1 + Rt)

Compound interest is better, as it can reduce the time required to double the money in an account, and grows the investments exponentially.

In other words, compounding interest grows an investment more and more every year, since the interest gets calculated on progressively larger amounts. Whereas simple interest doesn’t compound on itself over time. 

Origins of the Rule of 72

While it may sound surprising, the Rule of 72, and the concept of interest aren’t new ideas. Even ancient civilizations, such as the Mesopotamian, Greek, and Roman, used them in transactions, and basic money management.

While it may not have been called the Rule of 72, it was always around. For example, lenders always wanted to know how to manage their investments, and the rate of return.

Who Came up With the Rule of 72?

The first person to ever take note of the Rule of 72 was Luca Pacioli. Pacioli was an Italian mathematician. He mentioned the Rule of 72 in his book Summa de Arithmetica, Geometria, Proportioni et Proportionalita (Summary of Arithmetic, Geometry, Proportions, and Proportionality), published in 1494.

Pacioli stated that people who wish to know how many years it will take to double their investment should always ‘keep the number 72 in mind.’

Pacioli never went deeper into defining or explaining the reasoning behind 72.

With that in mind, it could have happened that someone else invented the number to improve their calculation of the interest rate, and portfolio growth. Some even say that Albert Einstein was the one to invent the Rule of 72, but that was never confirmed.

Why Is It Called the Rule of 72?

There’s no specific reason this rule is called the Rule of 72. Still, it serves to replace the complex logarithmic calculation that most investors are having trouble dealing with. The exact formula for determining how many years it takes to double your money based on compounding interest, or growth, is:

ln(2) / ln(1 + (interest rate/100))

where “In” represents the natural log value.

Good mathematicians could use this formula to get accurate results by observing return rates, and natural logs. The actual number that’s derived from the formula is 69.3. However, since this number is not easy to work with, people usually replace it with 72, since it’s equally good in showing the approximate number of years necessary to double the investment.

Navexa’s portfolio tracker is even easier to use. Our portfolio tracker automatically calculates every aspect of portfolio performance for shares, cryptocurrency, cash accounts and more. 

How to Use the Formula?

To calculate how long it would take for the investment to double in value, one can use the following formula:

Years to double = 72 / expected rate of return

This method can also be used to calculate the expected rate of return.

Investors should divide 72 with the years to double to get the rate of return on their investment (expected rate of return = 72 / years to double).

This principle handles fractions, or portions of the year. Plus, the resulting rate of return includes compounding interest on the investment.

However, there are a few things to pay attention to:

  • the interest rate should not be a decimal
  • this formula should be applied to an investment that receives annual interest (compounding)
  • the farther the interest rates are from 8%, the less accurate the results would be
  • to calculate lower interest rates, one can drop the number to 71
  • this formula is easily divisible, but not perfectly accurate

Rule of 72 — Variations

Since this principle provides an approximate result, sometimes investors use slight variations, like the Rule of 69, Rule of 70, or Rule of 73.

These numbers are used in the same way, and serve to calculate the years required for the investment to double in value.

Rule of 72 — Examples

Here’s a simple example of using the method to calculate how long it takes for the investment to double:

Let’s say an account earns 4% of annual interest.

dividing 72 by 4 would give the years it takes for the money to double – 18.

When used to show inflation, and other deprecating numbers, the formula is the same.

However, the final result will show the years it will take for the amount to be cut in half.

Since this principle provides an approximate result, sometimes investors use slight variations, like the Rule of 69, Rule of 70, or Rule of 73.

Both novice, and experienced investors could use the Rule of 72 to estimate the doubling time of their holdings. Since the Rule of 72 is easy to use, almost anyone can estimate how long it will take for a certain number to double in value.

Who Uses The Rule of 72?

Since this rule can be used outside of personal finance and investing, it’s also used by other experts who need to estimate how many years it will take for a value to double.

What Is the Rule of 72 Good For?

The Rule of 72 is a good method that can be applied to anything that grows (or decays) exponentially. For example:

  • GDP
  • Inflation
  • Investment compounding interest rate
  • Credit card debt
  • House mortgage
  • Car loan refinancing

How Does the Rule of 72 Work?

By using the Rule of 72, investors can get an approximation of the years it will take for their assets to double in value.

This makes the Rule of 72 one of the key personal finance formulae to understand for investingt. Plus, this rule gives a general idea of how many “doubles” an investor might get during their lifetime, or for a certain period.

Does It Show Accurate Results?

When it comes to the accuracy of this rule, the Rule of 72 provides approximate information about the desired time period.

This formula is a simplification of the more complex logarithmic equation. Investors who wish to get an accurate result would have to do the entire calculation, or use an electronic spreadsheet calculator.

Navexa’s smart portfolio tracker replaces the spreadsheet. It automatically shows portfolio growth, and helps investors get a clear insight into the years it takes to grow their wealth.

What Are the Things the Rule of 72 Can Determine?

As we previously mentioned, this rule is usually used to determine the rate of return on the investment. However, experts in various industries can also apply this principle to anything that is compounding, and this doesn’t necessarily involve money.

For example, a city’s population that grows/decreases by a certain percentage per year can also use the rule to check how long it would take for the population to double, or halve.

Limitations of This Principle

Besides not being completely accurate in showing data, this formula is also mainly applied to compounding interest accounts, not simple interest ones. What’s more, the Rule of 72 works better for lower interest rates, and is less precise as the interest rate increases.

Additionally, this calculation can’t be used to forecast how long it might take to get a double return with decentralized finance and cryptocurrency, due to high market volatility, and sudden changes in prices.

In fact, no calculation can give anyone a 100% accurate prediction of what their investments may or may not do in the future. 

Speculating Future Returns With The Rule Of 72

When people invest, they often want to know how long it will take to double their money. However, predicting the exact number of years can be tricky. 

This is why the Rule of 72 exists. When used correctly, with an investment that involves compound interest,this formula is generally fairly accurate — provided, of course, the annualized rate of return remains consistent.

here are certain limitations investors should be aware of. This mathematical concept works only with accounts that receive compounding annual interest at lower rates. 

The higher the rates go, the less accurate the results will be. 

This principle doesn’t work with simple interest.

On the other hand, investors can slightly change the number, based on their annual interest rate. For example, some may use 69.3, or 73, depending on the percentage of their rate.

The Navexa portfolio tracker and reporting platform is a fast, accurate way to determine your annualized rate of return across shares, ETFs, cryptos, cash accounts and more. We handle all portfolio performance calculations behind the scenes so you can focus on better understanding your portfolio and returns. 

Categories
Financial Literacy Investing

How to Calculate Cash Dividends: A Complete Guide

Managing a complex portfolio and calculating cash dividends might be challenging. Here’s how it can be done with ease with a few formulas — and with the Navexa portfolio tracker.

Most people who consider investing are familiar with owning stocks. Some are also highly interested in receiving a dividend payout. Those who go deeper into researching an investment, might decide on purchasing stocks of companies because that pay cash dividends.

Dividends might help investors maintain a stable portfolio, remain invested in quality companies, and earn a profit, all while holding shares.

However, novice investors may find dividends confusing — especially when it comes to calculating their dividend yield per share. 

The traditional way to calculate dividend per share is using the company’s income statement and similar reports. But, there are other, easier methods, too.

Dividends Explained

Cash dividends are payments companies make to shareholders from their profits.

A dividend is defined as a distribution of a company’s earnings or stocks to a class of its shareholders. Dividend payouts are determined by the board of directors, and shareholders receive them for as long as they hold the stock.

A dividend is a form of reward to shareholders for investing in the organization and for holding the stock. Dividends may also help a stock’s price remain relatively stable.

Some companies offer dividend payments and prefer to keep the shareholders satisfied. Others decide not to pay dividends, instead reinvesting profits back into the company.

Dividends are paid monthly, quarterly, or annually, depending on the company. They’re paid at a scheduled frequency, so investors always know when they’ll receive the profit from holding shares.

Receiving a dividend based is a great way to increase one’s income, but there’s more to it.

Shareholders also pay attention to other factors, such as dividend yield, rates, retention ratio, and other key numbers.

Dividend Rate vs Dividend Yield

The dividend rate is a percentage that shows how much the company pays in dividends annually, relative to its stock price. The dividend rate can be fixed or adjustable, and it’s expressed as a dollar figure.

The dividend rate is calculated with the following formula:

Dividend rate = dividend per share / current price

On the other hand, the dividend yield is expressed as a percentage, and shows the ratio of a company’s annual dividend payout, compared to its share price.

Shareholders can calculate the dividend yield by using the following formula:

Dividend yield = annual dividends per share / current share price x 100

Navexa helps share investors by calculating dividend performance automatically. Navexa’s app is easy to use, and tracks multiple types of investments. This includes tracking and reporting on cryptocurrency investments.

Dividend Payout Ratio vs. Retention Ratio

The dividend payout ratio shows how much of the company’s earnings after tax are paid to the shareholders. It’s in direct relation to the organization’s net income amount, and it’s used to measure the net income percentage.

It’s calculated by the following formula:

Dividend payout ratio = total dividends / net income

On the other hand, the dividend retention ratio represents the percentage of net income that the company keeps to grow the business, instead of paying it out to the shareholders as dividends.

It’s calculated by the following formula:

Retention ratio = retained earnings / net income attributed to stockowners

Calculating Dividends per Share and Earnings per Share

Dividends per share (DPS) is the number of stated dividends paid by companies for each of the shares outstanding. It represents the number of dividends each shareholder receives based on the shares they own.

DPS is often used to calculate dividend yield, and the formula goes as follows:

DPS = total dividends paid over a period – special dividend payout / shares outstanding

On the other hand, earnings per share (EPS) are useful in calculating how profitable the company is based on measuring the net income for each of the company’s outstanding shares. 

EPS is also an important number used to determine share price.

EPS shows whether investing in a certain company and holding its shares would benefit the shareholders and improve their net income.

For example, if the company reports an EPS that’s below a certain estimate, that might cause its share prices to drop.

The formula for calculating earnings per share goes as follows:

EPS = net income – preferred stock dividends / outstanding shares

Types of Dividends

Four types of dividends include cash, stock, property, and liquidating dividend.

There are several types of dividends that a company may pay to the shareholders. These include:

  • Cash dividend
  • Stock dividend
  • Property dividend
  • Liquidating dividend

Cash dividends are the most common. They represent a simple distribution of funds to incentivize shareholders to hold their shares, improve the shareholders’ equity, and increase confidence in the organization.

What Are Cash Dividends?

Cash dividends represent money a company pays to the shareholders per share they own. The money can come from the organizations’ current earnings or accumulated profit. Cash dividends are paid regularly, usually by quarterly or annual payments.

Once the shareholders receive this dividend, they may have the option to accept the cash payment, or reinvest in additional shares (known as a dividend reinvestment plan) and improve their position in the market.

The willingness of the company to pay cash dividends shows a solid financial strength, and positive performance, although that’s not always the case. Sometimes the companies may keep paying dividends, but still be in a poor financial position and eventually shut down.

This is why potential stock owners must be careful when investing and take everything into consideration before they invest in the organization.

Which Company Can Afford to Pay a Cash Dividend Yield?

Many companies have outstanding earnings, and can afford this form of dividend payout. These are just some of the companies that offer dividend payouts across the ASX, NASDAQ and NYSE:

  • IBM
  • AT&T
  • Johson & Johnson
  • QUALCOMM
  • Fortescue Metals Group
  • BHP
  • Magellan Financial Group

More experienced investors can easily determine which company has a solid income statement, and capital, which helps them invest in profitable shares. On the other hand, novice investors may struggle in finding the dividend shares worth investing in.

Potential stock owners must be careful when investing and take everything into consideration before they invest in the organization.

Still, investing in shares that pay these types of dividends can help both new and experienced investors increase capital.

Additionally, those who wish to invest often check out the company’s trailing 12 months (TTM). 

This is a set of performance data that shows how the organization managed finances in the last year. TTM is beneficial for understanding a company’s growth and potential.

Example of a Cash Dividend Payout

Here’s a simple example of a cash dividend:

One investor owns 100 shares of company X. At the end of a quarter, the company X calculates its financial performance for that quarter. 

The board of directors then reviews the information, and decides on a $0.50 dividend per share for the quarter.

This means that the investor is entitled to $0.50 x 100 shares = $50

How Does a Cash Dividend Work?

When a company earns enough, it may decide to distribute part of its earnings to the shareholders. This part of the earnings is most commonly distributed via cash dividends paid in regular intervals, usually quarterly.

While these dividends are a great way of motivating shareholders to stay with the company, they may cause the stock price to drop. Still, investors love companies that offer dividends, as they know they can count on regular payouts.

Why Does a Cash Dividend Matter?

There are many reasons these dividends are important to shareholders. For example, the cash dividends could signal whether the company has good financial health.

It may show that a company is more effective in using its capital, compared to companies that don’t pay dividends.

Dividend payment per stock also increases the chance of shareholders remaining invested in the stock. This means the company’s stock price may stay more stable.

Are Cash Dividends Better Than Stock Dividends?

When it comes to the cash dividend, shareholders have no other option but to either keep it, or reinvest it and increase the number of shares they own.

Even though these dividends are a more common way of paying shareholders, stock ones are sometimes considered better.

When it comes to the cash dividend, shareholders have no other option but to either keep it, or reinvest it and increase the number of shares they own.

With a stock dividend, they can keep the shares or turn them into cash. Plus, stock dividends aren’t treated as taxable, as they’re usually not turned into income.

The Advantages of Cash Dividends

There are many advantages of the dividend payout for shareholders. One of the main advantages is the steady income. These dividend payouts are regular, so shareholders know when they’ll receive the funds.

Regular payouts are especially beneficial for those who build a large portfolio with a view to living on the income.

Receiving dividend payments can also be a good way of establishing a market hedge. This defends the shareholders from the stock price dropping, which often happens during a bear market.

Furthermore, they know that companies that pay dividend yield may be more careful with their financial decisions, as they want to keep people invested in their shares.

The Disadvantages of Cash Dividends

While these types of dividends are common, and can yield great profit for investors, there are certain financial disadvantages for companies.

One of the major disadvantages to paying the dividend is that the money that’s paid to shareowners can’t be used to further develop the business. In a way, paying the dividend prevents the company from investing in increasing sales and profits. Instead, offering a healthy dividend might sustain or even raise the share price — effectively raising capital for the business. 

When it comes to shareholders, dividend payments mean they’ll have taxable income. However, if an investor has an income that’s too low to make them liable for tax, they may be entitled to a refund from the Australian Taxation Office.

Do Cash Dividends Go on the Balance Sheet?

A balance sheet is a financial statement that involves the company’s stock, other assets, liabilities, and shareholder equity. This sheet is also used to evaluate the business.

Dividends do impact the balance sheet, as they will show a decrease in the company’s dividends payable, and financial balance. The balance will be reduced.

To check the total amount of paid dividends, investors should also use a financial statement. This statement shows how much money is entering and leaving the company.

Why Do Shareholders Prefer Cash Dividends?

According to financial theory, investors don’t care much about whether they’ll receive cash or stock dividends, for as long as they have the same value. However, this approach doesn’t include other complexities, such as taxes, transaction costs, dividend payout, demographic attributes of investors, etc.

On the other hand, the theory states that investors would pay additional expenses for receiving cash dividends, and they may prefer them over stock dividends.

Some shareholders would rather pay the taxes and receive cash for their outstanding shares, than receive additional stocks, simply because of direct financial compensation.

Accounting for the Cash Dividend

These forms of dividends are usually accounted for as a reduction of a company’s retained earnings. After the board of directors allows this type of dividend payout, the company debits the retained earnings account, and creates a liability account called ‘dividends payable’.

By moving funds to a dividends payable account, the company reduces equity, which is instantly shown in the company’s balance sheet even though no money has been paid out yet. This, in turn, increases liability.

Once the payment date comes, the company then reverses the dividend payable with a debit entry, and credits the cash account for the cash outflow.

In that way, these forms of dividends don’t actually affect the company’s income statement. Still, all companies that pay these dividends must report the payments in the cash flow statement.

Calculating Cash Dividend

Calculating the dividend payout for the given year is done by subtracting the retained earnings from the beginning of the year from the end-of-the-year numbers.

Based on the complexity of these types of dividends, potential stockholders may struggle in finding the appropriate information they can use to calculate the dividend payout. In general, companies report their dividends in a statement they send together with their accounting summary to their stock owners.

Some organizations share the date in press releases. However, that’s not always the case.

Those who can’t find this data officially, usually consult the company’s balance sheet, which can be found in the annual reports.

Calculating Cash Dividend From a Balance Sheet and Income Statement

If the dividend payout is not explicitly stated in any public document, potential shareholders can look into two things:

  1. Balance sheet
  2. Income statement

The balance sheet is a record of the organization’s assets and liabilities. This document reveals how much the organization has kept in terms of retained earnings. Retained earnings are all earnings of the company that weren’t paid out as dividends.

The second document, which can be found in the annual report, measures the organization’s financial performance for a certain time period. The income statement shows how much net income a company had during a certain year.

This document helps determine what changes would occur in retained earnings if the organization had decided not to offer a dividend payout for that time period.

Calculating the dividend payout for the given year is done by subtracting the retained earnings from the beginning of the year from the end-of-the-year numbers.

This will give the net change in retained earnings, which should then be subtracted from the net income for the year.

The final number shows the total amount of dividends paid during the stated period.

Cash Dividend Per Share Formula

Those who wish to do their own accounting can easily calculate the earnings they receive from per-share dividend yield. After purchasing a stock that pays dividends per share, the shareholder would usually get quarterly dividend checks.

To find the dividend payment per share, the quarterly dividend payout should be divided by the number of shares.

To get annual numbers, the shareholder can multiply the quarterly dividend yield by four.

However, with Navexa, there’s no need to use complicated formulas to calculate the growth of a portfolio. 

Navexa is a smart portfolio tracker that manages accounting for its users. Our app makes investing simple, as it automatically calculates portfolio changes.

Navexa tracks and records every dividend payment — cash and reinvested — in a portfolio and provides insights into which holdings are earning the most and least in a given period. 

Plus, Navexa can annualize portfolio performance, and automate portfolio income tax reporting.

the Navexa portfolio tracker
The Navexa Portfolio Tracker allows you to track dividends alongside capital gains, trading fees & more.

Final Word On Calculating Cash Dividends

Owning dividend-paying stocks is an attractive proposition and a key part of many investors’ long-term wealth building strategies.

But while earning income from an investing is good, it’s vital that investors keep track of their dividend performance — whether that’s from cash dividends or reinvested dividends. 

This is important not just to understand and analyze how much a portfolio is generating in income (and how much that income contributes to overall performance), but because investment income is taxable.

Tax reporting requirements require that investors provide full details of their investment income.

That’s why we’ve built the Navexa portfolio tracker’s automated taxable income calculator. The tool calculates every last cent worth of income an investor needs to report for a given tax year, including details on franking credits (for Australian investors). 

It’s part of our mission to empower investors to build brighter financial futures with simple, but powerful, automated investment analytics and reporting tools.