Categories
Financial Literacy Investing

Stock Trading Strategies Every Trader Should Know

Trading the stock market is a complex and ever-changing challenge. Here are seven common trading strategies investors use to navigate it.  

Do you consider yourself an investor, or a trader? If you’re the type who prefers to buy and sell shares in the stock market often, instead of holding onto an investment perhaps for several years at a time, you’d probably be considered a stock trader.

You may have heard the terms ‘passive’ and ‘active’ investing.

Passive investing is generally long-term investing. You might research and value a stock, invest in some of its shares, and leave that investment alone for many years to let it appreciate in value.

Active investing is the opposite.

Active investing is the domain of the trader, as opposed to the investor.

Traders don’t look for long-term investments. Rather, they buy and sell stocks with the objective of making a quick profit from short-term price movement.

Some traders may make hundreds or thousands of trades a day, aiming to cycle their capital between positions — often looking to profit from both upward and downward price movement.

In this post, we’re going to introduce some of the essential components of trading strategies, from some of the common terms and ideas to important factors every trader, indeed every investor, should be familiar with.

Then, we’ll cover seven commonly used stock trading strategies traders of many different kinds are using in the stock market today.

trading strategies

Essential Components Of Every Trading Strategy

Trading in the stock market — regardless of which trading strategy you choose — requires a significant amount of knowledge.

Even beginning traders should invest substantial effort into educating themselves on the processes and terminology of the market and the wide variety of assets trading on it.

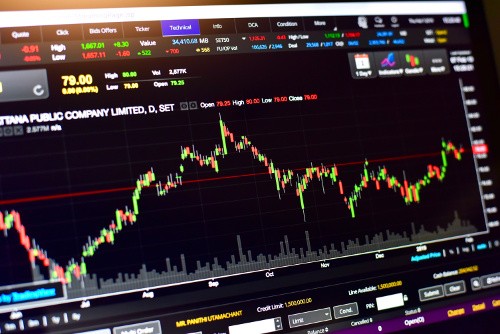
Volume: Volume refers to the amount of shares being bought or sold in a given stock at a given time. Most stock charts will show you the volume relative to the price movement — often with a bar graphic displayed over the price movement line. Volume shows you how much money is changing hands for that asset in the market.

Liquidity: Liquidity relates directly to volume. The more shares are being exchanged in a stock, the easier it should be to find a buyer or seller to trade with. Low liquidity might mean it takes time to execute your trade — which could mean the price shifts while you wait.

Volatility: This is the extent to which the stock’s price moves up and down. If the share price moved between, say, $100 and $105 over a one-month period, you’d say it showed low volatility compared with another that moved between $5 and $50 in the same timeframe.

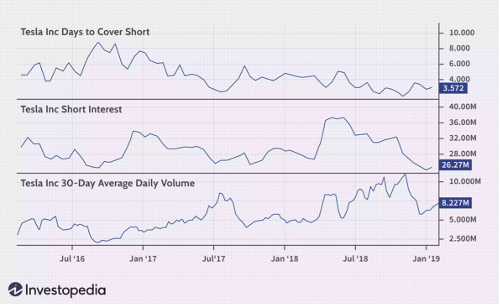
Float & Short Float: When you hear traders talk about the ‘float’, they’re referring to the number of shares available to the public to buy and sell. The float has an effect on a stock’s liquidity. The ‘short float’ refers to the number of available shares that have been borrowed for short selling (this is a key indicator of short interest).

Long and Short: You may have heard the phrase ‘going long’ or ‘going short’. These are stock market terms for betting on a stock rising or falling in price. A ‘long’ position is where you buy shares and aim to sell them at a higher price. A ‘short’ position is where you borrow shares and agree to sell them at a lower price, capturing the difference as profit.

Moving Average: Traders will use the moving average to determine a stock’s trend over a given time frame. Many charting tools will allow you to set and view a moving average line over the price movement. This allows you to ‘zoom out’ and get a different perspective on a stock from price alone.

Stop Loss: Traders and investors alike commonly use stop loss orders to protect their capital. When you enter a trade with your broker, you can set that order to automatically sell you out of part, or all, of your position when the stock falls to a given price. This can save you losing more capital on a losing trade. It can also result in being ‘stopped out’ of a good trade during temporary price drop.

Limit Order: The limit order works similarly to the stop loss order. But in this case, you enter the trade with the condition to buy shares at a certain price. Say you’re keen to buy 100 shares in Stock X, but you don’t want to pay the current price of $20, you can enter a limit order so that if the price comes down to $15 within a given time frame, your broker will try to buy you those 100 shares.

These are just some of the key terms you need to be familiar with when entering the stock market as a trader or investors.

Remember, all investing carries risk and it’s vital to educate yourself, seek advice and be clear about the risks to your capital when you enter the market.

trading strategies

Seven Commonly Used Stock Trading Strategies

Now that we’ve covered some of the basics above, let’s get into the actual trading strategies you can choose from when looking to make money in the stock market.

Day Trading: Fast, High Impact Buying & Selling

You’ve probably heard of day trading. Day trading is exactly what it sounds like — a style of trading where all the buying and selling occurs within a single trading day.

The idea with day trading is to use large amounts of capital — and often ‘leverage’ (money borrowed for trading) — to profit from intraday price movements in stocks.

Day trading depends heavily on technical analysis. In other words, interpreting stock charts to determine the likelihood of small price movements one way or another.

Day trading relies heavily on technical analysis. The day trader tries to predict a short-term price movement, and bet a large amount of capital on that movement with a view to closing out the trade that same day.

For example, a day trader might calculate Stock X is going to increase from $10 to $10.25 that day.

They might put $100,000 of their own money into that trade, plus another $200,000 of leverage (borrowed money from their broker). They’ll probably use a stop loss to protect against critical losses, too.

If that price move does play out, it’s only a 2.5% gain. But with the $300,000 they traded with, that’s a $7,500 profit (minus the leverage fee, of course). 

That’s day trading in a nutshell! Of course, the potential big rewards come with the equal amount of risk.

Day trading is an often-talked about trading strategy which, like all stock trading strategies, carries with it the risk of losing money.

Position Trading: Looking to Profit From Medium-Term Trend Prediction

While day trading hinges on making trades within a single day, and trying to leverage tiny price movements for big profits, position trading is a relatively slower trading strategy.

Position trading, or ‘trend trading’ is similar to day trading in that the position trader will use charts and technical analysis (ADD TA ABOVE!) to determine whether a stock or market is likely to move up or down.

The difference is that position traders don’t worry about trying to predict prices. Instead, they use an array of tools, calculations and indicators — the moving average being a major one — to determine the trend.

Once they’re satisfied that a stock is trending a certain way, they’ll enter a trade with a view to holding that position until the trend changes.

This could mean they hold a stock for weeks or months. It could also mean they exit with a 5% gain or a 50% return. To the position trader, the length of the investment and the price change don’t matter. What matters is the trend.

Whatever they’ve put their money in, the trend trader monitors the investment’s trend. As soon as they see a clear indication the trend is about to change, they exit the position. They’ll also commonly employ stop loss orders to protect their capital.

Generally speaking, position or trend trading becomes is a difficult trading strategy in highly volatile markets, since it’s more difficult to determine medium and long-term trends when prices are rising and falling dramatically.

trading strategies

Swing Trading: Buying & Selling Based On Changes In Market Sentiment

Day trading is by definition a very short-term trading strategy. Position, or trend, trading is a longer term approach.

Between day trading and position trading, sits the swing trading strategy. Swing trading isn’t about trends, nor tiny movements in price. Rather, the swing trader focuses on changes in market sentiment about particular stocks.

Moving average indicators are key to swing trading. That’s because they help the trader interpret how the market feels about a given stock. Remember, the stock market is largely a measure of how people feel about companies and businesses.

A swing trader employs a particular kind of moving average called the exponential moving average, or EMA. The EMA doesn’t only reflect the average of a stock’s price for a given period. It also factors in the latest data points for that stock.

These might include company announcements, market news or relevant current events that could impact its stock (consider the extent to which the COVID-19 pandemic impacted airline and tourism businesses, for instance).

By interpreting these data using the EMA, the swing trader, will try to determine where bullish (optimistic) market sentiment changes, or swings, to bearish (pessimistic) sentiment.

They’ll use that data to time their entry and exit points for a trade — going either long or short depending on the swing and looking to exit a position once they believe the sentiment is set to swing back.

News Trading: Predicting Market Reactions To Current Events

Many trading strategies have a lot in common with each other.

You could think of news trading as swing trading’s cousin. But rather than using technical analysis to determine when prices are likely to move up or down, the news trader monitors current events to predict how a market might react.

 Again, consider the airline example above. A news trader might interpret the breaking pandemic stories as a signal airline stocks are about to fall, and either place short trades to profit from the downside, or wait to buy shares after the fall. 

scalping trading strategy
Source: CMC Markets

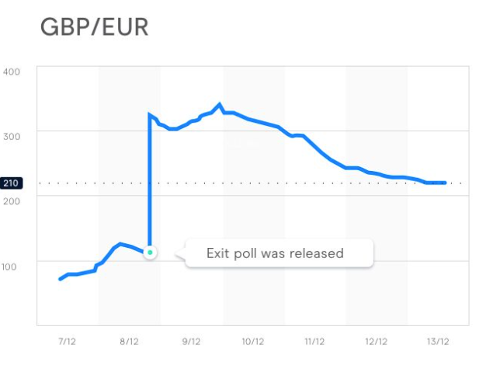
See the chart above for an example of how the Brexit news had an immediate impact on the Pound/Euro exchange rate.

News trading requires a lot of research and time. It’s a less exact trading strategy that carries its own unique risks.

Scalping: Aiming to Accumulate Many Quick, Small Gains

Scalping is similar to day trading and trend trading strategies. The scalper will look for quick opportunities to profit using a combination of technical analysis and maybe some trend following.

But, rather than wait for a trend to establish itself, or change, the scalping trading strategy dictates that you get out of every trade fast.

Rather than trading, say, one or two positions a day, you’d trade maybe five or 10, with the aim of gathering up a handful of small wins that amount to a solid return.

The image illustrates how a scalper might approach a trading position.

trading strategy
Source: CMC Markets

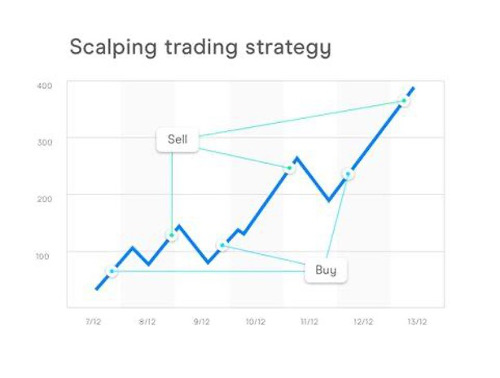
While there’s no overnight risk (as scalping is a type of day trading), this trading strategy does require discipline, focus, and a tolerance for stress.

Algorithmic Trading Strategy: The Way of Wall Street’s Elite

All the stock trading strategies above have one thing in common: The trader makes the decisions on what they’ll buy and sell, when, and for what reason.

But all those trading strategies can be augmented with another.

In algorithmic trading, the onus is on a piece of software to decide what you should trade.

Algorithmic trading — also called black box trading, or automated trading) involves a computer interpreting huge amounts of market data to determine the best way to trade the market on a given day.

The algorithm produces trading recommendations which you can either manually follow, or automate, depending on the system.

This type of trading relies heavily on the quality of the algorithm you use (and the talent of the people who create it — check out Motion Trader for an example of a very successful trading algorithm).

How To Learn Stock Trading Strategies And Get Started As A Trader

 The stock trading strategies we’ve outlined above are just a few of the main types in the market.

There’s many more — and more being created and refined all the time as markets and technologies evolve.

If you want to learn, you have a centuries worth of knowledge to draw on in the form of books, online courses, YouTube channels and more.

The best thing to do is to start learning, talk with other traders and seek to build your knowledge.

If you’re not investing already and are just starting out, you might want to consider this brilliant stock simulator where you can start testing your ideas without any risk to your capital.

portfolio tracker

However You Choose To Trade The Market, You Must Do This…

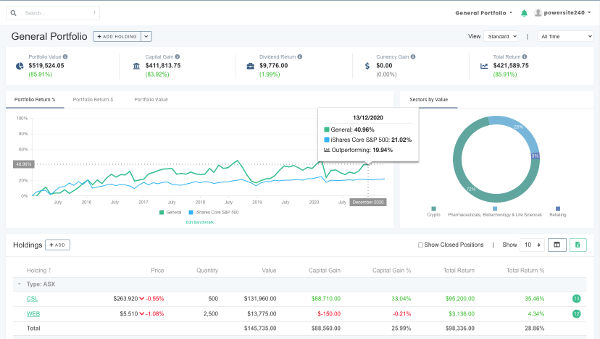
Whether you’re day trading, swing trading or an algorithmic trader, there’s one tool you should make sure you have for your journey: A dedicated portfolio tracker.

When we invest and trade, we often just focus on stock prices and returns. But, in reality, there’s many more factors that impact how much money we actually make (or lose) in the market.

That’s why you need to portfolio tracker that calculates your true, annualized performance for your portfolio and the holdings in it.

True performance is different from the simple ‘gain’ you’ll see in your trading account. It accounts for how long you’ve held a position, trading fees, currency gain, taxation and dividend income.

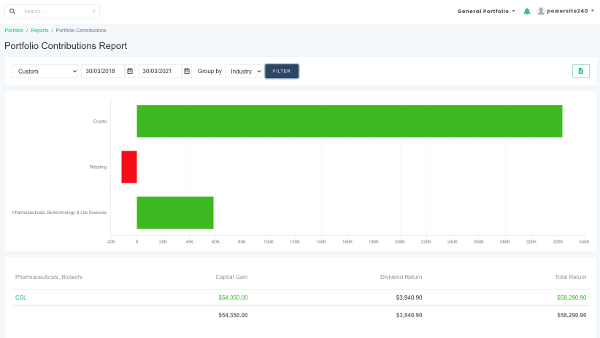
The portfolio tracker we run here at Navexa does all this (plus, you can generate a variety of reports, from calculating unrealized capital gains to taxable income, portfolio contributions, and many more).

Take a free trial of the Navexa portfolio tracker and see for yourself what your portfolio’s true performance really is.

Categories
Financial Literacy Investing

Short Float: What, Why, How & Examples

For the everyday investor, the world of short selling can seem like a dark and mysterious art. Perhaps one of the least understood terms in it is the ‘short float’. In this article, we explain what short float means, how it fits into trading, and how some investors use it to find profitable trades.

What is a short float?

Like many jargon terms you encounter when you get into the investing world, the short float is an often misunderstood — but relatively easy to grasp — term.

In this post, we explain what a short float means, why it exists, and how understanding it applies to everyday investing.

Plus, we share some examples of how investors and traders use the short float when they’re researching and executing trades.

Breaking It Down: What Is A Stock’s Float?

In the context of investing, the ‘float’ refers to the number of a company’s shares that are available to the public at a given time.

See, not all a stock’s shares are available for the everyday investor to buy or sell.

Shares are generally divided up into restricted and unrestricted groups.

Restricted shares are those issues to directors, executives and corporate affiliates.

The rest are available to the market.

It’s these unrestricted shares that constitute a stock’s float.

It’s important to understand that the size of a stock’s float (in other words, the total number of shares available on the open market) can impact its volatility.

A smaller float could mean it’s more difficult to buy or sell shares.

You might think checking a stock’s ‘shares outstanding’ figure will give you an indication of its potential liquidity.

But, it’s important to understand that the float is different from shares outstanding.

While shares outstanding refers to the total number of shares a stock has (including restricted shares), the float refers only to those actually available for everyday investors to buy and sell.

Short Selling: A Brief Explanation

You might have heard the term ‘short selling’ when the Gamestop story was in the headlines in early 2021.

Short selling — or just ‘shorting’ for… well, short — is when you borrow shares from a stock broker and sell them to another investor for a given price.

You also agree that you will buy those shares back at a specific time.

If you borrowed $5,000 worth of shares in a company you thought was going to be trading 50% lower in three months — and your prediction proved correct — you’d be able to buy those shares back for $2,500, return them to your broker and pocket the other $2,500.

That’s shorting in a nutshell.

It’s a way to potentially profit from prices falling instead of rising.

It’s important to note that you can’t short sell shares you own.

You have to borrow them, sell them, buy them back and return them to make money from shorting.

There have been many famous and infamous examples of traders making their fortunes by shorting assets and markets.

Kyle Bass, for example, bet about $4 billion against US subprime mortgage-backed securities right before they sent the global markets into a crash.

The Short Float Explained

A stock’s short float is the percentage of shares which investors are shorting relative to the total available — or floated — shares.

Another term for it is ‘short interest’, which says it all.

Learning about a stock’s short float means you’re learning how many investors are betting that the share price is going to fall.

According to ragingbull.com, the short float for a given stock rarely exceeds 50% — although it’s not impossible.

Generally speaking, you could say a stock had substantial short interest if the short float were above 40%.

A figure like that tells you that 40 in every hundred of a company’s unrestricted shares have been borrowed by short sellers.

Remember, shorting a stock involves borrowing from a broker, selling at market prices and agreeing to buy back and return at a specified time.

What does that mean for the everyday investor?

Primarily, you might look to the short float as an indicator of market sentiment.

While I personally prefer a value-based fundamental analysis approach, you could, for example, use the short float information to compare against a stock’s fundamentals to gain a clearer idea of where the price might be going.

How Do You Find Information On A Stock’s Short Float?

The exchange on which a stock trades should publish the numbers indicating short interest regularly.

The NYSE publishes short numbers twice a month, for instance.

Check with your local exchange to make sure you know where and when to access the data.

How Understanding A Stock’s Short Float Could Help

While the short float isn’t a complete indicator of coming price action or sentiment around a stock, it can help you understand a couple of things.

If you find that a stock has high short interest, this may mean that the company is struggling and that prices are indeed on their way lower.

If you are comfortable and competent with short selling, perhaps you’ll choose to use that as an opportunity to short.

Or, according to ragingbull.com, high short interest may be indicating that while a stock could be about to drop in value, investors are expecting the price to bounce back.

They may be trying to short the stock lower and then buy shares before it rebounds — trying to profit on the way down and the way up.

It’s never going to be obvious exactly what high short interest indicates about a given stock. There’s many possibilities.

That’s why, in my case at least, I’d be looking to pair my understanding of the short float with other forms of analysis.

For me, that would be fundamental analysis and company valuation.

For others, maybe that means technical analysis or research into news around the business and future events that could impact its profitability.

If 40% Is A High Short Float, What’s A Low One?

This trader points out that in 10 years of trading, they’ve seen a lot of short float data.

It’s possible that a short float can go to zero — that there are no borrowed shares at all and no one willing or able to short the stock.

That’s rare though.

Generally, you’d consider a stock to have a low short float if it were around 10%-20%.

When there’s little supply, as in a low float, it won’t take as much volume to produce a price movement.

For example, 10,000 shares changing hands in a stock that has a float of 1 million would, in theory, create a bigger price movement than if that stock’s float were 10 million.

In terms of the short float, this relationship between the amount of shares available and the volume matters, too.

  • It’s important to understand that float matters relative to volume.
  • You can think of the float as the supply of shares at any given time.
  • You can think of volume as the demand.

Calculating The Short Interest Ratio

The short interest ratio is a means of understanding what a stock’s short float could tell you about upcoming price action.

You can work out the extent to which short sellers are targeting a stock by calculating its short interest ratio.

How do you do it?

It’s easy.

You just need to find the short float number — remember, that’s just the amount of available shares traders have borrowed for short positions.

Then, divide that number by the stock’s average daily volume.

Some investors will refer to this ratio as ‘days to cover’.

The short interest ratio will give you the approximate number of days it would take for the market to ‘cover’, or buy, all the short positions in the stock.

The bigger the ratio, the longer it could take for the market to buy the shares from the short sellers.

And the longer it would take the market to buy those shorted shares, the higher you’d judge the short interest in that stock.

The short interest ratio will rise and fall as trades and volume fluctuate.

How Investors Can Use The Short Interest Ratio

Here’s a great example of the short interest ratio at play with Tesla.

Take a look at the charts:

short float

The three charts show…

  1. How many days it would take for the market to cover the Tesla short positions — in other words, the short interest ratio.

  2. The number of shares borrowed for short selling (the short float).

  3. The daily average trading volume for Tesla stock.

This example illustrates that the relationship between the short float, short interest ratio and volume don’t always move in sync with each other.

According to the article:

In July and August 2016, the short interest ratio rose despite the number of shares short falling.

That was because the daily average volume fell sharply during that time.

Additionally, the short interest was steadily declining in 2018 despite short interest being elevated because the average daily volume was steadily rising on the stock.’

You can see that — as with most things in investing — understanding the short interest in a stock is not an exact science.

It’s important to consider information like the short float, short interest ratio and volume in relation to one another.

Short Interest Ratio Limitations

One of the main limitations of the short interest ratio — and the short float — as an indicator, is that it’s only updated relatively infrequently.

Generally, the market reports the short float (and therefore the short interest ratio) every fortnight.

By the time that information reaches the market, the short positions in a stock could have grown or shrunk.

Volume, too, fluctuates far more frequently than every two weeks!

The short interest ratio — even if were updated on a daily basis — is really only a guide.

Current events and market news also impact trading volumes greatly.

Think of the stock in the example from Investopedia above, Tesla.

This is a stock that often produces dramatic price movement thanks to its high profile business operations and highly visible CEO.

If you were looking at the short interest ratio on the day Tesla announced its massive Bitcoin investment in early 2021, for instance, and that information was two weeks old, the numbers probably wouldn’t be accurate at that time.

Short Float Versus Short Interest Ratio

Now that you know what the short float and the short interest ratio are, be sure to understand the difference between the two.

Remember, the short float is the number of unrestricted shares investors have borrowed to short sell in the hope that they can buy them back at a lower price.

Investors will sometimes refer to the short float as short interest.

But short interest and the short interest ratio are two different things.

The short interest ratio is a formula you use to determine how many days it would take the market to buy — or cover — all the shorted shares.

Now You Know How To Determine & Interpret The Short Float

If you came into this blog post unsure about what short selling, short float and short interest meant, I hope you now have a much better idea.

Like other methods of analyzing a stock, trying to interpret short interest isn’t an exact science.

When you’re sizing up a potential investment and trying to determine whether you want to risk your capital on it — and bearing in mind this post is general information, not investment advice — you can never be 100% sure what a stock is going to do next.

But, what you can be sure of is how your investments and portfolio are performing to date given the decisions you’ve made.

While past performance is no guide to future returns, understanding the details of your portfolio performance is, I believe, a crucial part of forging a profitable wealth building journey.

That’s why my team and I developed the Navexa portfolio tracker — a platform that gives you in-depth true performance analytics on your stocks, ETFs, cash accounts, cryptocurrencies and even unlisted investments like property.

Categories
Financial Technology Investing

Direct vs. Portfolio Investment: We Weigh Up The Pros & Cons

You have two main options for exposing your capital to the stock market: Direct and portfolio investment. Which suits investors best depends on a variety of factors. Let’s take a look at the case for direct versus portfolio investment. 

Should you buy a stock, or buy an exchange-traded fund? In other words, should you buy shares in a single company, or buy shares in many companies, to generate the best return?

It’s a question that divides investors and analysts alike, largely because the answer depends on the individual’s objectives and risk tolerance.

In my eight years’ investing experience, I’ve opted exclusively for stocks instead of funds. That’s because I prefer to research companies directly. It just suits me to invest directly, too.

And that’s not to say I have anything against ETFs or ‘portfolio investing’. As you’ll see in this post, each method has its own merits and potential drawbacks.

Buying Individual Stocks vs. Buying Shares In A Fund

When you buy shares in an individual stock, you’re tying your capital to the fortune — or misfortune — of a single company. You’re not investing on the basis that the wider market, or the sector in which your stock operates, is going to rise.

You’re betting that this single company is going to outperform its competition and ultimately beat the market’s returns. On the other hand, when you buy shares in an ETF, you’re buying a sector, or bundle of stocks that share a common property.

This ties your capital to what happens to the group as a whole, not the performance of a single company.

We sometimes refer to this as ‘portfolio investing’, since you are in effect buying a slice of a pre     defined portfolio of equities     , rather than directly buying stocks for your own portfolio.

The Advantages Of Direct Investment Into Stocks

I’m biased here, because as I said, I have invested exclusively in individual companies as opposed to ETFs or portfolio investments. But, I am going to cover the advantages and disadvantages of both.

Please bear in mind, that this is general information on this topic and it does not constitute financial advice. Each of us has our own unique set of preferences, goals and challenges.

So I encourage you to do your own research and seek professional advice before you make any investment decisions one way or the other.

So, to direct investment in stocks.

Here’s the biggest advantage: If you’re a keen and diligent investor who’s not afraid of putting in the hard yards to research and value individual stocks, you may be able to generate a higher return than just parking your money in an ETF.

Each company trading in the market has an extensive set of factors driving its stock price at any given time. It could be a new technology or product, an acquisition or deal, a piece of legislation that impacts the business… whatever it is, events often impact certain stocks in certain ways.

If your research leads you to one of these opportunities — say, a biotech stock trialling a revolutionary treatment that could save millions of lives, for instance — then direct investment into that one stock could potentially make you more money than an ETF than contains that stock in its portfolio.

The Disadvantages Of Direct Investment Into Stocks

As we pointed out in our blog on the pros and cons of dividend reinvestment policies, concentrated exposure of capital to a particular investment brings as much risk as it does potential reward.

If you’re the type of investor who puts in the research to find and buy great stocks that deliver strong returns, then direct investment could be a profitable strategy for you.

However, no amount of research will change the fact that buying shares in a single company means you expose your capital to its stock’s potential to rise and fall.

The old ‘eggs in baskets’ analogy is useful here. Buying a single stock as opposed to buying a portfolio of stocks in the form of an ETF is akin to putting your eggs in one basket.

It’s a question of risk.

Just as a particular company can outperform a sector or market, so can it underperform and drop in price even when other, similar stocks are performing relatively well.

Diversification is perhaps the most common idea when we talk about managing and mitigating risk in an investment portfolio.

Direct investment in one stock is about as far from diversified as you can get, whereas ETFs are created by professional portfolio managers to whom diversification and risk management are often their primary objective.

KEY TAKEAWAYS

  • Expose your capital to the exact stocks and companies you choose.
  • Requires more independent research.
  • Potential for high returns if the individual companies you invest in outperform the market.
  • Investing in just a few stocks may compromise your portfolio’s diversification.
  • Risk of lower returns if individual companies you invest in underperform their sector or the wider market.

Read more here.

The Advantages Of Investing In A Portfolio or ETF

I don’t personally invest in ETFs. And I’m certainly not advising whether direct or indirect investment is best for you.

The idea of indirect investment in markets or sectors through ETFs is a valid and increasingly popular one today. Many of us know we need to be exposed to the stock market in order to build out wealth over the long term.

But, equally, many of us don’t have the time to put in the long hours of research and analysis to find the particular stocks that might suit our goals.

An ETF is like a mini-portfolio of investments. Depending on what’s in the ETF, it may offer investors some risk-management in the form of diversification.

For example, if you bought a biotechnology ETF comprised of, say, 100 companies, you’d get exposure to that sector and the performance of all the equities in the fund.

The fund might include assets that hedge against risks to the biotechnology sector. This indirect way of getting exposure to these companies might then come with less risk than picking and investing in a single one.

Also, when you consider the time and energy it takes to research, execute and monitor investments, indirect investment in an ETF can alleviate some of the burden that comes with direct investing.

If you want to gain exposure to biotech stocks and you simply don’t have the time to dive in to all the research on the various companies and factors in their performance, you could opt to buy a fund that broadly, indirectly exposes you instead.

The Disadvantages Of Portfolio Investing

As with direct investment in individual stocks, ETF, or portfolio investing, comes with potential downsides, too.

I’m not saying these apply to every ETF out there, but the following points you may want to consider when weighing up direct versus indirect investment.

  1. An ETF may not be as diversified as you’d like: With stability and risk management high on the list of fund managers’ concerns, ETFs may skew towards large and mid-cap companies. This might mean you miss exposure to potentially high-growth small cap stocks in the sector.

  2. You may pay higher investment fees: When you buy a single stock, you’ll pay a brokerage fee. When you buy shares in an ETF, you’ll pay a brokerage fee and a management fee — usually as a percentage of your investment’s returns — to the people running the fund.

  3. Your dividend yields may be lower: Because ETFs by design track a broader market or sector, they generally don’t prioritise yield. Having said that, there are some funds out there that focus more on income than capital gain.

The sheer variety of stocks and funds out there means these pros and cons certainly don’t apply across the board. And remember, it’s important to do your own research and consider your goals and risk tolerance.

KEY TAKEAWAYS

  • Quicker way to get exposure to an entire sector or market.
  • Allows you to effectively outsource the research to the fund managers.
  • Gives you more diversification because one share of an ETF exposes you to the portfolio of the fund’s investments.
  • Potentially higher investment and management fees.
  • Potentially lower dividend yields.

My Personal Preference: Direct Investment In Stocks I Know Well

As I’ve said, I don’t buy ETFS.

I’ve never bought shares in anything other than individual stocks. Why? Because, in the same way some of us prefer to drive a manual car over an automatic, I prefer having a greater degree of control over my investments.

That’s not to say that because I prefer stocks I am more in control of my returns. But, in my experience, I am more in control of the assets to which my capital is exposed by being in the market.

Research, for me, isn’t a chore. I enjoy digging into a company’s price movement, financials and business model to uncover investment opportunities I believe are going to make me great long-term returns.

Direct investment means I can control every aspect of my portfolio’s composition, diversification, the extent to which I’m targeting income versus capital gains, and so forth.

While there may come a time when indirect investment suits my needs, right now I prefer to have my portfolio in my own hands — not the hands of fund managers.

However You Prefer To Invest, You Must Track Your Performance

I hope you now grasp some of the pros and cons of both direct and indirect investment. Like I say, it’s really up to you how much diversification you seek and risk you take on.

Your financial objectives and challenges are no doubt different from my own.

But, whether you prefer investing in single stocks, or the broader exposure you can get by indirectly owning large groups of stocks through an ETF, there’s one thing you absolutely should start doing.

If you don’t do this already, you may not have a clear picture of how your investments are performing for you. What am I talking about?

Tracking your true portfolio performance.

Over my eight years as a self-directed investor, and more recently launching a dedicated portfolio tracking platform, I’ve learned that far too many people ignore crucial facts about their investment performance.

One of the main reasons for this is, in my opinion, the average broker doesn’t provide sufficient detail for you to accurately measure and analyse your portfolio.

For instance, if I tell you that a single stock investment and an ETF investment have produced the same return, say 100%, would you say there’s nothing to choose between them?

Looking at the average broker account, it might seem that way, since most display a simple ‘gain’ metric.

But what if I told you that the stock took a year to return that 100% and the ETF took three?

You’d see that the stock was the better option, right? So, if you’re serious about generating great returns for yourself over the long term, I encourage you to look beyond just ‘gains’.

Three Tools I Use To Better Understand My Returns
(And, Hopefully, Make Better Investing Decisions)

As a dedicated portfolio tracker, Navexa gives me insights into my portfolio performance I simply cannot get through my broker. Here are three tools I use to better understand portfolio.

Annualized Returns: Navexa’s performance calculation factors in everything that affects my portfolio. Time, taxation, trading fees, dividend income, currency gain and losses — everything that impacts what I would exit the trade with when all is said and done. When I look at my portfolio in my account, I know I’m seeing my true performance.

Portfolio Contributions: This reporting tool shows me which holdings are boosting, and which are dragging down, my overall returns. This helps me to make decisions on which stocks to sell and keep.

Direct vs Portfolio Investment

Custom Benchmarking: This one is especially useful if you’re comparing your portfolio against an ETF. If you have a portfolio of individual stocks, like I do, and you see that a given ETF (Navexa lets you benchmark against any security or fund traded on the ASX, NYSE or NASDAQ) is outperforming your portfolio, you might consider switching up your strategy!

Direct vs Portfolio Investment

I hope this post has helped you understand some of the differences between direct and indirect investment. Remember, you’re on your own investing journey — none of the above is financial advice.

Whether you directly invest in stocks, or you opt for a portfolio investing strategy through ETFs, always remember you’re risking your capital in the stock market.

Risk is the price we pay for the chance to earn better returns than leaving our money in the bank.

And the elevated risk levels I live with as a self-directed investor are a big part of why I founded Navexa.

Learn more about our dedicated portfolio tracker.