Categories
The Data-Driven Investor

TDDI #008: I was overexposed and didn’t even know it

As a 24-year-old, who’d just started investing, I was excited.

I wanted to put my hard-earned money to work.

I wanted to make money while I slept.

I wanted to invest as much as I could.

But…

I didn’t really know what I was doing.

I was jumping between individual stocks.

Buying ETFs.

And trying to build a ‘diversified’ portfolio.

But without knowing it, I was concentrating my risk.

I was not as nearly as diversified as I thought.

How could this be?

I owned several different stocks.

A few different ETFs.

But, my naive 24-year-old brain was missing something about my investments .

I had a big overlap problem

I bought some blue chip stocks.

Then I bought a financial sector ETF.

Then an index tracking ETF.

But what I didn’t realize is that some of the same stocks were in all three of these.

The index tracker was top heavy with banks.

The financial sector ETF had those same banks in it.

And I had also bought those banks again individually.

Did I really want to be so exposed to the banking sector?

Absolutely not!

But this is a common situation I have found when talking with passive investors.

Often, they don’t actually know what is inside the ETF they have bought.

By the time you buy a bunch of them thinking you are diversifying…

You end up like I did.

So how does an investor avoid this?

Know your ETF

When buying an ETF, do your research and find the list of stocks that are inside it.

From here it becomes pretty obvious if you are going to have an overlap problem or not.

For example, if you own a lot of Apple shares and the ETF you want to buy has a position in Apple as well, you need to decide if that is what you want.

And depending on your strategy, you may be perfectly happy with that.

But the point is, you need to know that this overlap exists.

Build your knowledge, build your portfolio

Back when I started investing I clearly didn’t have enough knowledge.

And look what happened.

I ended up concentrating my risk into a few stocks by mistake.

Losing money because that particular sector didn’t move much.

All the while, thinking I was diversified across the market.

Even though I harp on about strategies a lot…

This issue can still crop up even with the best of strategies.

The key here is building your investment knowledge.

Be aware of what you are buying.

Things on the surface can look great.

But diversifying is not always as easy as just buying ETFs.

Knowledge pays the best dividends,

Navarre

The Data-Driven Investor

Categories
The Data-Driven Investor

TDDI #007: Love It Or Hate It (Just Don’t Overpay It)

There is an element to investing that people try to ignore.

It’s not fun.

It’s not sexy.

And it involves you losing a chunk of your hard earned investment gains.

Of course, I’m talking about tax.

I’m yet to meet a person who loves this aspect of investing.

Except maybe my accountant.

Yet, this is an area that you can not ignore.

I personally have ended up paying the government much more than was legally required.

Why? Because I didn’t like thinking about tax.

I didn’t want to know.

I didn’t optimize my investments for tax outcomes.

And, I paid for my wilful ignorance. 

If you’re investing, here’s what you must understand about taxation. 

Play a game of pass the parcel

In many countries, you have to pay capital gains tax when selling a stock.

This is a portion of the profit you make from the sale.

This is calculated by using the cost base of the holding and subtracting the gain by the cost base.

E.g. You buy some shares for $1000 (cost base) and sell them for $1500, you have made a $500 gain.

But what happens when you have bought the same stock multiple times (parcels), then sell some of it?

You get to choose a CGT strategy for calculating the gain/loss.

This can have a significant effect on what the end gain works out to be.

Let’s look at an example:

  • I buy 100 shares of Stock ABC for $3 = $300
  • I buy 100 shares of Stock ABC for $5 = $500
  • I buy 100 shares of Stock ABC for $6 = $600

So all up I own 300 shares of stock ABC.

What happens if I sell 100 shares for $5 a share for a total of $500?

I could use the FIFO (first in, first out) strategy — I  sell the first shares I bought.

So that makes the cost base $300 and the sale $500 — a $200 gain.

I could use the LIFO (last in, first out) strategy — I sell the last shares I bought. 

This makes a cost base of $600 and the sale of $500— a $-100 loss.

There are other strategies, too. 

But you can see from this simple example how you can go from owing tax, to owning nothing.

And if all the CGT strategy options still result in a gain, there’s still moves you can make to mitigate. 

Turn a loss into a tax gain

When you pay capital gains tax, you pay it as a total of your entire portfolio.

Which means if you make a gain on one stock, you can cancel it out with a loss from another.

This is  tax loss harvesting.

Tax loss harvesting is a strategy that involves selling stocks at a loss to offset a capital gains tax liability, thereby optimizing your after-tax returns.

This concept is powerful enough to potentially kill an investment tax obligation. 

Tax Knowledge Pays Dividends

Even with just this basic investment tax knowledge, you can potentially save a lot of money.

There’s no excuse for not knowing how investment taxes work.

If I had known these tax basics when I started, I might have kept a lot more of my gains.

So before you do your next tax return, have a think about which CGT strategy you are using.

If you are an Australian tax resident and it starts getting hectic calculating cost bases and keeping track of parcels, remember we help with that.

Check out Navexa now.

As always, knowledge pays the best dividends.

Navarre

Categories
The Data-Driven Investor

TDDI #6: My Controversial Opinion On Diversity (In Index Funds)TDDI #6:

A lot of people talk about buying index tracking ETFs.

Finfluencers.

Gurus.

Friends.

Even Warren Buffett has promoted index tracking ETFs.

The idea behind this is that you get decent diversification relatively easily.

As we learn early in our investing careers, diversification is a good thing, right?

Right?

Well, it depends on how you define diversification.

Is it owning multiple stocks?

Is it owning multiple stocks across different industries?

Do these stocks need to be of equal value in your portfolio?

Do these stocks need to be from different countries?

There are many different ways to diversify.

Note: Absolutely none of what follows should be considered financial advice — merely a personal investigation into the numbers behind diversification. 

Don’t Underestimate Big Companies’ Dominance 

The ASX200 index covers the top 200 companies listed on the ASX.

And there are many ETFs out there that track this index.

Buying into one of these would give you broad diversification in terms of number of companies.

But how diverse is the ASX200 really?

With a little bit of digging, you will find that the top 10 stocks in the ASX200 makeup more than 50% of the index’s total market capitalization.

In other words, the ASX200 is very top heavy.

BHP is the number one stock in the index, with a market cap of ~$200 billion.

Compare that to the 200th stock in the index, with a market cap of $1 billion.

This means if BHP has a bad year, it can significantly impact the whole index.

So what does this look like in a real portfolio?

Meet The ASX10 Big Heavyweights

Let’s take a look at a theoretical portfolio made up of the top 10 ASX stocks in 2018.

Let’s call it the ASX10.

In the past five years, the ASX10 has outperformed the ASX200 index.

With capital gains and dividends included, the ASX10 achieved a return of 12.45% p.a. — outperforming the ASX200’s return of 9.81% p.a.

You can see from the chart that the movements were almost identical the whole way through.

But the ASX200 had 190 other companies influencing its overall performance.

So while you get diversification from an ASX200 index fund, is it the kind of diversification you want?

It Pays To Know What Comprises Index ETFs

To be clear, I’m not saying investors shouldn’t buy index funds. 

If it’s between doing nothing with their money or investing at all, then index funds might be a great idea.

They do, after all, track the performance of an index — most of which, over the long term, tend to go up. 

But for those of us who pay closer attention to what we’re investing our money in…

And those — like me — who unashamedly ‘nerd out’ on every detail of our investments…

It’s worth noting that there can sometimes be hidden costs — or rather opportunity costs — to simply buying an index fund versus investing in a particular cohort of companies. 

Diversity has become one of those pieces of financial jargon people perhaps automatically presume to be admirable. 

But, as I like to say, the numbers never lie. 

Always do your own research — this is not advice and always remember that past returns are never a guide for future performance.

Knowledge pays the best interest,

Navarre

The Data-Driven Investor

Categories
The Data-Driven Investor

TDDI #005: Dead Investors are doing better than you!

What makes you a good investor?

Is it because you make great decisions?

You have the most knowledge?

A killer strategy?

What if I told you that, even if you had all three of these, you may not be doing as well as investors who are…

Dead.

Dead investors can’t make any decisions.

They know nothing.

Strategy? Unlikely, six feet under. 

Let me explain. 

According to a mythical study by Fidelity widely referenced in the investing world, but never confirmed, the broker’s best performing client accounts belonged to people who had either died, or had forgotten they had an account.

So, what can we learn from the dead?

Trading is hazardous to your wealth

For those of us with a heartbeat, we tend to be less than perfect in our investing.

We:

  • Are impatient
  • Make emotional decisions
  • Let ego dictate our moves

This means we trade more. 

100% more than the dead. 

With each trade, we lose money to trading fees.

We pay taxes on gains.

We realize losses.

Increased trading activity often contributes to poor investment performance.

Become an expert at feigning lifelessness

If the dead are good at one thing, it’s being patient.

You could say they are the ultimate passive investors.

When Warren Buffett says his ideal holding period is forever, then the dead are *cough* living that ideal. 

When you buy into an entire market, or sector of the market through ETFs — and then do nothing — you’re emulating a dead investor.

You sit back and get rich slowly.

This mythical Fidelity study proves — on a long enough timeline, at least — this strategy is highly effective.

Inaction can be a super power

Society has always praised people for taking action.

It’s also one of the things I pride myself on.

But when it comes to investing, inaction is often more powerful.

Not making emotional decisions.

Not FOMOing in and out of positions because of the news.

These things sound simple to avoid.

But they’re easy to fall for.

Don’t get me wrong, complete inaction, is not good.

Afterall, you have to take action at some point to invest in anything.

But, making calm and calculated decisions is usually best.

We can learn a lot from Fidelity’s mythical dead (or just inactive) investors.

Reducing trading activity saves on fees, taxes and realized losses.

Time in the market, as the saying goes, generates more value than timing the market.

Knowledge pays the best interest,

Navarre

The Data-Driven Investor

Categories
The Data-Driven Investor

TDDI #004: Rome Wasn’t Destroyed In A Day

My name is Maximus Decimus Meridius, commander of the Armies of the North, General of the Felix Legions and loyal servant to the true emperor, Marcus Aurelius

Citizen of a failing currency, Victim of a collapsing economy’.

That’s not how the protagonist in Ridley Scott’s 2001 blockbuster Gladiator announces himself to his arch-enemy. 

But, it could have been.

Allow me to give you a quick lesson in ancient history.

This puts the present-day ‘war on inflation’ that’s dominating the markets and financial newscycle into perspective. 

Then, I’ll show you how misquoting Russel Crowe connects with my personal investment philosophy. 

Inflation: We’ve Been Here Before

When it first entered circulation, the Roman Denarius coin contained about 4.5 grams of pure silver.

This enabled the vast empire’s citizens and organizations to do business, receive payment for goods and services, and store wealth for the future.

The coins had value because the silver in them was scarce.

So scarce, in fact, that as the years went by, Rome started to run out of silver with which to make its coins.

So they started minting more coins with less silver in them.

Over a century, the Denarius went from containing 75% pure silver to just 5%.

The government printed more and more of them with the same face value, but less and less of the precious metal that gave them value in the first place.

This created the illusion of more money in the system. But the reality was that Rome’s debasement of its currency transferred wealth away from citizens and resulted in them having to use more and more coins.

The other word for this is inflation.

Rome effectively robbed its citizens of their power to exchange and store wealth.

This drove hyperinflation, produced soaring tax rates, and created worthless money, plunging the empire towards its demise. 

The Dollar’s Diminishing Power

If ancient Rome was a lesson, it appears as though civilization hasn’t taken it on board. 

In the first decade of the 20th Century, the total amount of money in circulation in the U.S. was about $7 billion.

One dollar could buy you a pair of brand new patent leather shoes.

By the 1950s, there was $151 billion circulating.

A dollar couldn’t buy you a pair of patent leather shoes. It could buy a Mr. Potato Head toy.

Fast-forward to the 1980s and there were nearly $1.6 trillion dollars in the financial system.

The dollar could now get you just a single bottle of Heinz ketchup.

In the first decade of the new millennium, the money supply ballooned up to nearly $5 trillion.

Now, the dollar could only buy a Wendy’s hamburger.

By 2017, the money supply had grown to more than $13 trillion — almost five times what it was at the turn of the millennium.

And that single dollar that could buy you a brand new pair of patent leather shoes more than a century ago?

It now buys only a single song on iTunes.

See the pattern? More money does not equal more wealth. 

Why We Invest

I talk to friends and family about wealth as often as I can. 

(And yes, I watch Gladiator on a regular basis. Are you not entertained?!)

I believe open and frank conversations are key to building financial literacy. 

And I believe financial literacy is crucial for creating financial freedom. 

Historical facts like those above are central to why I invest — rather than simply leave my money in the bank. 

Yes, you could argue there’s more risk associated with owning things other than cash.

But, when you consider inflation’s long history of insidious wealth destruction, I’d argue it’s wise to understand the difference between money and actual wealth. 

Knowledge pays the best interest,

Navarre

The Data-Driven Investor

Categories
The Data-Driven Investor

TDDI #003: Is The Market Efficient, Or Random?

There are people who believe the earth is flat. 

There are others who believe we’re living in a computer simulation. 

Or that a hidden race of Lizard People are running society from the shadows. 

There’s a whole lot of different ways to make sense of the world we live in. 

The same goes for the financial markets. 

There are those who believe in the so-called ‘50% Principle’ — that any uptrend must correct by 50% before resuming its rise.

Others prefer ‘Odd Lot Theory’. 

This is the idea that when smaller investors sell out of something, it’s because they’re wrong, and it’s therefore a good time to buy.

I know of one allegedly very wealthy investor who believes every financial market on the planet — property, stocks, commodities, you name it — moves in a repeating cycle, in which prices rise for a certain number of years, then fall for a certain number of years.

In today’s newsletter, though, I want to introduce and compare two of the less far out — and more influential — theories about the market. 

100% Efficient? 100% Of The Time? 

Efficient Market Hypothesis (EMH) claims that the price of any investment reflects everything the market knows about it at any given time. 

In other words, the market ‘prices in’ all available information about an asset.

Because of this, it’s impossible to ‘beat the market’, as the market already knows everything you could know.

The market is, in this theory, all seeing and all knowing. 

EMH is more than a century old and is most often attached to American economist Eugene Fama.

It’s crucial to understand that in Fama’s EMH, he’s talking about whether one can beat the market without taking on any extra risk

Anyone who beats the market’s returns can only do so by taking on additional risk.

Many investors, of course, aren’t keen to do this — which is possibly why there’s been such an appetite for passive ETF investing in the past few years.

EMH believers believe in keeping investment costs low and not bothering trying to outperform the perfectly priced market. 

Opponents, on the other hand, believe you can. Even without taking on additional risk.

Why?

Because the market is NOT perfectly efficient. Prices do deviate from their fair, or intrinsic, values. 

Enter the next theory of how the markets work. 

The Market Is A Drunk Man. 

In 1828, Scottish botanist Robert Brown dropped grains of pollen in water.

He observed that, suspended in the water, the pollen moved in a rapid, and random, oscillatory motion. 

About 70 years later, French mathematician Jules Regnault found that the longer you held a stock, the more it deviated from the price you paid for it. 

These two experiments form the bases of Random Walk Theory. 

This theory posits that asset prices change at random. Past prices are of little use in predicting future ones. 

And, to make our lives even tougher as investors, the market being the efficient (in theory) animal that it is, prices in all available information to these ‘random walks’. 

Economist Burton Malkiel popularized this theory in 1973 with his book A Random Walk Down Wall Street.

He called stock price movements the ‘steps of a drunk man’.

Random, unpredictable, unreliable. 

Random Walk Theory is another view of the market that leads followers to believe that it is impossible to predict or outperform the market. 

At least, not without taking on any extra risk. 

What Do I Think?

I personally believe the market is not 100% efficient. 

I believe it is quite efficient, but there is always room for improvement.

As a value investor, I believe at any given time there are stocks that are over and under their ‘true’ value. 

As the legend Warren Buffett says, ‘in the short run, the market is a voting machine but in the long run it is a weighing machine’.

And as John Maynard Keynes said — the market doesn’t reward investors for being smarter than it…

It rewards them for taking risk. 

More on that in a future edition. 

Knowledge pays the best interest,

Navarre

The Data-Driven Investor

Categories
The Data-Driven Investor

TDDI #002: Investing Stops Being Scary When You Have This

Are you freaking out about your investments right now?

Compulsively checking your phone…

Pacing the room…

Doom-scrolling endless headlines about bank collapses and inflation rates…

Even — God forbid — considering selling all your investments and waiting for things to calm down?

If that’s you, chances are you don’t have something that separates the great investors from the vast swathes of the mediocre (and worse). 

This thing is free and widely available. 

And yet, too few of us understand its importance and value. 

While the panicked and fearful don’t choose it, use it and benefit from it…

The calm and confident are reaping its rewards right now. 

I’m talking about strategy

Investment strategy helps you eliminate emotional decisions and gives you freedom from stress.

Well, relative freedom, shall we say — compared with those who buy and sell based on emotion, for example. 

Here are three problems you’ll solve by employing a clear investment strategy.

1. Emotional decisions = emotional reactions

Back when I started investing, I had no idea what I was doing.

I remember buying into investments, only to sell out of them within a couple of weeks.

(And paying trading fees both ways…)

I’d get ‘tips’ from colleagues at work, or ‘ideas’ from online forums.

Ultimately, I couldn’t hold on to anything long term. Because I would freak out and sell. Because I didn’t know why I’d bought in the first place, basically. Because I had no strategy guiding my decision making. 

But once I had a strategy, this completely changed.

Because now it wasn’t up to my emotions whether I should sell a stock or not. 

It was up to the strategy I had selected — and the criteria for decision-making that commits me to.

Did it meet the criteria for selling? Then I sell.

Otherwise, I’m holding on for the ride.

With my strategy, I don’t worry about such decisions.

I chose my strategy so it can guide my shorter-term decisions.

Choosing a strategy is another subject which I’ll dive into in a later newsletter.

2. Bad Moves, Made For Bad Reasons

The next thing that a strategy helps with is helping you choose the right investments.

It doesn’t matter when you buy or sell if the company you bought into is no good.

Think about these two questions.

Buy the stock because a friend told you it was a good idea?

Or…

Buy because you have a set process that you filter any investment through?

Which do you think will lead to the better outcome?

Having a strategy that helps determine what you buy is crucial.

That way, you can constantly improve your strategy, based on set criteria, rather than making it up as you go along.

3. To Be Underprepared Is To Risk Underperformance

Ultimately we all want good performance from our investments.

We want our money working hard for us while we sleep.

As with anything in life, not having a plan, is planning to fail.

Having a strategy helps keep you on the right path.

Even if that path turns out to be the wrong one, having a consistent strategy helps you figure that out fast.

Which means you can then pivot to one that works better for you.

This means you can achieve optimal performance as quickly as possible.

If you have no strategy, you may never figure this out.

To sum up…

Strategy & Success Go Hand In Hand

Choosing and committing to a clear investment strategy will:

  • Reduce/remove stress
  • Help eliminate emotional decision making
  • Help you choose better investments
  • Help improve your investment performance

Find a strategy that works for you.

There’s quite a few out there. You’ll know the one for you when you find it (and especially when you start seeing the results).

From there, you can rest easier about your investments, knowing you’re investing according to a plan.

Knowledge pays the best interest,

Navarre

The Data-Driven Investor

Categories
The Data-Driven Investor

TDDI #001: How I Doubled My Money On A Stock That Went Nowhere

One of the first stocks I ever bought was a total disaster. Or so I thought.

After holding it for five years, the value had risen 0%.

I would have been better off loaning the money to a friend and asking them to pay me $1 in interest.

So I logged into my broker account to sell my shares.

Before I hit ‘sell’, I figured I’d work out how much money the shares had generated in dividend income.

To my utter amazement, the dividends had nearly paid me back my whole investment.

This changed my perception of the investment completely. 

What I thought had made me nothing has, in reality, returned 100% — just not in the capital gains I was looking for. 

This is the power of knowing all the factors of investment performance.

Unfortunately, most investors don’t have an easy way  to calculate things such as dividend performance.

This means they end up making poor decisions based on incorrect data.

And as a data-driven investor, this pains me.

Here are the four things you absolutely must understand about any investment.

1. Capital Gains

Obvious, right?

Most investors buy into an investment, hoping that the price will go up, resulting in a capital gain. 

This is one of the main metrics to track for any investment.

Like I said, obvious. But important.

2. Dividend Income

As you saw in my story about the stock I nearly (stupidly) sold, dividends can have a huge impact.

If I hadn’t calculated the investment income and factored it into my performance, I could’ve sold this holding and ended up missing out on future profits.

Not only that, dividend income — in Australia at least — carries tax implications. These are difficult to manage if you’re not property tracking your investment income. 

3. Currency gain & loss

This one is crucial when investing in foreign stocks.

Currency exchange rate fluctuations can massively impact investments.

See the USD/AUD currency chart for the last 5 years.

Say you bought a $10,000 dollar investment in a US stock from Australia, in March 2020.

In December 2020, the exchange rate completely turned around in dramatic fashion.

Assuming the share price of the stock hadn’t changed at all.

You would have made a 32% loss, on the currency movement alone.

Sometimes this shift is against you and other times it can make you a lot of money.

But if you don’t measure it, you’re not going to know, either way.

4. Time

What do you mean time?

Well let me ask you, would you rather make a 100% gain in one year…

Or a 100% gain over five years?

Basically anyone I know would choose the first option. So would you, right?

Look at this scenario.

You buy ‘Stock A’ for $1 and in the first year it goes up to $2.

Happy with the 100% gain, you keep a hold of this stock for another year.

But in that year, the price stays at $2.

So now instead of a 100% return, you now have an annualized return of 50%.

You can see if this plays out across a few more years staying at $2, it quickly eats away at your performance.

Which is why it is crucial to factor in time when you analyze your investment performance . This is what we mean when we talk about ‘annualization’. 

These Are The Four Pillars of Investment Performance

Capital gains. Income. Currency gains. Time. 

These are what I call the four pillars of investment performance. 

Any investor who’s serious about building wealth long term should, in my humble opinion, understand and track these factors. 

Remember how I nearly sold a stock that had doubled my money?

These are the sorts of poor decisions investors might make if they don’t have all the information.

It’s very rare for anyone to fluke their way to success or wealth. 

For most people, a plan, a strategy and a certain amount of discipline is a much better path than trying to get rich quickly with a financial fluke. 

This is why I’m a data-driven investor. 

Because if you can’t measure it, you can’t improve it.

The data doesn’t lie, 

Navarre
The Data-Driven Investor

Categories
Financial Literacy Financial Technology Investing

Why Your Brokerage Account Might Not Reflect Your True Portfolio Performance

Your trading account is designed to help you buy and sell investments. While it shows you a bunch of metrics related to your portfolio, it might not reflect your actual returns or performance. This post explains the difference and shows you why tracking is arguably as important as trading itself.

As a dedicated portfolio performance tracking platform serving thousands of people, the team here at Navexa communicate with our community frequently.

One of the most common questions we receive from those just beginning their portfolio tracking journey with us, is this:

Why are the investment returns in my Navexa account different from those in my trading account?’

Many of our new members are accustomed to viewing their portfolio performance through a very different lens from the one Navexa provides.

That’s because the numbers you see when you log in to your trading account aren’t so much to do with portfolio performance as they are with nominal ‘gains’ or changes in value.

In a portfolio tracker, you’re seeing your rate of return, or growth rate, over time.

In this post, we’re going to explain the difference.

We’ll explain why, in our (biased) opinion, you won’t get a clear and complete picture of your long-term investment returns from checking your trading account alone.

We’ll explain how the figures you see differ both in their calculation and the information they reflect.

We’ll touch on the extent to which brokerage fees and commissions impact your portfolio performance — and why your trading account may not reflect that impact.

We’ll explain how an investment’s true performance differs from its gains, and share with you exactly how our portfolio tracking platform calculates that performance.

And, we’ll show you how to access our purpose-built portfolio performance tracking platform free today so you can see for yourself the difference from the numbers in your trading account.

Let’s start with the key differences between trading account numbers and those in a portfolio tracker.

Trading Accounts Are For Trading — Not Portfolio Performance Tracking

In our CommSec Review, you’ll learn my honest opinion about using Australia’s most popular trading platform.

 As a trading platform, it’s great. But, as I argue in the review:

‘Having been in the market since 2013, and done my fair share of buying and selling, all I can see are two performance metrics: Today’s Change, and Total Profit/Loss.

‘To be blunt, that’s not enough for me.

‘Why?

‘Because portfolio performance is a lot more complex than just my total profit or today’s change. 

I need to see lots more.’ 

I can see today’s change in both dollar and percentage terms, my total profit/loss, my portfolio’s current market value, and the total cost (which, as you’ll see, isn’t actually my total cost).

Below this portfolio level information, there’s a holding-by-holding breakdown. This shows me the price I bought each investment at, the last price it traded for, the day’s percentage change and so forth.

Take a look:

CommSec-Review

That’s all the information available to about how my investments are progressing. Frankly, it’s not enough to satisfy my appetite for data on my journey to creating long-term wealth through investing.

Which is why I’m in favour of using a dedicated portfolio tracker.

As I said, given that we operate one such tracker, this is obviously a biased opinion. But take a look at this screen compared with the one from my trading account:

portfolio tracker

That’s the Portfolio Performance Report in Navexa. Rather than providing just a handful of metrics about profit/loss and price changes, this screen shows four key metrics:

Total Return: In both dollar and percentage terms, the Navexa portfolio tracker shows me my portfolio’s actual, annualized return net of trading fees, income and currency gains (or losses).

Capital Gain: This shows me how much of my total return is comprised of capital gains across my investments. Again, this is annualized to reflect how long I’ve been running this portfolio (otherwise, my ‘gain’ would be the same regardless of whether it had taken me one year, or twenty, to achieve).

Dividend Return: This shows me how much of my annualized return over a given time period is down to my investments generating dividend income. In my CommSec account, for example, I can’t see my income factored into my portfolio performance.

Currency Gain: While not applicable in the example above, the reality of investing across multiple markets and currencies is that foreign exchange fluctuations impact a portfolio’s returns. A dedicated portfolio tracker, like Navexa, shows this.

You’ll also see, beneath the metrics I’ve just detailed, there’s another row showing the same numbers for IOZ, a leading ASX200 ETF.

This allows me to see at a glance how the portfolio is performing relative to the ASX200 across each of these factors. In the example, you’ll see that while the annualized return and capital gain is outperforming the benchmarked fund, it is lagging behind with respect to dividend income.

This is a valuable insight — and not one I can easily get by looking at my trading account.

In the holding list below, you can see the performance breakdown for each of the investments in the portfolio.

All the numbers you see reflect more than just the price movement of the investments. Here’s an example.

Fees & Commissions Impact Your Performance (But May Not Be Reflected In Your Brokerage Account)

My trading account doesn’t show me how fees are impacting my performance. That’s probably because I pay my broker to execute my trades for me. But consider this:        

Let’s say I make 50 trades a year for 10 years at a cost of $20 a trade.

That’s $10,000. At the end of the 10 years, say I have 50 investments in the portfolio. When it’s time to sell out and collect the cash I’ve (hopefully) earned as the portfolio’s total value has appreciated over that time… that’s another $1,000 for all the sell trades on the 50 holdings at the end of the period.

The impact of fees? $11,000.

If the portfolio had started with $50,000, and we assume a 100% total return over the 10 years (that’s a 7.18% annualized return), the investor has, on paper, doubled their money.

Hooray! Right? Not quite. 

You can see how this plays out in terms of actual portfolio performance.

For our purposes in this post, I hope you can see that trading fees play a major part in determining your true performance. Which is why you need to be able to easily see your returns net of that impact — as opposed to hidden away, as they are in many trading accounts.

Fees Aren’t The Only Factor: A Dedicated Portfolio Tracker Helps You Measure Everything Impacting Your Performance

While my CommSec account is, in my opinion, brilliant for conducting market and investment research (their tools and resources are second to none across Australian trading platforms), it’s severely limited in showing portfolio performance details.

When you really dive into the world of long-term wealth building, there are four factors that deeply affect your real returns.

Remember, I’m not talking about gains here. I’m talking about our net performance after every factor impacting a portfolio has been accounted for.

Here are the four factors:

Time: While it might be tempting to look at your overall returns going all the way back to the first day of a portfolio’s life, this can result in us misinterpreting our performance. My favourite illustration of this? Would you rather make a 500% return over one year, or 10? There’s a huge difference, and we all know it. Leaving time out of our portfolio performance calculations is straight up wilful blindness.

Trading Fees: As we lay out in detail, trading fees can and often do have a significant impact on portfolio performance. Looking at your tasty triple digit ‘gain’ in your trading account might feel nice, but when you add up the cost of all the buying and selling it’s taken to achieve that gain, the reality is probably not quite so glorious.

I have a friend who sold some crypto recently and, thanks to my incessant nagging about true performance, accepted that, while they’d made a healthy profit, they’d handed over a huge percentage in exchange and account fees.

Income: This one’s a counterbalance to time and trading fees. If I have a $100,000 portfolio that generates $10,000 in income every year, that’s a massive factor in my overall performance and returns. While my trading account only shows me my capital gains on an investment, my portfolio tracker shows me my total return including dividend income — and breaks down how much of my return constitutes income versus capital gains.

Taxation: Now this one’s a little different. But the reality is — especially for those of us investing with a view to financial independence or early retirement — we must pay a significant percentage of our profits to the government when we sell out of investments. This is important to consider when you’re assessing what you’ll gain from buying and selling stocks. It doesn’t impact your portfolio performance per se, but it does massively impact your financial outcome as you draw down or completely exit a portfolio.

(FYI: Navexa provides automated CGT and income tax obligation reports, plus an Unrealized Capital Gain report to help you assess and forecast your portfolio’s taxes.)

Currency gain is also important, but of course not all of us invest beyond our home markets. In Australia, in fact, the majority of investors doesn’t stray beyond the ASX, although this is gradually shifting as more services arrive to facilitate offshore investing through new platforms and apps.

Another point here is that Navexa’s portfolio performance calculation is money weighted. That means it accounts for inflows and outflows of cash in your portfolio. This is because the reality for many of us isn’t as simple as making an initial investment and leaving it alone. Rather, we buy and sell as we go.

A money weighted return is different from a time weighted return, which doesn’t account for cash inflows and outflows.

Navexa portfolio tracker

How Navexa Tracks Your Portfolio’s Performance With Automated Accuracy

When I set out to build Navexa, I just wanted a tool that would save me having to combine the data in my trading account with my own manual calculations in order to work out my true portfolio performance.

I — like many of the Navexa community — am a long-term, buy-and-hold investor to whom strong, annualized returns matter more than eye-grabbing one-off gains.

I’ve been learning about money and wealth creation for a long time. Everything I’ve learned has taught me it’s far better to work with hard data than skewed or incomplete information about a portfolio.

This is why the Navexa Portfolio Tracker, today, is one of the leading portfolio tracking platforms in Australia. We calculate annualized portfolio performance that accounts for all the factors I mention above.

Once you load your portfolio into Navexa, you start seeing true performance over the long term. You can see at a glance your capital gains, currency gains, investment income — all net of your trading fees.

You can run comprehensive tax reports with a couple of clicks. You can track & analyze more than 8,000 ASX & US-listed stocks and ETFs, plus cryptos, cash accounts and unlisted investments (like property).

And, you can go even deeper, running reports like Portfolio Contributions, which shows you in chart form which of your investments are boosting (and which are dragging down) your overall performance.

Like I said, I’m biased, since I started Navexa. But I wouldn’t have had to — and thousands of satisfied members wouldn’t be tracking with us — were it not for my trading account failing to provide a full and clear picture of my portfolio performance.

Trading accounts are for trading. Navexa is for portfolio tracking. If you’re doing the former, you should, IMHO be doing the latter, too.

Happy tracking — create an account here (zero obligation & no credit card required!).

Categories
Financial Technology Investing

How Trading Fees Impact Long-Term Portfolio Performance

Many investors are not aware that trading fees can impact their long term portfolio performance. When you consider that 50 trades a year at $20 a trade becomes $1,000 in fees, you can see how trading fees can become a substantial part of your investment costs.

This post discusses what trading and other brokerage fees are, some common strategies for minimizing their impact, how to calculate the true cost of buying stocks of ETFs, plus a couple of other key ideas around factoring trading fees into a long term investment strategy. 

It might be tempting to ignore trading fees and focus only on your nominal gains — the current price of an investment relative to the price you bought it for. But doing so leaves out a key part of the picture.

Many people assume that a flat rate trading fee is enough to cover all their costs. But this isn’t strictly true. Going back to the 50 trades a year at $20 example, on a $50,000 portfolio, the fees equate to 2%. Were you to make 100 trades, that would jump up to 4%. 

And that’s just talking about commission on buy and sell trades. It doesn’t take into account other brokerage expenses, like account fees or inactivity fees, for example. Nor does it account for other potentially significant factors, like currency gains and losses.

We’re going to walk you through trading fees — from the basic principles and current market prices in Australia and beyond, to a few specialist examples of trading fees in action. We’re especially going to focus on understanding how these necessary (for the most part) expenses impact long term portfolio performance — which is your actual, ‘real money’ returns as opposed to the nominal gains you might be used to seeing in your brokerage account. 

Plus, we’ll show you how Navexa — the portfolio tracking & reporting platform hosting this blog — helps you automatically calculate your portfolio’s true performance net of trading fees and other factors that impact on returns. 

index funds

Back to Basics: What Is A Trading Fee?

Strictly speaking, trading fees are themselves just one type of brokerage fee.

A brokerage fee describes the various fees you’ll pay to buy and sell stocks through a trading platform or stock broker.

These break down into trading and non-trading fees. The former means charges you’ll need to pay associated with a given trade. That could mean broker commission, margin rate (for borrowed capital) or a currency conversion if you’re trading, for example, US stocks through an Australian portal.

The latter refers to other costs associated with your investment account, for example account opening fees, inactivity fees and so forth.

Trading fees will be calculated either as a percentage of an order’s total value, or as a flat fee (often applying to a range of values, like $20K-$50K, for example).

Generally speaking, the more complicated your investment strategy, and the more different types of assets you invest in, the higher your brokerage fees may become.

Mutual funds, options, futures and other more complex asset classes will probably carry unique fees and fee structures, too.

A mutual fund is often judged in part by its expense ratio. This is the percentage of assets (money) the mutual fund consumes in expenses. You can think of your own portfolio’s investment costs in similar terms — by considering your expense ratio, just as you would a mutual fund.

OK, so given that fees exist and can’t be avoided if you’re investing in the markets, let’s look at how they affect an investment portfolio.

Types of Brokerage Fees

  • Trading fees: Costs associated with making a trade.
  • Non-Trading fees: Costs associated with the administration of having a trading account.

The Impact Of Fees On Long Term Portfolio Performance

Take, for example, a 10-year investment strategy.

The investor creates a portfolio with 50 different stocks, ETFs and mutual fund holdings in it.

Each trade, on average, costs $20 — that’s buying and selling.

That’s $1,000 worth of fees in the first year, provided they don’t sell anything.

Every year, the investor adds to existing positions, sells out of underperforming ones, and enters new positions as they shift their capital around trying to optimize the portfolio. But let’s assume the total number of holdings remains at 50.

Let’s say they make a further 50 trades a year — another $1,000 in fees. Over the 10 year period in this example, that’s $10,000. And when it’s time to sell out and collect the cash they’ve (hopefully) earned as their portfolio’s total value has appreciated over that time… that’s another $1,000 for all the sell trades on the 50 holdings at the end of the period.

The impact of fees? $11,000.

If the portfolio had started with $50,000, and we assume a 100% total return over the 10 years (that’s a 7.18% annualized return), the investor has, on paper, doubled their money. Hooray! Right? Not quite.

We haven’t factored the $11,000 in fees into the equation yet.

The portfolio started with $50,000. Ten years later, it was worth $100,000 — a $50,000 ‘gain’ if you don’t look beneath the surface numbers. Minus the $11,000 in fees, that $50,000 ‘gain’ comes down to $39,000.

So that 100% gain comes down to 78%, and the 7.18% annualized return across the decade comes down to 5.94%.

If these numbers are confusing, bear with me. Here’s a couple more that show the impact of trading fees on this theoretical portfolio’s long-term return (remember, nominal ‘gains’ aren’t a real measure of performance).

  • The trading fees in this case dragged the dollar return of the portfolio down 22%.
  • The fees account for a 22% loss in total percentage gain across the life of the portfolio.
  • The portfolio’s annualized performance suffered 17.2% thanks to the fees.

This, in a nutshell is why you need to care about trading fees in the context of assessing your portfolio performance. While it might be more comfortable to write them off as a necessary expense, you risk giving yourself an inflated and unrealistic idea of your true portfolio performance.

In the example above, we’re only talking about a $100,000 portfolio value and $11,000 in fees. For multi-million-dollar portfolios — especially those comprising large numbers of trades and complex investments which may carry higher fees — the impact could be far more significant.

So let’s look at common ways investors try to minimize their trading fees impacting their portfolio performance.

Impact of Fees of Hypothetical Portfolio

  1. 100% ‘nominal’ gain actually a 78% real return
  2. Annualized return drops from 7.18% to 5.94%
  3. 22% total impact across portfolio’s 10 year timespan 
  4. 17.2% impact on annualized performance
management fees

A Couple Of Strategies To Reduce The Effects Of Trading Fees

Given the fact that brokerage fees can eat into your returns and performance, it follows that to maximize your performance, you should aim to minimize fees.

How do you do this?

Firstly, avoid the most costly mistake of all; being ignorant not just to the necessary existence of trading fees, but of their undeniable (if easy to ignore) impact on your portfolio.

Rather than turning a blind eye to trading fees and focusing only on your nominal gains, it’s far better to arm yourself with knowledge. This is the first step of any fee-minimization strategy.

Secondly, there’s a general rule you can apply to your investing strategy:

Generally speaking, more trades = more fees.

Morningstar reports that investors pay about three times as much in fees when they invest in an actively managed fund as opposed to an ETF.

‘Actively managed’ here means that the fund managers execute plenty of trades in their pursuit of optimal performance for the fund. And guess what? These plenty of trades generate plenty of fees, which get passed on to the fund’s investors.

The same applies to self-directed investing. I have a friend who’s invested in cryptocurrencies. Over about the past five years, she’s traded in and out of different crypto assets as she’s hunted for mythically massive returns, not paying any attention to how much each trade was stinging her in fees.

She’s like an actively managed fund, always making moves as she chases gains, not thinking about her expense ratio!

I convinced her to load her trades into Navexa and we saw very quickly that had she just parked all her money in Bitcoin from the beginning, not only would her capital gains be more impressive (turns out plenty of those sh… smaller crypto assets didn’t go to the moon, crazy right?), but her fees would have been drastically lower.

If you go back to the example I made earlier in this post, 50 trades a year at $20 a pop is of course going to cost you more than doing half that.

Those are two general tactics for minimizing trading fees. There are plenty of others.

Another benefit of being aware of fees and how they’ll impact a portfolio is that you might be better informed when choosing who to trade with in the first place.

With the explosion of low or no-commission trading platforms in recent years, you’re more spoilt for choice when it comes to choosing a broker that’s not going to eat too much of your performance in fees.

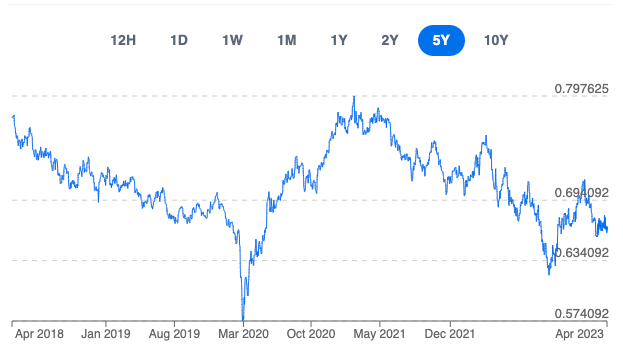
While a $10,000 trade costs $29.95 with ANZ, the same trade could cost you a third of that with some of the newer, more competitively-priced platforms.

Knowing the different brokers’ fee structures inside out is a smart way to assess which will suit you best, since you can extrapolate your trading history to get an idea of exactly what the impact of a given broker’s fees might be.

Takeaways

  • Build your knowledge of fees and fee structures rather than ignore them
  • Consider the extent to which your stock or fund investing could be more passive and potentially generate fewer fees
  • Look at fee structures and your unique investing behaviours when comparing & choosing a broker

What Is A Round Turn Trade And Why It’s Important To Understand Before You Make Trades In Your Account

You might have heard of the term ‘round turn trade’ or ‘round trip trade’.

This is a central idea you should grasp before charging into an investment strategy.

It refers to an investment’s total lifecycle. As we mentioned above, paying the trading fee when you buy a stock is only half the story. You’ll pay again when you sell, too.

The phrase is most commonly used in futures trading, but it applies to regular investing, too.

Say you buy $2000 worth of shares and your trading fee is $20. You sell them at $2500 a year later, incurring another trading fee. Your ‘round trip’ investing in this stock has cost you $40 in fees.

The $500 capital gain is really a net $460 gain — 8% lower net of fees.

Of course, if you’re investing and trading in Australia, your round trip doesn’t end with selling out of a position.

In this example, you’ve earned a capital gain, so you’ll (probably) need to pay tax on that, too.

Taxation isn’t a trading fee per se, but in the context of thinking about your portfolio’s round turn or round trip, it’s important to remember all the factors that will impact your returns.

How To Calculate Your Own Personal Cost Per Trade

Another useful way to incorporate your understanding — end expectation — of fees into your investing is by factoring fees into your trading costs.

Keeping with the previous example, you’ve bought $2,000 worth of shares (call it 500 shares at $4 each). But the cost of buying those shares is really $2020 when you include the fee. When you sell out of the position, you get $2460 back, net of fees.

So while in your trading account it may look like you put $2,000 in and got $2,500 back, those are really just nominal figures that reflect the value of your position at the beginning and end of the trade.

Your real money, round trip start and finish numbers are different.

Not by much, in this example, but still statistically significant — especially when you apply this method across large, long-term portfolios with hundreds or thousands of trades, and other trading and non-trading fees associated with managed funds, margin trading and other potentially costly investment types.

Why Do Some Brokers Have Lower Commissions Than Others, And How Does That Affect Your Investment Returns?

Some call it the ‘Robin Hood effect’, others the ‘race to zero’. However you characterize it, competition in the low or no-fees brokerage space has become hotter than ever.

What began with newer, online-only brokers trying to break into the market and compete with the huge, established players has now embroiled pretty much the whole stock broking space in fierce price wars.

RobinHood, SelfWealth, STAKE and myriad other players in the market have forced the established brokers to compete on price and/or justify their costs with new and more sophisticated product offerings.

Check out our CommSec review to learn more about Australia’s largest broker and the fees it charges.

This ‘race to zero’ is part of a much bigger trend. According to a paper from Columbia Business School, quoted here:

The huge change for [trading costs] really came about in 1975 in what people now refer to as May Day. That’s when the regulators abolished fixed-rate commissions.

‘Before May Day, it cost the same amount per share to trade 10 shares as it did to trade 10,000 shares. The brokers would make out like bandits, taking their 2% or so from each trade. I’ve seen estimates that show trading costs have fallen around 80-90% since 1975.’

In other words, it’s never been as cost-effective to invest in the markets as it is today. The rise of online-only trading platforms, micro-investing and the broader mobilization of a new generation of investors means you can now minimize the impact fees have on your portfolio performance more than ever.

Especially if you approach your investing with the correct knowledge and strategy.

Resources to Learn More About Trading Fees

Navexa portfolio tracker

Navexa Helps You Track Your True Portfolio Performance Net Of Fees

Hopefully, you’re one of those who wants to track your portfolio’s true performance, net of fees, so that you can understand what your real returns are as opposed to the nominal ‘gains’ others might settle for.

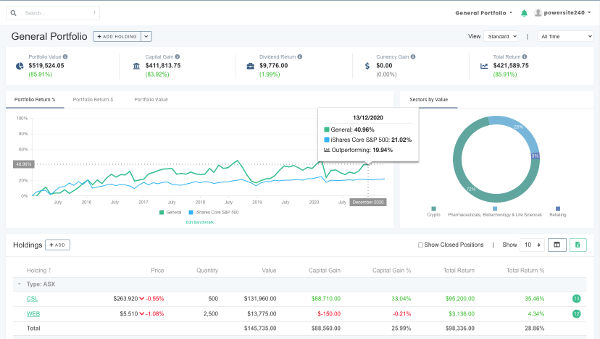
If that’s you, we have good news. We’ve created the Navexa Portfolio Tracker to show you your true, annualized portfolio performance net of fees, dividend income, and currency gains & losses.

Whether you’re a relatively passive investor happy to let a managed fund grow your wealth for you (despite potentially higher fees), or you’re taking care of your own research and investing decisions on a stock-by-stock basis, you’ll see your portfolio as it really is in our easy-to-use platform.

You can track, analyze and compare every stock and ETF across the ASX, NYSE and NASDAQ across multiple portfolios.

Plus, you can drill down into the data to more clearly see the trends that matter — which stocks are performing the best (and worst), which holdings are earning the most (and least) income for you, and lots more.

You can test Navexa’s true portfolio performance tracking tools and reports for 14 days free.

Start your trial here!