The Portfolio page is your main dashboard to see your portfolio’s overall performance.
There’s a lot of information displayed here. The two screenshots below are numbered with the feature explanations listed below.
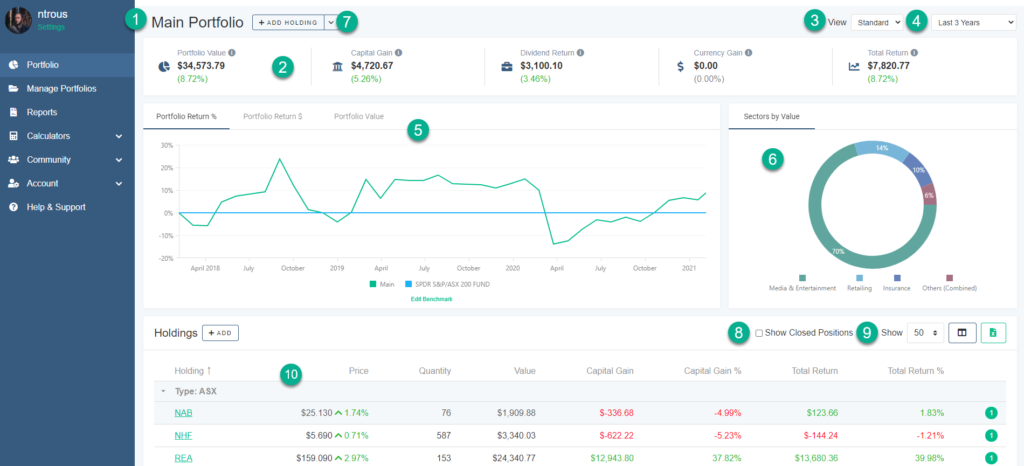
1. Portfolio Name: This shows which Portfolio you are currently looking at.
2. Performance Summary
This section shows five things:
- Portfolio Value: The overall value of the portfolio and overall return percentage for the selected time frame.
- Capital Gain: This shows the portfolio’s capital gains — not including dividend returns.
- Dividend Return: The dollar value and percentage return of dividends your portfolio has generated in the given time frame.
- Currency Gain: The dollar value and percentage return of gains generated through currency fluctuations for the given period.
- Total Return: The dollar value of your returns for the given period (the percentage value here will match that under Portfolio Value).
3. View Selector: Use the dropdown menu to change which view you would like to see; Standard, Trading or Compact.
4. Date Range Selector: Use the dropdown menu to select a timeframe between ‘Today’ and ‘All Time’.
5. Portfolio Charts: You have three options for viewing your portfolio performance charts.
- Portfolio Return %: This chart shows the total return in % for the selected date range.
- Portfolio Return: This chart shows the total return dollar value.
- Portfolio Value: This chart shows the total portfolio value in dollar terms.
6. Sectors By Value: This graphic gives you a visual representation of which market sectors or asset types account for which fraction of your portfolio’s total value.
7. Add Holdings Button: Click here to add holdings to your portfolio — you can also click the button next to your portfolio name (1), or select the Portfolio File Uploader from the dropdown menu next to it.
8. Toggle Show Closed Positions: Check or uncheck this box to change whether your portfolio page displays returns from closed trades.
9. Holdings List Options (highlight the 3 buttons): Here you can select how many holdings to display in the list below, which columns you want to see, and generate an instant Excel spreadsheet of your holdings list.
10. Holdings List: A holding by holding list of everything in your portfolio, showing latest market price, quantity, capital gain percentage and total return in dollar and percentage terms, plus a green notification button on the right (9) indicating unconfirmed dividends.
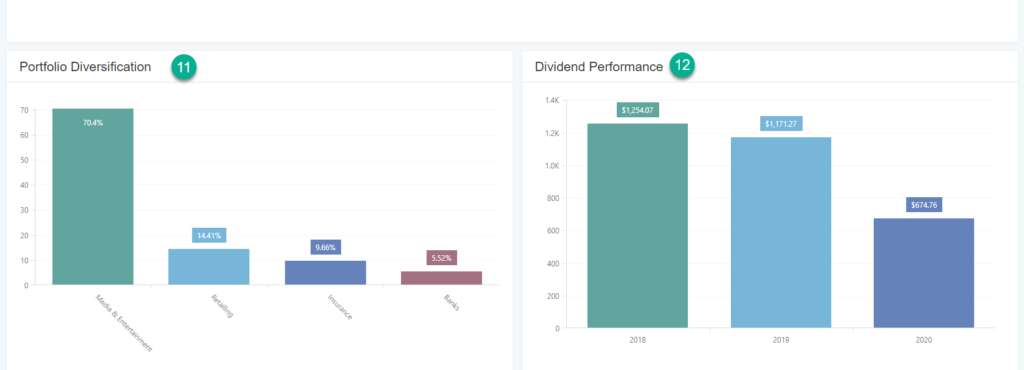
11. Portfolio Diversification: This bar chart displays your portfolio’s diversification for the selected time period.
12. Dividend Performance: This bar chart shows you the relative amounts of income your portfolio has generated each calendar year.