Our TD Ameritrade review covers key pros and cons of trading with one of North America’s most powerful platforms, how to open an account, transaction fees, how to use the variety of research and education tools on offer, and more.
Welcome to our TD Ameritrade review. This (rather long) article dives deep into the TD Ameritrade platform to give you a clear picture of the service’s extensive history and details on:
- The TD Ameritrade platform, service and offerings
- How to open your own TD Ameritrade account
- Pros and cons of using TD Ameritrade
- How to decide whether TD Ameritrade might suit your investment needs
- And more!
As one of the largest online brokerage platforms on the planet in its own right, TD Ameritrade was acquired in October 2020 by Charles Schwab.
This huge merger with Charles Schwab will probably take several years to complete. So, for now, we’re reviewing TD Ameritrade as a standalone platform.
If you’re investing in stocks, mutual funds, options or even Bitcoin futures contracts, TD Ameritrade has a variety of services you might find useful.
The best way to describe the trading platform is as a full-service investment services provider.
Whether you’re just starting out as an investor, or you’ve been in the markets a long time, or even if you’re running an investment fund or managing client’s portfolios, TD Ameritrade is a powerful, far-reaching trading platform that offers products and tools that will likely support you in your investing mission.
The service isn’t just focused on facilitating trading and investing. Like CommSec, TD Ameritrade has invested heavily into the education and guidance side of its service. Chatbots, seminars, articles, slideshows and other educational content and tools are packed into the platform to enable investors of all levels to learn and improve.
TD Ameritrade even offers a virtual trading simulator so you can practice trading with a notional $100,000.
We’ll come back to these features later in our review. Plus, we’ll walk you through opening an account, using the platform, potential pros and cons of using TD Ameritrade and more.
Also, we’ll show you how using this powerful portfolio tracker alongside your TD Ameritrade (or other) trading account can enhance and enrich your understanding of your investment portfolio’s true performance.
What Is TD Ameritrade And What Do They Offer
TD Ameritrade traces its history back to 1975, when four partners opened First Omaha Securities, Inc. in Nebraska.
In 1983, that became Ameritrade Clearing, Inc. Five years later, they introduced the first telephone trade order system. In 1995, they became the first to offer electronic trading.
From there, the group acquired multiple businesses to become a digital-focused trading service. The ‘TD’ in their name comes from their 2006 merger with Toronto-Dominion Bank’s US brokerage business, TD Waterhouse.
TD Ameritrade’s tech focus continued. They are the first company to advertise on the Bitcoin blockchain. As of October, 2020, they’ve been acquired by another huge North American brokerage, Charles Schwab Corporation. Whether the Charles Schwab merger changes much about the platform remains to be seen.
TD Ameritrade offers its electronic trading platform for customers to trade stocks (common and preferred), futures, ETFs, cryptocurrency, foreign exchange, options, mutual funds, fixed income investments and even carry out margin lending.
The company has more than $1.3 trillion on its platform across about 11.5 million accounts.
On average, it supports nearly 900,000 transactions every day and generates approximately $6 billion a year.
The platform offers a large range of services and access to a many different types of investments.
There’s the TD Ameritrade platform itself and the sophisticated active trading service they acquired in 2009, thinkorswim.
Both these sides to the platform are available on web and mobile.
TD Ameritrade offers a large variety of account types.
TD Ameritrade Account Types
- Standard accounts
- Retirement accounts
- Education accounts
- Specialty accounts for trusts, partnerships and more
- Managed portfolios
- Margin trading
Depending on your account type, you’ll have access to a wide range of investments across the web and mobile platforms.
While you can’t directly trade cryptocurrencies (only Bitcoin futures), you can trade pretty much everything else.
What You Can Trade on TD Ameritrade
- Stocks (long and short selling, plus over-the-counter penny stocks)
- Mutual funds (nearly 2,000 of them)
- Bonds (corporate, municipal, treasury, contracts for difference, plus international fixed income and even junk bonds)
- Options
- Futures
- Foreign exchange
- Unit investment trusts
Also central to the TD Ameritrade offering is that, unlike some other ‘traditional’ brokers, they’ve recently moved to a low or no-fees model. In 2019 they reduced most of their online trade commissions to zero — meaning you can trade many assets and instruments on the platform for a low fee and pay nothing on your returns.
This brings TD Ameritrade in line with the growing low fees movement driving newer investment platforms into the market.
It also means you can access one of North America’s most powerful investment platforms more cost-effectively than ever before.
So, you’re interested in signing up? Here’s how it works.
How To Open An Account With TD Ameritrade
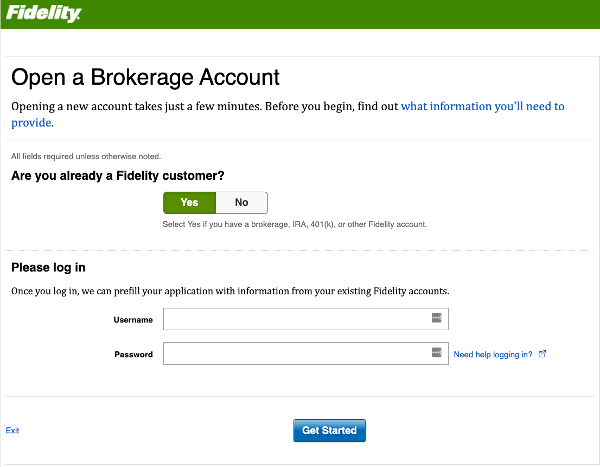
Opening a TD Ameritrade account is about as simple as you’d expect with any major North American broker.
You can expect the standard know-your-customer protocol.
To create an account, you’ll need either you Social Security number or your Individual Taxpayer Identification Number.
Plus, you also need to provide your employers’ name and address.
The whole process should take a few minutes.
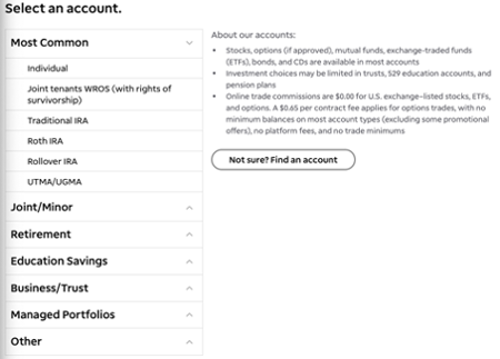
First, you’ll need to select your account type.
The signup wizard provides questions and prompts through the process to ensure you register the right account type for you.
Once you’ve confirmed this, you’ll need to enter your personal information.
Then you’ll need to spend a little time reviewing the technical information and terms of your account. This stage includes selecting how you wish TD Ameritrade to treat your cash account — it can go into either a FDIC-insured deposit account or a SIPC-protected TD Ameritrade account.
You’ll also need to review some IRS-related questions here.
Once you’re satisfied — and they’re satisfied — with your information and selections, you’ll need to create your secure login details for your account.
Once you’ve set your password and user ID, TD Ameritrade activates your account and you’re good to go. From here you can fund your account and start trading. You’ll see your official TD Ameritrade account number once you’ve completed the process.
There’s no minimum amount you need to fund your account with to begin. Though if you’re looking to trade options or do margin trading, they require you to fund your account with at least $2,000.
Pros And Cons Of Using TD Ameritrade
The TD Ameritrade offers an extensive platform that is powerful and — aside from a 2007 hack, in which customers’ details were compromised and circulated on the dark web for several years — largely secure.
TD Ameritrade offers a range of security products, procedures and an asset protection guarantee to protect you from your trading account or personal information being compromised.
As such large trading platform, there are plenty of pros and cons to be debated.
We’ll look at three of each.
TD Ameritrade Pros
Huge array of trading tools and investment options: From the website and mobile versions of both the TD Ameritrade trading platform and its sister active trading platform, thinkorswim, to the number of different things you can invest your money into (from stocks to options and even junk bonds, plus the huge range of mutual funds), the platform gives you a high level of access to the markets. Plus, you have the TD Ameritrade mobile app, and other associated mobile tools.
First-class research and education resources: TD Ameritrade offers you plenty of knowledge in the form of reports, presentations and even an portfolio simulator so that you can progress from beginner to novice, or novice to advanced.
Low fees, high standards: Being one of the more established ‘traditional’ brokers in North America hasn’t stopped TD Ameritrade offering progressive pricing. While you might expect zero fees and commissions from smaller, newer trading platforms like Robinhood, you’ll be pleased to know that TD Ameritrade offers no fees to open an account or trade stocks. They also offer all ETF trades and more than 4,000 mutual fund trades with zero commission.
TD Ameritrade Cons
Information overload: The flipside of TD Ameritrade’s platform being so vast and powerful is that it makes it less than simple for beginner investors or those new to the platform to navigate. With such an array of investments, account types, and a fully customizable trading dashboard packed with information, the chances of overwhelm are high. This may deter you if you’re just looking for a simple platform on which to buy a couple of ETFs.
Occasional outages: The platform had a couple of outages in late 2020, reportedly due to heavy trading volume. This issue apparently prevented users from logging in and/or making trades. This isn’t strictly a con, since even the most robust platforms can suffer occasional outages, but it’s something to be aware of.
No fractional shares, penny stock commissions: If you want to invest in Amazon, but you only want to invest $1,000, you won’t be able to do so on TD Ameritrade. While competitors like Fidelity do cater for fractional share investing, at this stage, Ameritrade does not. Another thing you’ll find is that while many of the platform’s available investments give you zero-fee and zero-commission access, over-the-counter penny stocks do incur a $6.95 commission. And since fees can be a significant factor in your true portfolio performance, it’s important to know this if you’re looking for a trading platform that allows you access to the small and micro-cap end of the stock market.
Intelligent Portfolio Performance Tracking
Track Australian & US trades, cryptos, cash accounts, currency gain, dividend income and more with the Navexa Portfolio Tracker.
The Best Way To Use TD Ameritrade For Your Needs
There’s so many different investment vehicles, account types and tools packed into the TD Ameritrade platform that we’d be here all day if we listed every way you could use it for your needs.
Let’s look the basics of making a trade.
Making a trade
Once you’ve set up your account and moved some funds into it for trading, you’re ready to get started.
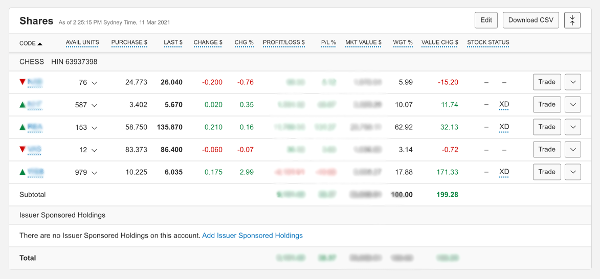
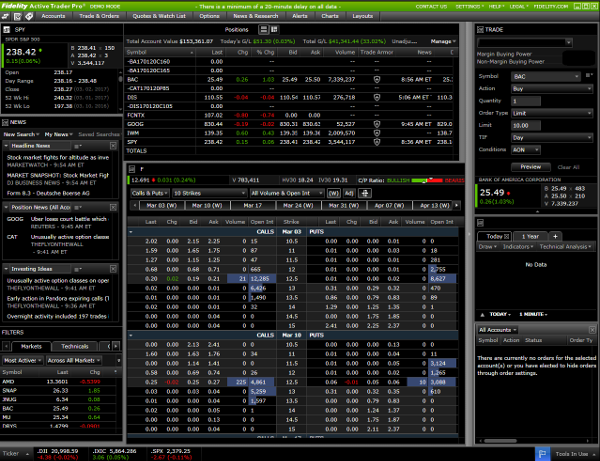
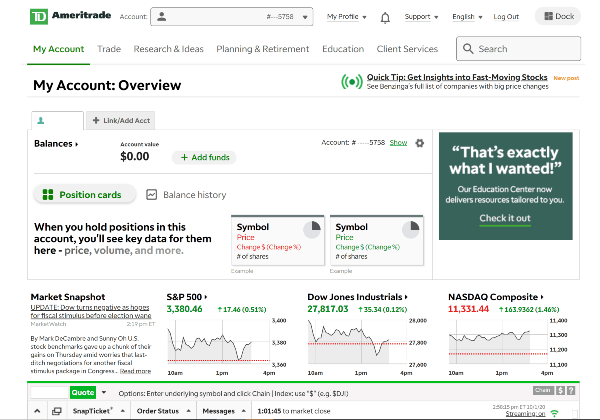
You can see from the screenshot below how much information is on the trading account homepage alone.
To make a new trade, hit the ‘Trade’ button along the top navigation bar.
This will bring up a new screen in which you can select between stocks and ETFs, options and more.
From here it’s a pretty self-explanatory process, similar to most other trading platforms.
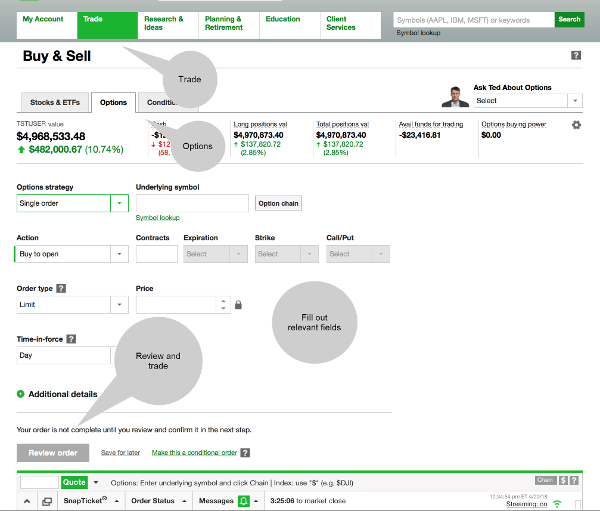
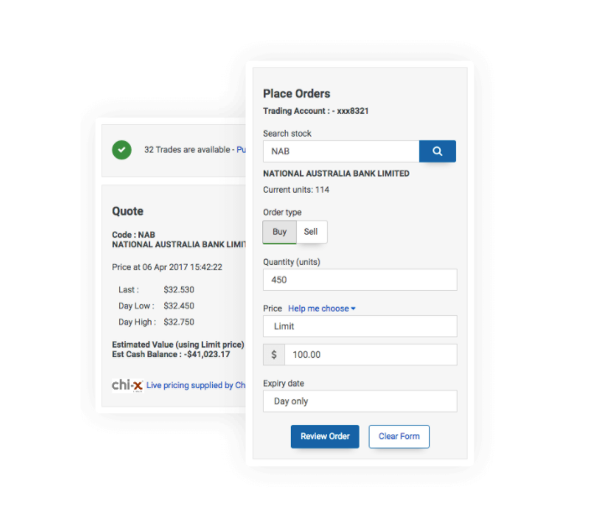
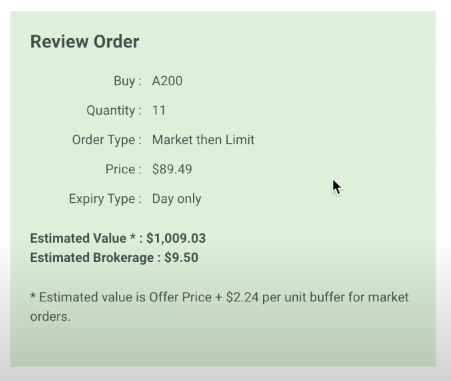
Here’s an example of the options trading screen.
In this example, you look up the ticker symbol and set the various fields to your preference for the trade. Then, click review order. You can also opt to save the trade details for later, which is useful if you want to go away to do some further research before locking it in.
Also near the bottom of the screen you’ll find the SnapTicket. This is TD Ameritrade’s tool for getting quotes and actioning trades. You can open a SnapTicket and it will display no matter where on the platform you navigate.
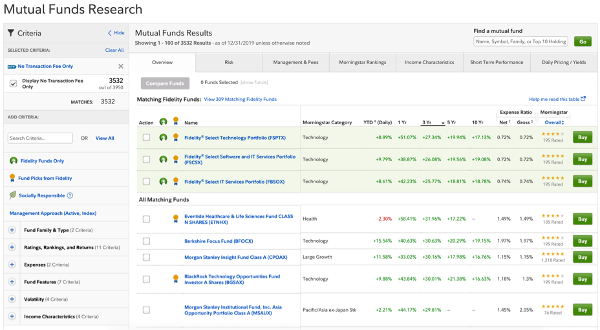
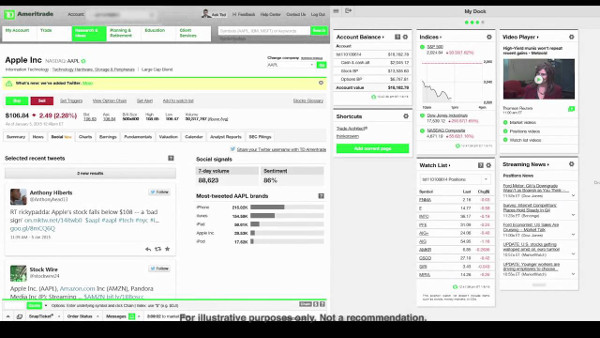
Using TD Ameritrade for Research
As well as being a powerful tool for buying and selling a multitude of investments, the platform gives you an equally impressive range of research tools and resources.
TD Ameritrade’s stock screeners are completely customizable. If you don’t want to customize, you can choose from nearly 100 preset options. You can also access screening tools for ETFs, options, mutual funds and fixed income.
Plus, through both the TD Ameritrade portal and the sister thinkorswim trading platform, you can access a huge amount of calculators, news, charting tools, trading ideas and third-party research from some of the most respected firms in the world.
While there may be a risk of information overload thanks to the sheer volume of data and tools at your disposal, if you know what you’re looking for and you know which information will suit your research best, chances are you’ll find it in the TD Ameritrade platform.
Using TD Ameritrade For Analyzing And Tracking Your Portfolio
If you’re familiar with the importance of asset allocation, you’ll know that buying and selling investments is just a part of a much bigger picture.
Being able to zoom back from stock-by-stock analysis and performance, and focus on your overall, long-term portfolio performance is key to a solid investment strategy.
The platform’s Portfolio Planner tool shows you your asset allocation and allows you to compare that to a target allocation for a theoretical portfolio.
If you have a particular pre-defined asset allocation or portfolio management strategy you’re seeking to follow, you’ll be able to add this into your Portfolio Planner and get specific recommendations on which stocks may be a good fit.
This is a valuable tool — one that goes beyond just facilitating trades and allows you to pair your research and investing with a broader, longer-term strategy.
There’s so much packed into TD Ameritrade and thinkorswim (which deserves its own independent review) that we can’t cover everything here.
Your needs for a trading platform will be unique to your individual goals and risk tolerance. But based on the scale and depth of TD Ameritrade’s platform, its likely you’ll be able to find the right combination of assets, research and tools to fit your investing strategy.
Should You Consider Opening An Account With TD Ameritrade?
According to StockBrokers.com, TD Ameritrade is not only the best overall stock broker in U.S., they also rank first for active trading, tools and platforms, and education.
The platform itself makes the bold claim that by joining, you’ll grow smarter with every trade you make. And going by the amount of account types, investing options, and tools for research and education, you’d have to say that TD Ameritrade is in a strong position to make that claim — provided, of course, you understand how to use these tools and interpret the data and analysis these resources generate.
According to this TD Ameritrade customer:
‘If I started from scratch and had to find a new broker today, these would be the key requirements I’d look for:
- No Minimum Deposit Requirement
- Low Transaction Costs
- Commission Free ETFs
- Great Research Tools
- Easy to Use Trading Platform
- Great Customer Support
- Easy Tax Reporting’
TD Ameritrade, of course, boasts all these. As the customer points out, the quality and depth of the research tools especially would justify paying more in trading fees and commissions than you might with a competitor platform.
But since 2010, TD Ameritrade has — unlike some of the other big, established trading platforms in the North American market — been aggressively generous in its offer of low or no fees and commissions. This is particularly true of their extensive ETF offering.
So on this basis alone, you should consider signing up with the platform since there’s enough tools and resources to support you whether you’re a beginner investor looking to learn about the markets, an advanced trader who’s seasoned at using stocks, bonds, options and leverage, or pretty much anything in between.
But as we’ve touched on in this TD Ameritrade review, the platform and the organisation behind it has either pioneered — or acquired — so many different services for the modern investor that no review is going to be able to cover everything.
But one thing worth mentioning here is TD Ameritrade’s customer support.
According to the customer we quoted before:
‘Help is easy to come by with phone, email, online chat, in person at a local branch, and the easy to use Ask Ted feature… the educational tools available, and the little help center buttons in all the right places… will walk you through the basics.
On top of that, I get a couple of phone calls every year from the local TD Ameritrade branch. They just check in, see if I have any questions, concerns, and how they can help.’
In other words, if you have any issues with any aspect of your TD Ameritrade account, there’s multiple ways you can access support and assistance.
Of course, only you can decide whether signing up is right for your specific requirements.
But, in short, you should consider signing up to TD Ameritrade if:
- You want access to a huge variety of investment vehicles, from regular stocks through to options and margin lending.
- You value in-depth research and educational resources to help improve your financial literacy and skill as an investor.
- You want the support of trading with one of the biggest (and soon, thanks to the Charles Schwab acquisition, the biggest) trading platforms in North America.
- You want to minimize the impact of trading fees and broker commissions on your investment portfolio.
Trading Stocks? Track Them With Navexa
Import your portfolio in seconds. Track your investment performance. Automate your tax reporting & more.
How To Get Started Trading Stocks, ETFs, Mutual Funds, Options, Bonds Or Futures Through TD Ameritrade’s Online Brokerage Services
Whatever level of experience you’re at right now — be it embarking on your investing journey or looking to start making more complex trades with futures and options — TD Ameritrade has gone to great lengths to provide to resources to get you started.
If you’ve never traded a single stock before, this is a good place to start. This is TD Ameritrade’s introduction to the world of stock investing.
Here, you’ll find the basics. From the definition of a stock, introductions to common approaches to investing in stocks, a short glossary covering five key terms you should be familiar with before getting into the market (read a more extensive glossary and explanation of stock trading strategies), to a quick guide on setting up an account, this page is a good place to get started — especially if you already know you want to sign up to TD Ameritrade.
Like we’ve said, though, there’s a massive amount of resources on the platform to support investors of every level in building their financial literacy and understanding of the markets.
If you sign up, you’ll have access to TD Ameritrade’s Immersive Curriculum. This is a free online course that curates a series of courses based on your experience level and account setup choices.
Some of the courses available:
- Simple Steps for a Retirement Portfolio
- Stocks: Fundamental Analysis
- Income Investing
- Stocks: Technical Analysis
- Trading Options
- Options for Volatility
- Weekly Options
- Fundamentals of Futures Trading
This curriculum means that even if you’re not ready to start trading stocks, or options, or futures, or even to start analyzing potential investments using a particular methodology, you can still get great value from the TD Ameritrade platform.
While other brokers and trading platforms might make empty promises about supporting their customers and furthering their knowledge, the same can’t be said about TD Ameritrade. Their resources and support for investors of all levels is extensive and impressive — particular the way the above courses can be tailored to your particular requirements.
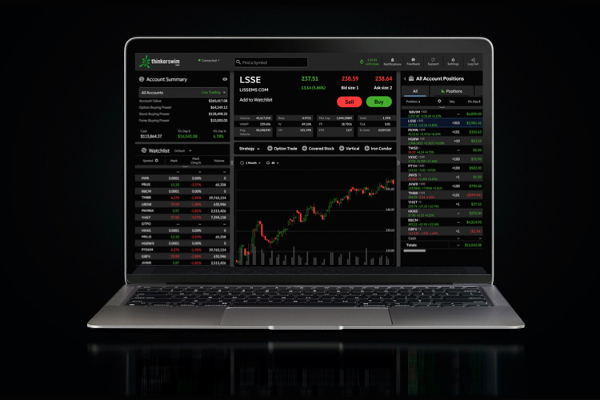
A TD Ameritrade account gives you access to three separate (but connected) platforms. There’s the main web platform for the trading account, the associated TD Ameritrade mobile trading platform, and the elite, active-trader level platform, thinkorswim, which you can see below.
Thinkorswim comes with a downloadable desktop application, a web platform and a mobile app. So really you can access up to five different platforms between TD Ameritrade and thinkorswim.
Another cool feature is that the trading platform app has been optimised for the Apple Watch, meaning you can moniter watchlists, stock quotes and market data from your wrist.
Based on TD Ameritrade’s large list of investment offerings — stocks and ETFS, mutual funds, bonds, options and more (most with low or no fees and zero commission to trade) — and its extensive research and education resources, this platform will probably be a good place to start your investment journey.
In our opinion, any trading platform that invests this much in helping its customers strengthen and deepen their knowledge of investing is worth exploring.
Paired with the scope and power of a platform as expansive as TD Ameritrade, that quality becomes even more beneficial.
Trading With TD Ameritrade? Make Sure You Track Your True Portfolio Performance
This TD Ameritrade review has, we hope, shown you that it’s a platform that can offer investors of traders of nearly every level a powerful suite of tools and resources.
We especially like the asset allocation module, with its model portfolio options and associated investment recommendations.
One area in which TD Ameritrade lacks a little is in its true performance portfolio tracking capability.
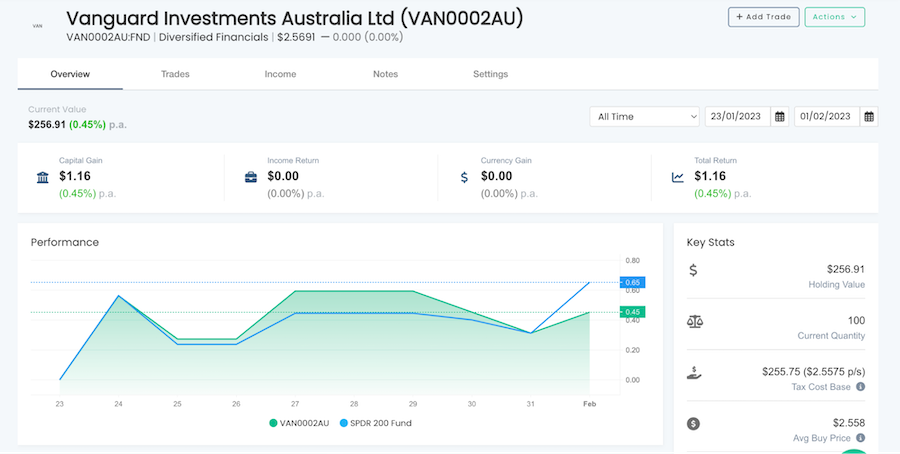
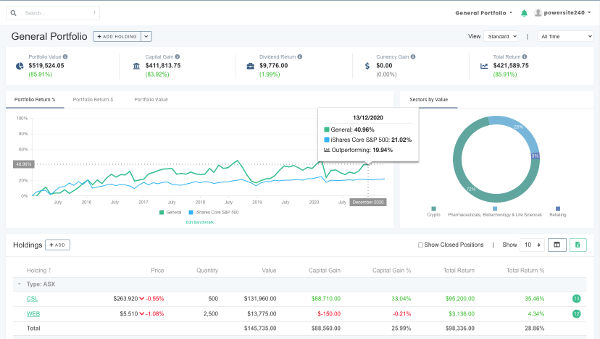
You can, of course, easily see how your investments are performing.
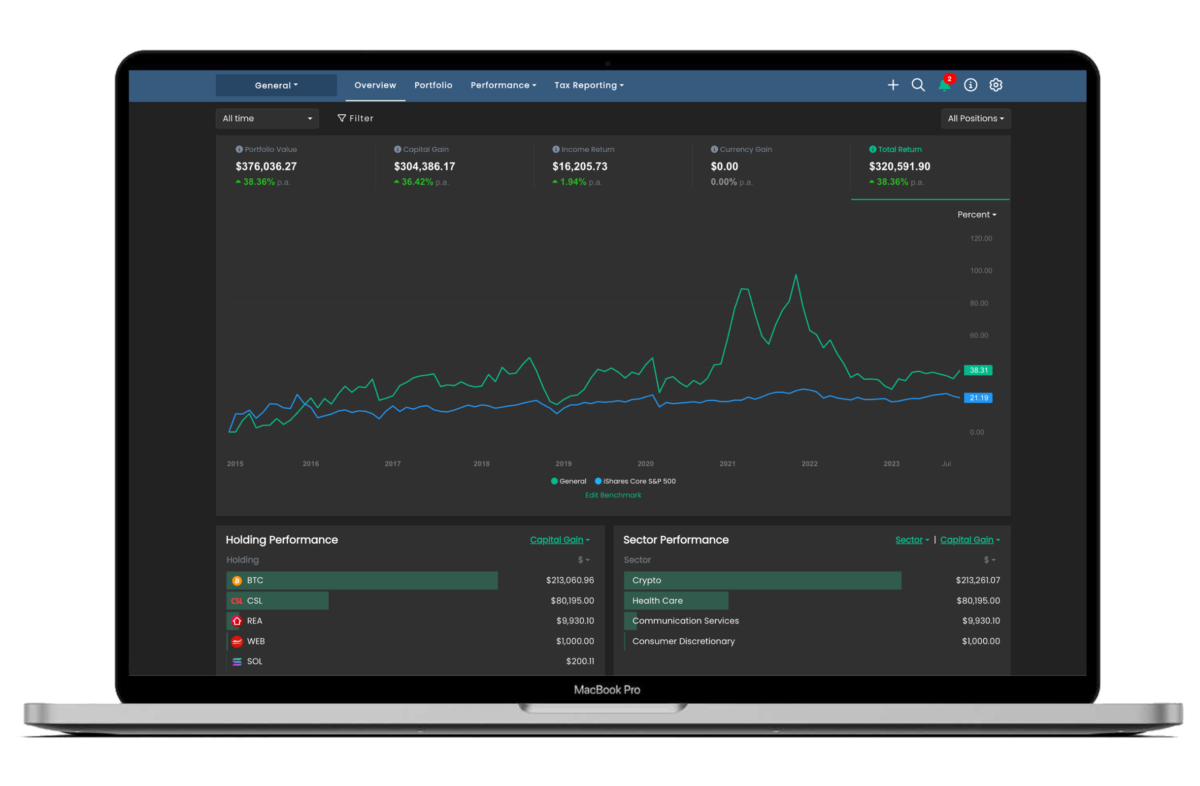
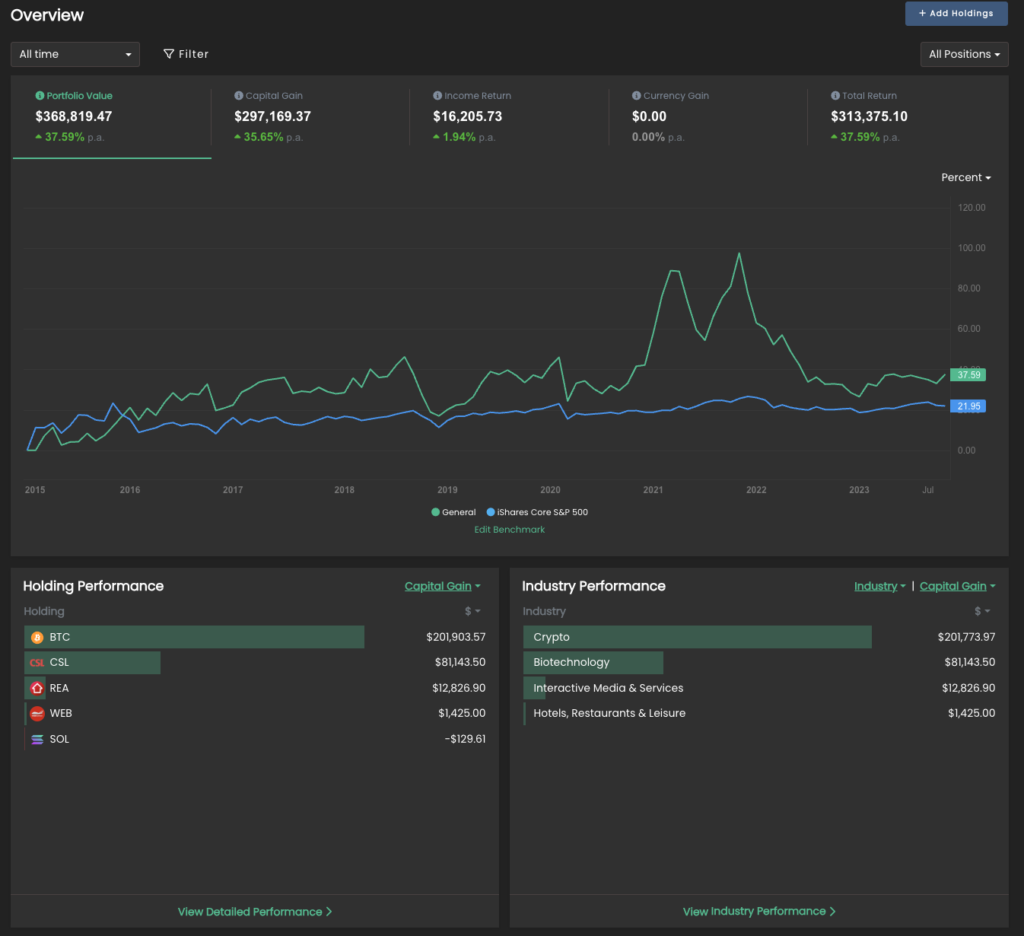
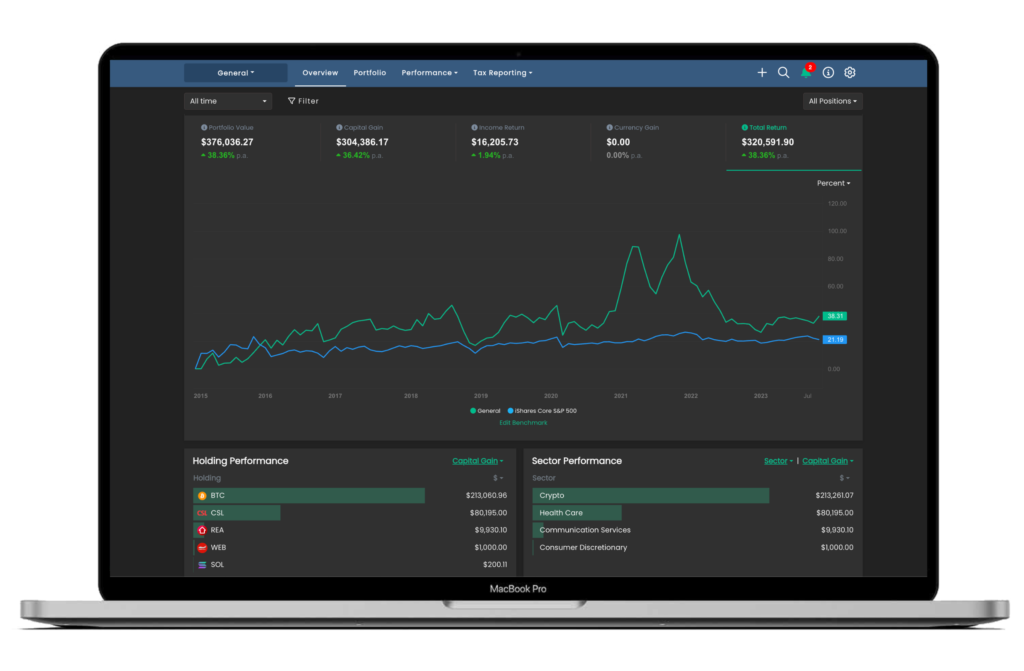
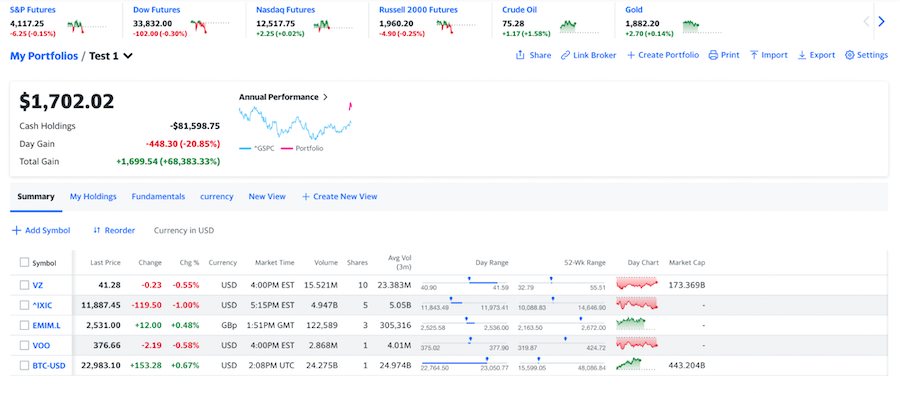
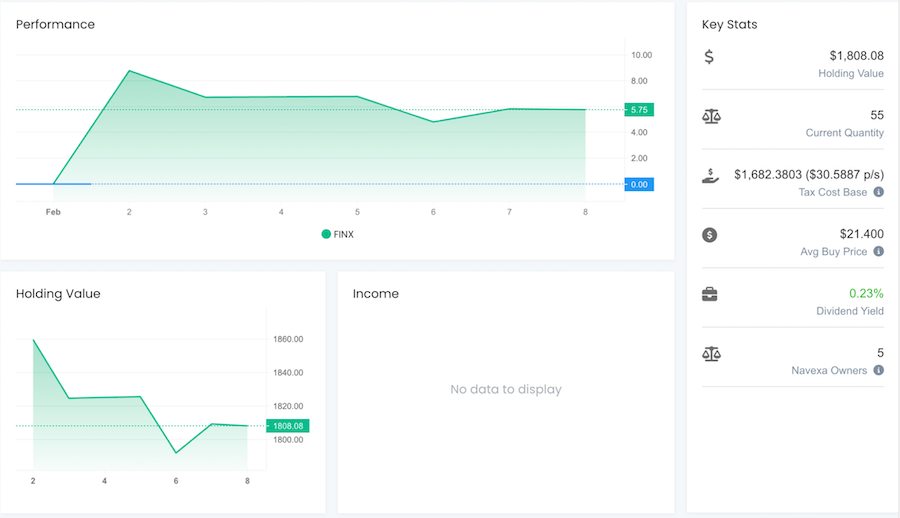
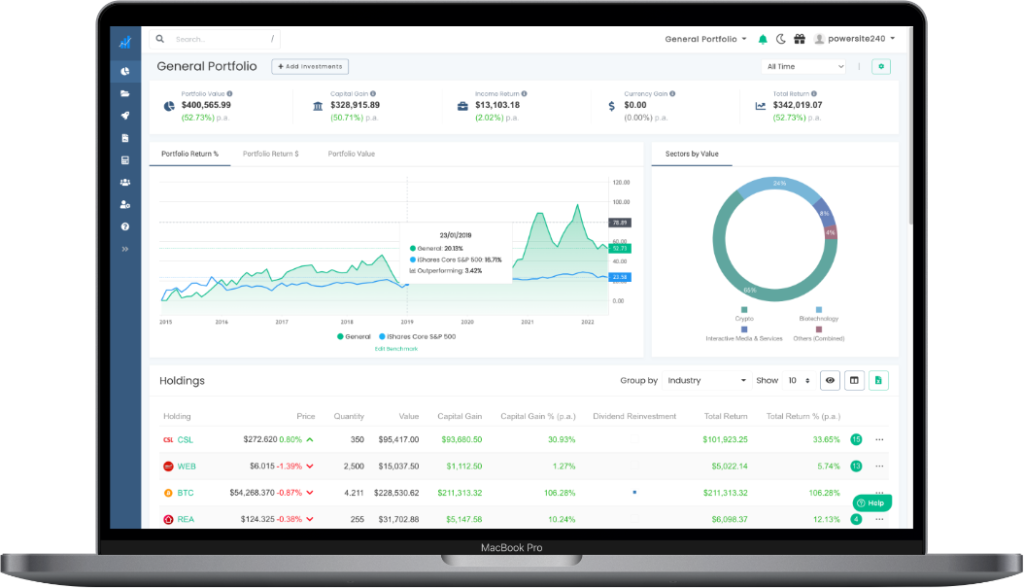
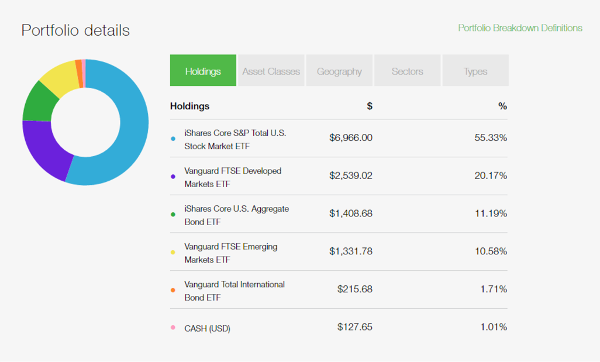
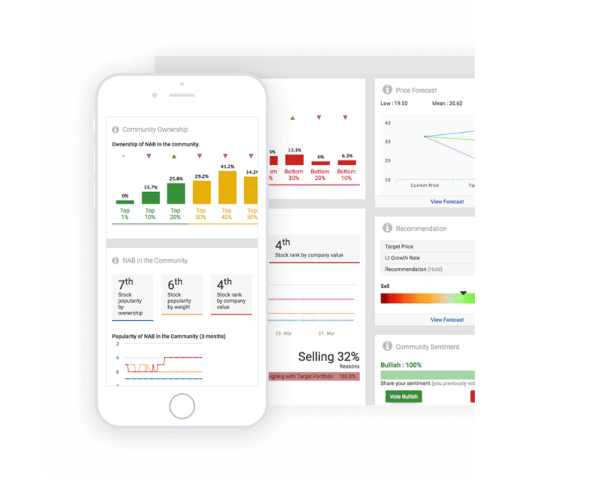
This is what your portfolio looks like in their platform:
In this example, you can see each holding’s dollar value and percentage return. You can also see the relative weighting of each in your portfolio on the coloured pie chart.
For such a sophisticated trading platform, this is a very basic level of portfolio insight.
Let us explain.
The rise of self-directed and so-called ‘democratizated’ investing — in which TD Amertrade is playing a part by offering such valuable trading tools and investment education resources with such a low barrier to entry — has more people entering the market and trying to build wealth.
But what many investors are forgetting — or or just plain aren’t aware of — is that there’s a difference between a portfolio’s gains and its true performance.
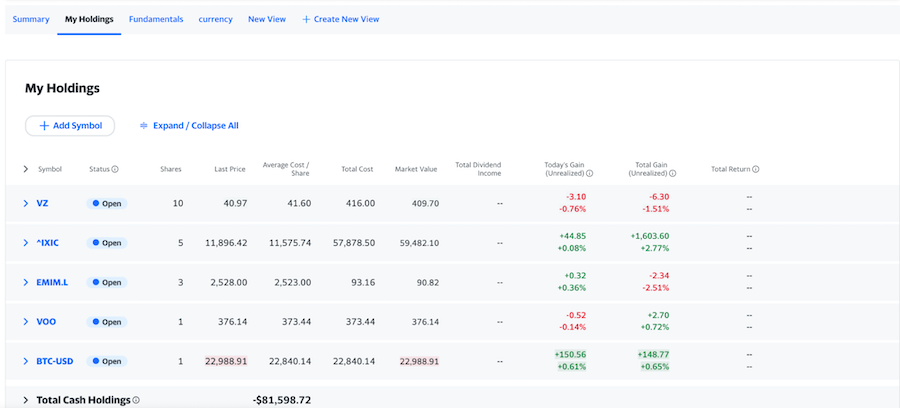
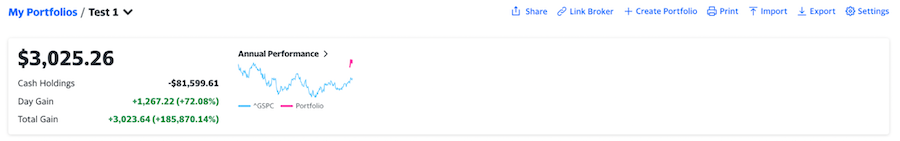
Your trading account often only shows you how much money you’ve put into your portfolio, and how much you’ve gained or lost. You can see in the screen above that there’s no data or metrics reflecting how long those holdings have been in the portfolio.
Consider this. If you had to choose from two investments which would both gain 100%, but one took half the time to do so than the other, which would you choose?
That’s a no brainer. Because when you annualize those returns, the one that took half as long to reach that gain has actually performed twice as well.
This is the problem with the nominal gains and returns you’ll see in a trading account like TD Ameritrade.
They’re only a part of the full financial picture you need to see.
The reality is that time, income, trading fees and other factors play a significant role in determining your real returns and true portfolio performance. This is true for even the smallest, shortest term investment. And it’s especially true for long-term strategies.
Three Things You Should Know About Your Portfolio Performance
Here are three vital things you need to know in order to fully understand the value and performance of a given investment, and your wider portfolio.
1. How much time have you invested to generate a return? Consider that a 100% gain in a year is far more desirable than a 100% gain in five years.
2. How much income have you earned from dividend payments? One stock our founder owns has paid him back 40% of his investment in dividends. This substantially affects how you should view an investment’s performance.
3. How much have you spent in fees? If you’ve been investing for 20 years, making, say 25 trades a year at $20 a trade, that’s $10,000. However much you spend on fees in the course of your trading, you need to factor that in to fully understand your portfolio performance.
If you’re thinking of joining TD Ameritrade, we strongly recommend you sign up with a dedicated portfolio tracking platform like Navexa, too.
We believe that in the most connected and data-rich era of financial history, there’s no excuse for not knowing the exact details of every dollar going into and out of your portfolio.
The truth is that there’s are many more things impacting your portfolio than just whether or not the investments in it have gone up or down this week or month.
This is why we developed Navexa. It’s a portfolio tracker that accounts for every factor impacting your investments — time, income, fees and more.
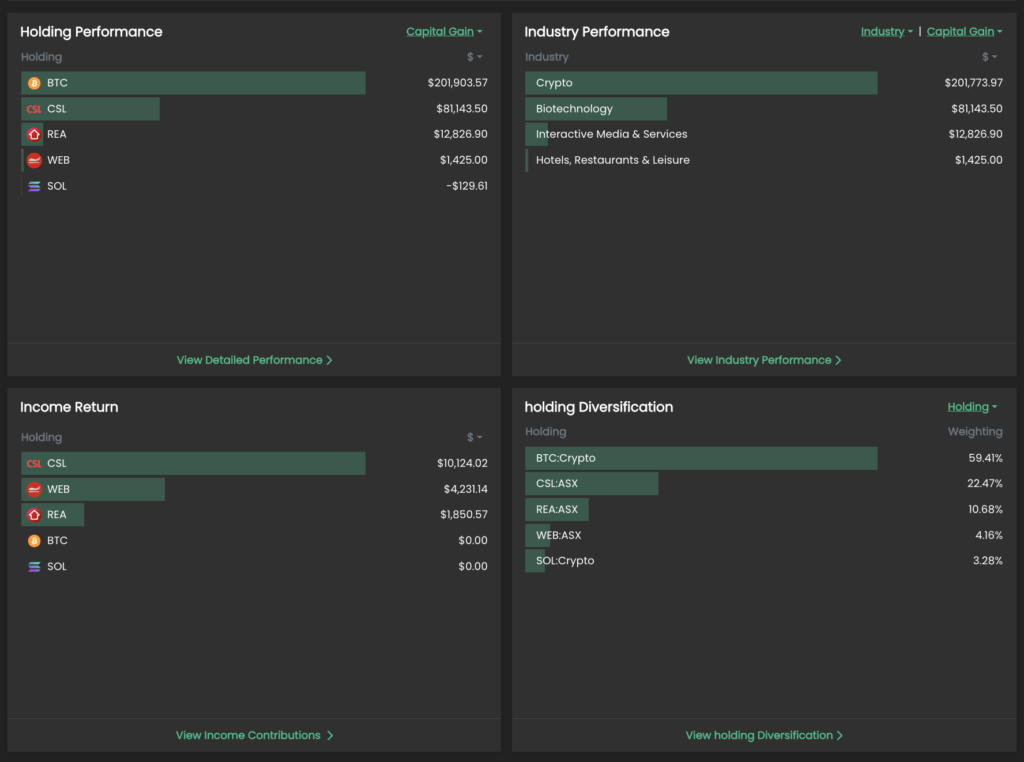
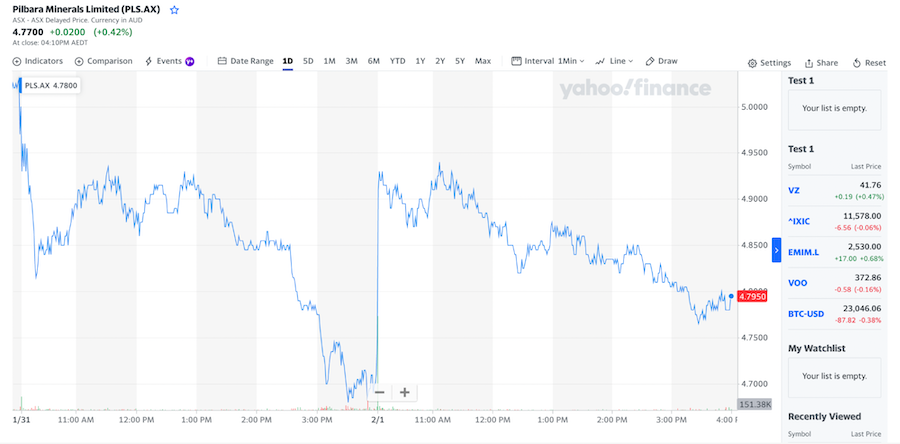
If you’re using a TD Ameritrade account, use a Navexa account to dive even deeper into your portfolio performance data and analyze holdings across the NYSE and NASDAQ.
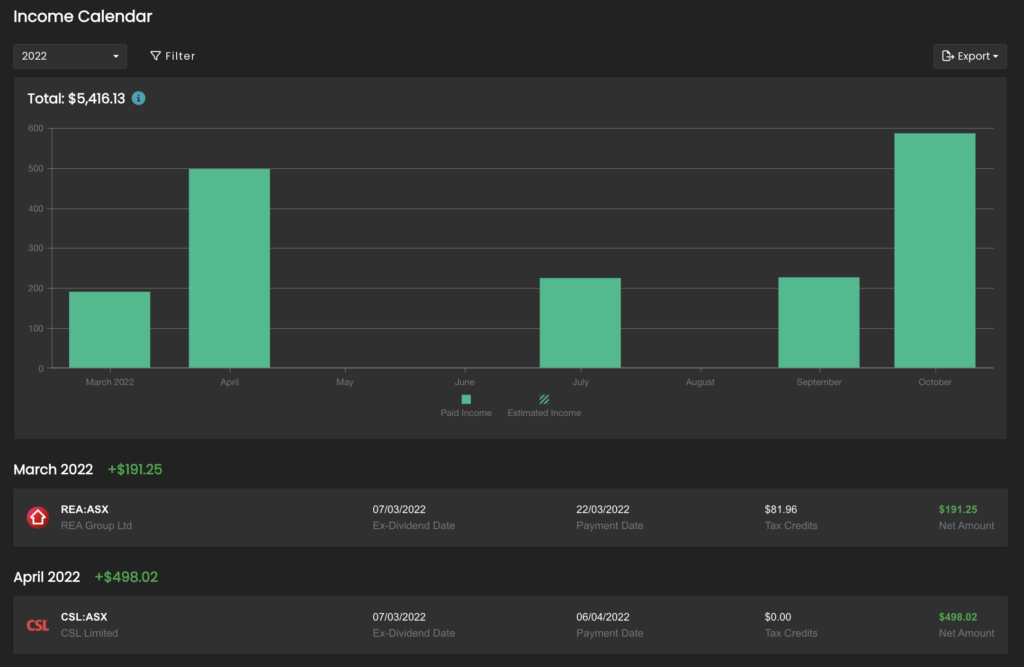
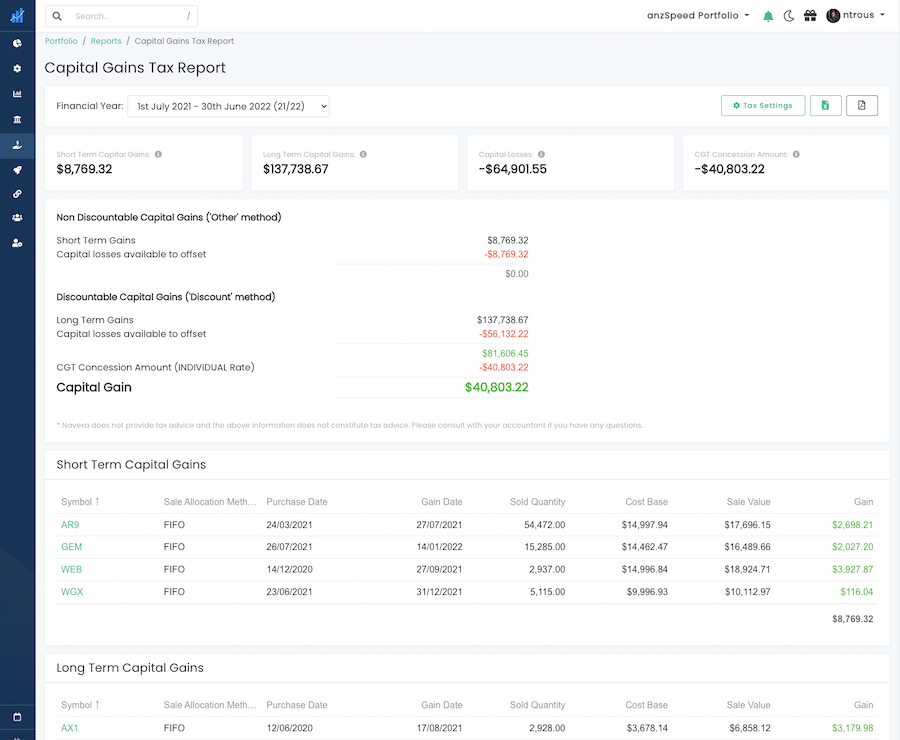
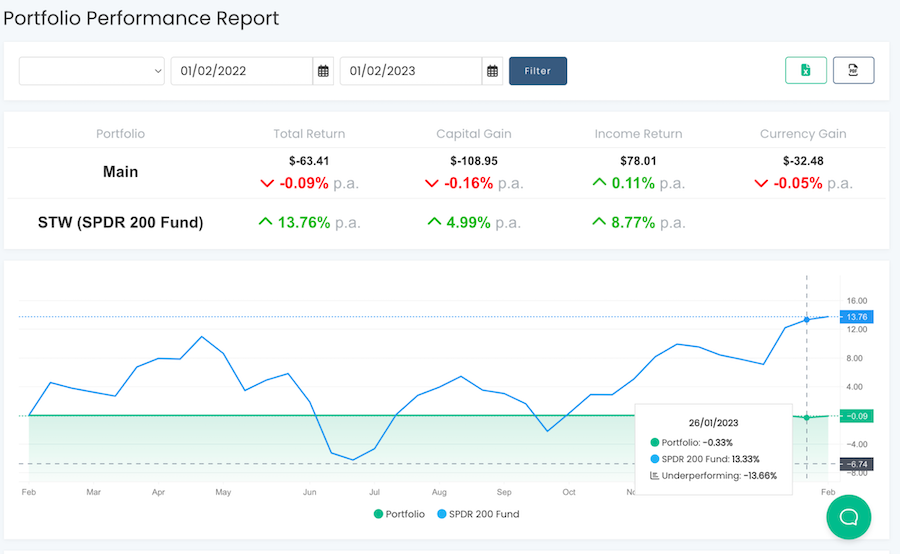
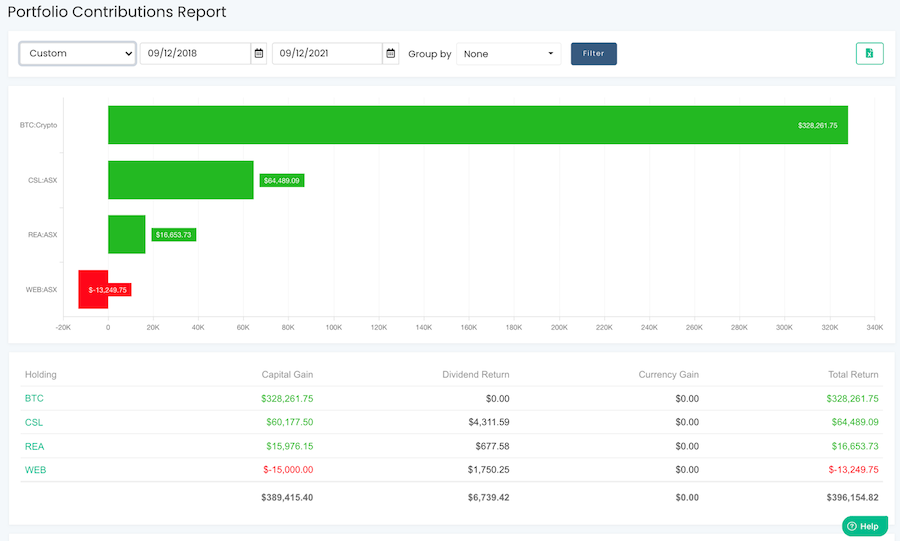
You can generate a variety of reports, including upcoming dividends (great for forecasting what income your portfolio is scheduled to generate), portfolio diversification, portfolio contributions, and more.
Open a Navexa account (free).