Categories
Financial Technology Investing

Fidelity Review 2022: Pros, Cons and How to Trade

Fidelity is one of the largest trading platforms in the world. This Fidelity review looks at the company’s history, the types of investments it supports, different account types, trading fees, pros & cons, and more.

Welcome to our updated 2022 Fidelity review. Fidelity Investments is one of the outright largest asset managers in the world. Their extensive trading platform not only delivers much in the way of investment opportunities and research with zero commission, but also offers you a couple of powerful benefits which you might not find on other trading platforms.

Established just after World War II in Boston, Fidelity today manages about $5 trillion dollars worth of assets plus another nearly $8 trillion in customer accounts.

The firm was the first big American finance company to advertise mutual funds to everyday investors. The renowned fund manager, Peter Lynch, was their Magellan fund manager between for more than a decade and averaged a 29% average annual return — an outstanding performance which remains one of the best in the history of mutual funds.

Fidelity is a huge, multi-faceted organisation which operates not only the brokerage firm and trading platform we’re reviewing here, but also a retirement planning business, a proprietary investing business and other interests alongside its mutual funds operations. They are a giant of modern American personal finance.

Today though, we’re focusing our Fidelity review on the online investing platform. We’re going to dive into what you can expect as a Fidelity customer, the history of the company, the main reasons people invest on this platform, how to open an account and the various account types available.

Our Fidelity review also looks at the top three pros and cons of trading using Fidelity, explains their trading fees model, and explains why trading using Fidelity or any other online broker might not — despite the wealth of third party research and data on display — give you a complete picture of your portfolio performance.

Fidelity review
Fidelity is one of the original U.S. brokers.

What is Fidelity And What Does It Offer Its Customers 

Fidelity is many things. While we’re just looking at the group’s trading platform and brokerage account in this Fidelity review, it’s important to note that Fidelity is a multinational financial services corporation with many different interests.

Fidelity operates:

  • A brokerage firm
  • Several mutual funds
  • An investment advisory service
  • Retirement planning services
  • Index funds
  • A wealth management business
  • Life insurance
  • Securities execution and clearance
  • Custodial services

Fidelity has also been one of the first major brokers to move into cryptocurrency investing.

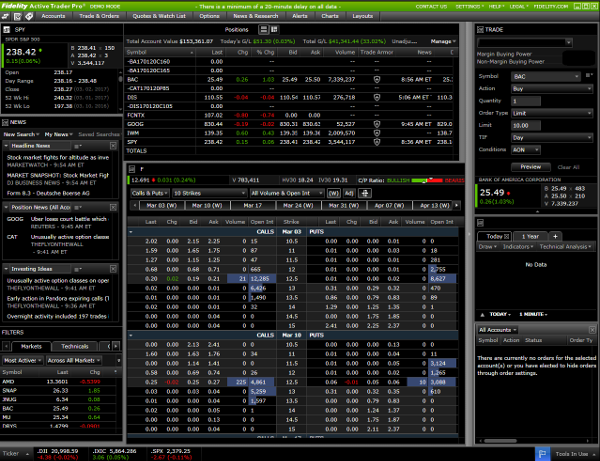
On the brokerage front, Fidelity supports nearly 30 million brokerage accounts and approximately 600,000 trades a day. This includes the Active Trader Pro platform.

Its trading clients hold about $8 trillion in their Fidelity accounts.

And with the range and quality of the tools and features with a Fidelity trading account, you’ll soon see why they’re one of the biggest in the world.

Before we get into opening an account with Fidelity or looking at the pros and cons, let’s explain some of the company’s history so you can see how it became what it is today.

The History of Fidelity

Fidelity’s history goes back nearly a century, when a lawyer and businessman named Edward Crosby Johnson II applied for his ‘Fidelity Fund’ approved by the Massachusetts Securities Director.

The Fidelity Fund was the only fund to gain approval in the state during the Great Depression. This fund became Fidelity Investments. Johnson later founded Fidelity Management & Research in 1946, right after World War II.

From there, Fidelity continued to expand and break new ground in the investment landscape.

In the 1960s, they became the first big finance company to make mutual funds investing available to everyday people. Up until then, mutual funds had only been advertised to high income, wealthy people. Fidelity sent direct mail and went door to door to bring a huge new group of investors into the market.

At the end of the 60s, Fidelity started serving customers outside the U.S. with the newly formed Fidelity International Limited. In 1982, they began offering 401(k) products. In 1984, they were one of the first to offer computerized trading.

More recently, Fidelity has continued to pioneer new areas for its business and clients. In 2018, they set up Fidelity Digital Assets so cater to institutional crypto asset custodial services and trading. In March 2021, Fidelity again made a bold move by filing for a Bitcoin ETF with the SEC.
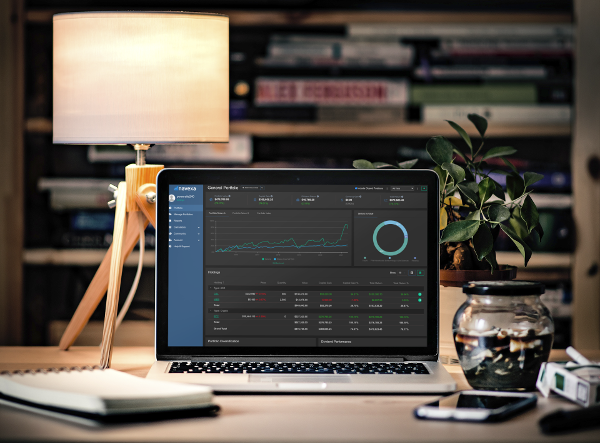
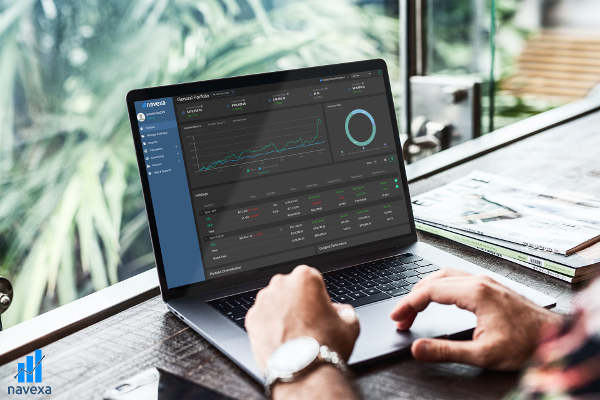
Why Do People Invest With Fidelity? 

When you consider that Fidelity has somewhere in the region of 30 million individual clients — about 10% of the U.S. population — you’d have to say there are a lot of reasons why people choose to invest and trade with them.

Fidelity has a huge range of products and solutions for investors and traders of nearly every size and experience level. They offer mutual funds, stocks and ETFs, options and more. Their trading platform comprises stock screening and research tools, portfolio advisory and wealth management services, and the separate Active Trader Pro — a completely customizable desktop application aimed at active day traders. They also offer the Fidelity mobile app.

Beyond that, Fidelity offers a robo advisor service. And outside of its platforms, also offers extensive mutual funds and retirement planning services.

So across its massive customer base, there are loads of different reasons why people sign up with Fidelity. In the U.S., these customers can visit 140 physical branches, which for some is an important benefit they can’t get at newer, digital-only brokerages and trading platforms.

One particular attraction, for some, is that Fidelity allows customers to elect to manage part of their portfolio, while they allow a professional manager handle the rest. This hybrid management approach offers more flexibility than other players in the market.

Of course, another major reason to trade with Fidelity is their trading fees.

Like many other major North American trading platforms, Fidelity has moved to a low, or no, transaction fee structure. For some of its offerings, the group claims to offer the lowest fees in the industry.

Many stock and ETF trades incur no transaction fee. There’s also no account service fees, late settlement fees or account minimum. Also, unlike other platforms, such as TD Ameritrade, Fidelity sweeps any unused cash in your account into a cash management account with FDIC insurance. This account charges no fees and pays interest.

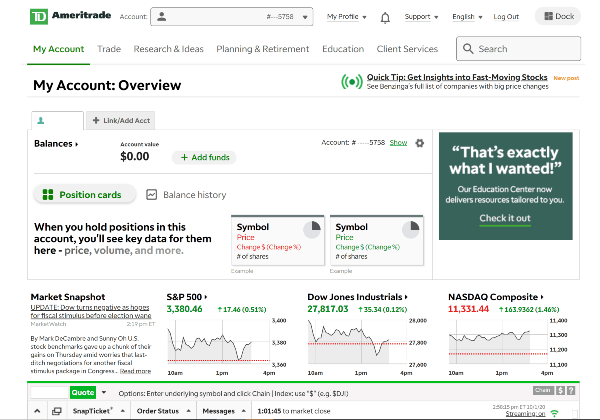
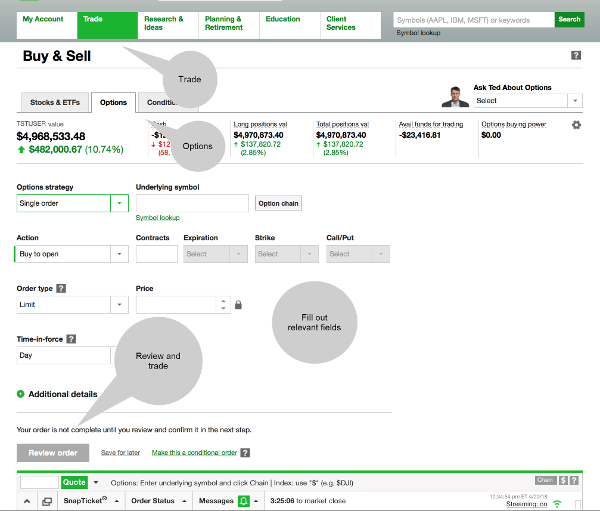
How To Open An Account With Fidelity 

Opening a trading account with Fidelity is pretty straightforward, as you’d expect of any major online trading platform these days.

While they let you open an account the old fashioned way, by printing and mailing a form, you can of course create an account online.

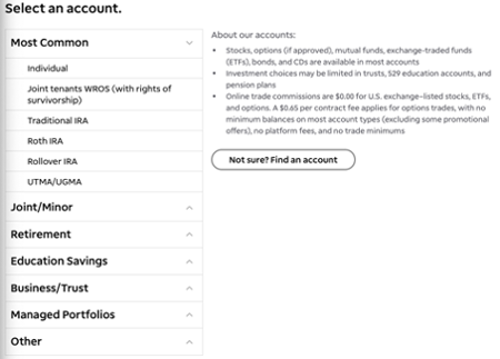
First, you’ll need to select your account type. We’ll explain those below.

Once you’ve done this, it’s a case of standard investment service KYC (know your customer). So have your social security number, residential details and details about your employment handy.

stock and ETF
Opening a Fidelity account is relatively easy.

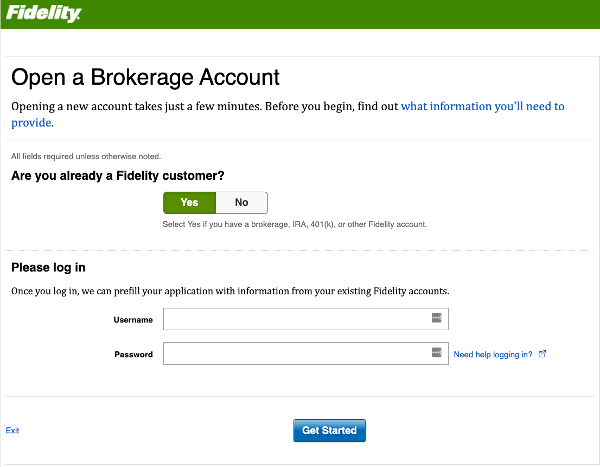
From there, you just need to complete a few fields with your personal information, and choose your investing and trading preferences.

Fidelity begins tailoring your experience during the registration process by asking you to make selections around your goals and interests — the articles, videos and third party research they’ll direct you to in your account will reflect your choices here, so be sure to take your time with this step.

Then, you can review the information you’ve entered, check everything is correct, go through the terms and conditions — which are all pretty standard for the industry, and which you’ll need to spend a long time on if you want to read them to the letter (full T’s & C’s here).

Once you’ve done all this, you’re good to go. All up, applying online should only take about 20 minutes. If you go old school and lodge your application by mail, you’ll need to wait a few days, possibly longer.

Additionally, if you want to register for international trading once you’ve created your account, you can expect to spend about another five minutes getting your account verified.

Once you’re up and running with your account, you can use the mobile app to trade and receive alerts while away from your desktop.

What Are The Different Investment Accounts Fidelity Offers?

As we’ve mentioned already, Fidelity is huge. As a pioneering brokerage with nearly 100 years of history, today they have a huge number of products and services on offer for a wide range of customers.

The same goes for the types of accounts you can open with them. As you’ll see, whatever your goals or life stage, chances are Fidelity has an account type for you.

Fidelity’s investment account types fall into seven categories. They are:

  • Investing and trading
  • Saving for retirement
  • Managed accounts
  • Saving for education/medical expenses
  • Charitable giving
  • Estate planning
  • Annuities
  • Life insurance

Within investing and trading, you have:

Brokerage accounts: Standard trading and brokerage.

Cash management accounts: Fidelity’s FDIC-insured cash accounts carry no transaction fee and pay a small amount of interest on your balance.

Brokerage and cash management accounts: A hybrid that combines the previous two.

Business accounts: A business level account for trading and holding cash.

Fidelity’s saving for retirement account category comprises no fewer than eight different types of account, including simple, traditional and rollover IRA, 401(k) for individuals and businesses, and more.

If you register for a managed account, Fidelity’s professional advisors and robo-advisors will handle your investment portfolio for you, in line with parameters and preferences you set as the account owner.

The education and medical expenses savings accounts include 529 accounts, custodial accounts for investing on behalf of children, health savings and an account designed to help disabled customers and their families plan and save for disability-related expenses.

Other account types include Fidelity Charitable, which lets you claim tax deductions for supporting charity, Trust and Estate accounts in which you can manage trading for these entities, life insurance coverage accounts and a selection of annuity accounts, ranging from retirement saving to immediate and deferred income accounts.

All up, Fidelity offers pretty much every kind of investing account you could imagine ever needing, from trading online virtually right away to planning years and decades into the future using insurance and income services. And don’t forget their more advanced trading offering, Active Trader Pro.

Now, let’s talk fees.

Fidelity trade and account fees are pretty reasonable.

Fidelity Trading & Account Fees: Generally Very Low, But With A Couple Of Exceptions

Like so many large brokers in this ever more competitive digital age, Fidelity has in recent years adopted a low/no fee/commission model. Mostly, anyway.

Across Fidelity’s huge range of platforms and account types, they’ve essentially set up their fee structure to offer little to no barrier to entry for those wanting to get started trading stocks.

While US stock and ETF trades are commission free, you will pay to trade international shares on the Fidelity platform.

On the mutual funds front, Fidelity offers nearly 4,000 ‘free’ mutual funds, which you can trade without paying fees or commissions. On the other hand, many of the mutual funds you can trade with them do incur a fee — up to $75 in some cases. You should also note that despite offering so many free funds (including, of course, Fidelity’s own), you may be charged a sale fee of $49.95 if you sell your shares in that fund within 60 days of buying them.

If you’re trading with leverage, or margin, it means you’re borrowing cash from your broker in order to (hopefully) multiply your potential gains.

If you’re borrowing to invest with Fidelity, you can expect to pay a relatively high interest rate on margin lending — 8.3% for a balance less than $25,000.

The more you borrow, the better that rate gets. If you borrowed more than a million dollars for a trade, for instance, you’d pay 4% interest on that balance.

Of course, with any trading account, there’s potentially a whole host of other fees you’ll need to be aware of. These are called non-trading fees. This is where Fidelity is quite generous.

You’ll pay nothing to open your account, deposit or withdraw money. And they won’t charge you a penalty fee for leaving your account inactive for any period of time, either. There are currency conversion fees if you choose to trade international stocks through the platform, however.

Here’s an in-depth, detailed breakdown of all Fidelity’s fees.

Fidelity packs a massive amount of value into its trading platform.

Fidelity Pros: Huge Variety, Low Fees, Quality Research

There’s a lot to like about a Fidelity account. While we’ve outlined the different types of account you can sign up for above, we’re just going to look at the individual investment account here as we cover a few pros and cons.

Pro #1: Access to a huge selection of stock and ETF investments, mutual funds and more

With a Fidelity account, there’s not much you can’t invest in. Across US-listed stocks, you can buy and sell free from fees and commissions. The same goes for almost 4,000 mutual funds — and, of course, Fidelity’s own mutual funds. You could, if you were happy to stick just to these investments, create a considerably diverse portfolio in your account via these fee- and commission-free investments alone.

Then, of course, there’s the rest; International stocks (Fidelity gives you access to more than 20 markets all up), bonds, options and their other mutual funds and ETFs not covered by their fee-free structure.

Pro #2: Low fees and commissions across much of the range + zero non-trading fees

As we just mentioned, it’s possible to trade on Fidelity and pay zero fees of commissions if you stick to certain products and markets. Not only that, but you won’t pay a cent for opening, closing or leaving your account unfunded or inactive. There’s no account minimum balance. Plus, cash not invested is automatically placed into a FDIC-insured account where it will accrue interest — not a huge amount, but a trading platform that pays anything on your cash account is still a win, especially if you’re holding large amounts of cash for a long period.

Pro #3: A wealth of top-quality research and education resources

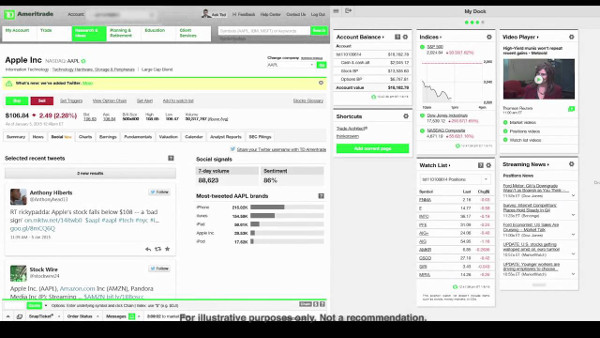
Whether you’re working towards making your first ever investment, or you’ve been in the markets for decades already and are well into your investing journey, Fidelity, like its competitor TD Ameritrade, packs a mind-boggling amount of educational and research resources into your account.

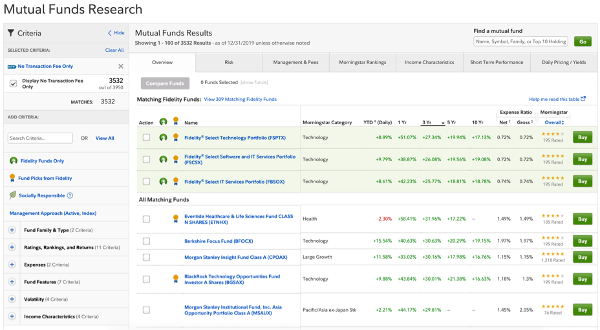
If you’re looking for tools to help you analyze stocks and markets, you’ll be pleased to know Fidelity provides:

Stock, Options & Fixed Income Screeners: In your account, you’ll find a host of screening tools for stocks, funds, options, bonds and more. You can use these screeners to filter through the wide range of investments available and narrow down those you want to look closely at. One of these screeners, the Mutual Fund Evaluator, allows you to examine funds’ characteristics and compare them against each other:

funds Fidelity
Fidelity’s stock and fund research tools offer in-depth analysis of potential investments.

40 Tools & Calculators: Budgeting, strategizing, predicting the impact of a certain trade on your overall portfolio performance and balance… the list of tools and calculators available in your Fidelity account goes on, with about 40 available all up.

Research & News: There’s more research and analysis packed into a Fidelity account than you could probably ever hope to digest. They host stock and market research from about 20 top-tier sources, including Thomson Reuters. You can even sort your news sources based on your holdings and stocks you’re watching in your account.

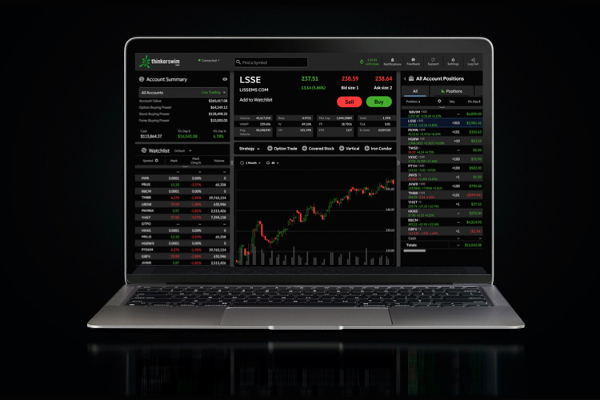
Your account also lets you examine charts using technical patterns, historical and intraday pricing data. Active Trader Pro takes this a step further with more advanced real-time trading data. And, as with most major platforms, Fidelity offers an extensive and quality mobile app experience, too.

Takeaways:
  1. Free to trade US stocks and nearly 4,000 mutual funds
  2. You can earn interest on cash accounts
  3. Packed with research tools

Fidelity Cons: Higher Fees For Certain Services, No Futures, Options

While Fidelity offers a large amount of value across a wide range of products and platforms, there are, of course areas where some customers may find the service lacking.

For the everyday investor — someone looking to research and trade stocks and build up a long-term investment portfolio — Fidelity should deliver more than enough to help you on your way.

But if you’re a more advanced investor or trader who wants access to more complex investment products, you might find you need to look elsewhere for the technology that suits your needs.

Con #1: High Fees In Some Areas May Negate Low Ones Elsewhere

While we consider Fidelity generally a low-fee trading platform, there’s a couple of areas in which they’re not so competitive and, depending on your requirements, this may impact the extent to which the platform could be good value for you.

If you’re wanting to trade beyond Fidelity’s free mutual funds, for example, you’ll pay nearly $50 a trade. Margin interest is also relatively high, if you’re looking to borrow for trading. You’ll need to pay more than $10,000 to borrow $150,000 — which, if your leveraged trade didn’t turn out to be profitable, would negate all the low or no-fee parts of your Fidelity account.

Con #2: No Support For Commodities & Futures Options

Fidelity’s Active Trader Pro provides a powerful service for advanced traders to access the markets with real-time data and an interface they can customize to suit them. However, despite offering this trader-centric part of their service, Fidelity does not currently allow you to use it for trading either commodities or futures options — two investment vehicles commonly used by day traders.

Con #3: Need To Use Different Platforms For Research & Trading

This isn’t strictly a con, given that between the Fidelity trading platform and Active Trader Pro, you can access both large amounts of fundamental data and third-party market and investment research, and an advanced interface through which to make more complex trades.

But, these two sides to the Fidelity platform aren’t integrated. You need to use two different parts of the service to conduct research and carry out trades (this doesn’t apply if you’re happy just using the main platform for stock, ETF and mutual funds investing).

Takeaways:
  1. Some parts of the platform aren’t free/competitively priced
  2. You can’t trade commodities or futures options
  3. Active Trader Pro doesn’t provide fundamentals research
active trader pro
Fidelity’s Active Trader Pro.

Fidelity Customer Support: Comprehensive & Multi-Level

As you’d expect from a massive, long-established broker like this, Fidelity’s customer support is regarded as pretty good.

Depending on your account type, you can reach them through 24/7 live chat, the customer support hotline (800-343-3548). For the best results, try reaching them between 8am and 10pm Eastern Time, and Saturdays from 9am to 4pm.

More recently, Fidelity has upped its social media presence, which you might find useful in resolving any support requirements, too. You can check out their subreddit, YouTube channel, Twitter account and Facebook page.

Verdict: One Of The Most Powerful Brokers For U.S. Customers Of Nearly Every Experience Level

Fidelity Investments regularly tops various publications’ ‘Broker of the Year’ lists. And while there are a few potential downsides to using the platform in some cases (see above), overall this is an investment research and trading platform that delivers quality and value in spades.

Investopedia rates Fidelity 4.5 out of 5 stars, saying they ‘continued to enhance key pieces of its platform while also committing to lowering the cost of investing for investors’.

Brokerchooser awards them a 4.7 stars — ‘it offers plenty of high-quality research tools, including trading ideas, detailed fundamental data and charting. The web trading platform is easy to use, and offers advanced order types’.

Nerdwallet and Stockbrokers award a full 5 stars out of 5 stars, with the latter commenting: ‘Fidelity is a value-driven online broker offering $0 trades, industry-leading research, excellent trading tools, an easy-to-use mobile app, and comprehensive retirement services.’

You can see then — from our review and from the consensus of these leading sites — that Fidelity is a formidable platform with the history, technology, product range, fees structure and research to make it a brilliant solution for investors and traders of different levels.

They wouldn’t have nearly 10% of the US population as customers were they not a proven, reliable and top-quality broker and trading platform.

Before we wrap up this Fidelity review, though, we should mention that, if you are already, or are looking to become, a Fidelity customer, you should consider adding another piece of financial technology to your investing toolkit.

The Navexa portfolio tracker
The Navexa portfolio tracker automatically tracks stocks and crypto performance in a single account.

Don’t Cut Corners On Your Portfolio Tracking

One area in which many brokers — even a best-in-class brokerage account like Fidelity — often lack is in their portfolio tracking and analytics capabilities.

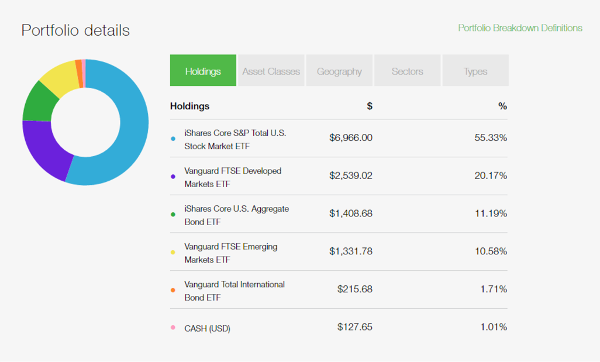
While you can load your Fidelity accounts into FullView (Fidelity’s analytics module) to see your asset allocation and portfolio performance, Investopedia reports that it ‘can be slow to load and a little difficult to customize’.

Here at Navexa, we know that correctly tracking portfolio performance is vital to building and understanding your long-term, true investment returns.

See how true performance differs from the numbers you might be seeing in your brokerage account.

Three Things You Should Know About Your Portfolio Performance

Here are three vital things you need to know in order to fully understand the value and performance of a given investment, and your wider portfolio.

1.   How much time have you invested to generate a return? Consider that a 100% gain in a year is far more desirable than a 100% gain in five years.

2.   How much income have you earned from dividend payments? One stock our founder owns has paid him back 40% of his investment in dividends. This substantially affects how you should view an investment’s performance.

3.   How much have you spent in fees? If you’ve been investing for 20 years, making, say 25 trades a year at $20 a trade, that’s $10,000. However much you spend on fees in the course of your trading, you need to factor that in to fully understand your portfolio performance.

Navexa portfolio tracker
Bring all your trading data into one place with the Navexa portfolio tracker.

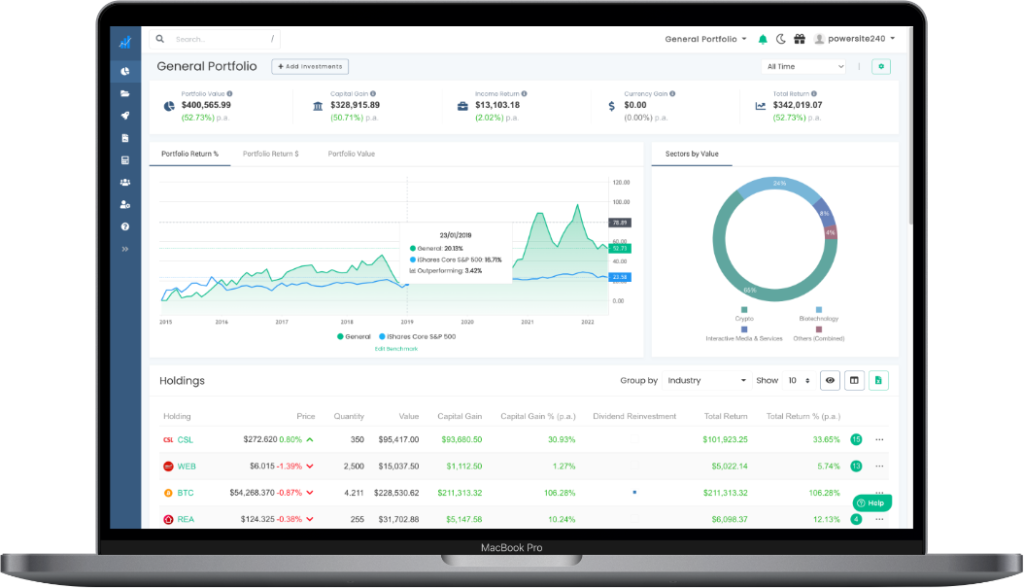
How Tracking Your Portfolio With Navexa Complements Your Trading Platform Experience

Our portfolio tracking platform allows you to see not only your portfolio’s true performance after fees, income, currency gains/losses and annualization, but to drill down deep into all the factors affecting your portfolio and its holdings.

You can run a portfolio contributions report to identify which holdings are contributing the most (and least) to your portfolio performance.

You can run an upcoming dividends report to see which income you have scheduled coming from your investments (thanks to official data from the NYSE, NASDAQ and ASX).

You can view your portfolio performance across any date range you prefer, and factor in closed positions (or not) as you wish.

Try Navexa free for 14 days and see for yourself your portfolio’s true performance.

How Fidelity Customers Can Use Navexa To Optimize Their Investment Journey

Our platform is what we like to call ‘broker agnostic’. That means whether you’re trading stocks, ETFs and mutual funds, crypto or pretty much anything else, you can track it all together in Navexa.

Navexa is one of the few tools that allows investors to bring all their trading platform data into a unified analytics and tracking account where they can see their combined investment performance net of trading fees and currency gain.

I’ve personally experienced the power of tracking dividend income on a stock which made me a 100% return in dividends alone, despite not generating any capital gain. So trust me, it pays to track this stuff properly!

Not only does this allow you to see your true overall performance, but it breaks down your performance by capital gains, investment income and different methods of calculation like simple returns and compound annual growth rate.

For Fidelity customers — or those trading with any major US brokerage account — it’s super easy to get started with Navexa’s automated portfolio performance tracking.

Simply upload your historical trade data using our handy portfolio file uploader tool to see your investment performance clearly and optimize your investment journey!

Categories
Financial Literacy Financial Technology Investing

How To Read Level 2 Market Data

Level 2, or level II, market data refers to real-time access to an additional layer of information about the market’s depth and momentum. If you’re a trader, or you’d simply like to learn more about level 2 market data, this post explains how it works, how to interpret it, and demonstrates level 2 market data in action.

Imagine knowing how many traders were placing orders in a stock before those orders were fulfilled. Imagine knowing the sizes of those orders, the speed at which buyers found sellers for them, and the prices of not only the highest and lowest buy or sell order, but the prices of 10 or more at any given time.

In other words, imagine having a lens through which you could see a stock’s liquidity, supply and demand in real time, before the rest of the market found out.

Welcome to the world of level 2 market data.

Level 2 market data is the realm of the trader. That’s because the information it provides gives the traders a clearer picture of a stock’s supply at demand and a variety of price levels.

This post is going to walk you through why this data exists, how to read the information on a level 2 quote screen and the reasons you might want to.

We’ll also show you a couple of examples of level 2 quote screens and share some tips on reading and interpreting them.

Plus, we’ll share some great resources where you can find out more, and introduce our powerful online tool we recommend using to track, analyze and report on your trades and portfolio, regardless of whether you’re a buy-and-hold investor or an active trader using level 2 data to research stocks.

Before we continue, an important note: This post is not intended to be financial or investment advice. It is general information only and we recommend that you do your own research and/or seek professional advice before risking your money on an investment — regardless of whether you use level 1 or level 2 data!

Now, let’s get into it.

What Is Level 2 Market Data?

To understand level 2, or level II market data, first let’s look at level 1.

The more basic of the two types, level 1 market data generally provides the following information;

  • Bid price: The highest price a buyer is willing to pay.
  • Bid size: The amount traders are looking to buy at the bid price.
  • Ask price: The lowest price a seller will sell for.
  • Ask size: The amount traders are looking to sell at the ask price.
  • Last price: The price of the most recent trade.
  • Last size: The amount of shares that most recent trade was for.

This level 1 data provides plenty of intel for most traders — particularly those using trading strategies based on price action — to make decisions around what, and when, they’re going to buy or sell.

You can think of level II market data as an expanded version of level I.

With level 1, the bid price and ask price information refers only to the highest and lowest prices, respectively. But with level II market data, you’ll see multiple high bid prices — five, 10 or more, depending on the exchange you’ve bought the data feed from.

It’s the information on the bid and ask prices that sets this data apart.

Similarly, you’ll see multiple bid and ask sizes related to those prices.

In other words, level 1 shows you only the extremes of a stock’s trading behaviour — the upper and lower levels at which traders are buying and selling, plus the quantities.

Level II gives traders a clearer picture of what’s going on with a stock because they can see a larger chunk of the trading action — more trade prices and sizes, and more importantly, more information on the difference between what’s happening at the upper and lower prices of current trading activity.

Sometimes you’ll hear level II market data referred to as ‘the order book’. That’s because you won’t just see orders that have been filled already, but also orders that have been places and are yet to be filled.

This is another layer of insight in that you can watch how long a given order takes to be filled. In other words, how long the market takes to pounce on a buy or sell order at a given price.

  • TL;DR: Level 2 market data shows you more of the buying and selling action than the more commonly used level 1 data — including orders that haven’t yet been filled.

How To Read The Information On A Level 2 Quote Screen

So now you know what sort of information level 2 market data shows. What about how you’re supposed to interpret that information in your stock analysis and trading?

There are four key insights you can gain through the information in a level 2 quote.

They are: Market depth, liquidity, timing and bid-offer spread.

Market depth expresses the measure of supply and demand for the stock. By checking the quantity of the open buy and sell orders, you can get an idea of how ‘deep’ the market for this particular stock might be.

Liquidity is closely related to market depth. It’s the measure of total buys and sells and, crucially, how fast those orders are fulfilled and replaced by fresh ones.

The level 2 market data can help traders looking to time their buying and selling by revealing a stock’s market depth and liquidity. If you can see there’s plenty of buyers and sellers placing and fulfilling orders at a fast pace, you can decide when might be the best time to make your own trade.

The bid-offer spread is the difference between the price you can sell the stock and the price you can buy it (the bid and ask prices).

The difference between these prices (and remember, in level 2 market data, can see more than just the highest and lowest prices) is known as the spread. Generally speaking, the smaller a stock’s spread, the more liquid you’d consider it.

  • TL;DR: Level 2 quotes show you a stock’s depth, liquidity and bid-offer spread.

Why Do I Need To Know How To Read Level II Market Data?

Strictly speaking, you don’t need to know how to read level II market data to trade stocks. As we mentioned, this type of data is an additional layer on top of the level 1 market data most everyday traders have access to on their trading platforms.

It’s not essential to have access, or to know how to interpret it in order to invest and trade.

But if you’re an active or advanced trader, using a trading strategy that hinges on intra-day data — or that requires leverage (borrowing money) — you may find that the additional information in level 2 market data benefits you.

This is particularly true if you find additional data on bid and ask prices useful, or if you want to get an idea of who the market makers are for a stock (more on market makers below).

If, for example, you’re trading with a few thousand dollars as a hobby, you might not benefit from seeing level 2 quotes for stocks you’re interested in.

But, if you’re looking to deploy, say, $500,000 into the market with the objective of making quick profits from small price movements, then level 2 market data might help you get an edge in your trading.

  • TL;DR: If you’re trading frequently and/or with leverage, having access to this additional layer of information about a stock’s price action may be valuable.  

Example Of Reading A Level II Quote Screens

Here’s an example of a level 2 market data quote screen:

Level 2 market data

At first glance, this might look like a confusing collection of raw numbers.

Let’s break it down. The top section shows you an array of information about the stock this quote is for — easyJet.

You can see the ticker symbol, the latest closing price, and a selection of current information like the last price shares changed hands for.

In the top section you can also see ‘buy depth’ and ‘sell depth’. These numbers refer to the liquidity on both the demand and supply side of the current trading.

Below that, you can see two tables containing the latest buy and sell orders. These tables are mirrored, so the outside column of each shows you the time of the order, the middle column shows the quantity and the inside column the price of the order.

Tips For Using Level 2 Quotes 

Using level 2 market data in your trading means you get access to a wealth of additional, real-time information about the market for a particular stock. You’ll be able to make more accurate judgments of liquidity and order sizes on both the buy and sell side.

But, one thing to be aware of with this type of data is that things aren’t always what they seem.

Key to this is the types of market participants you’ll see in a level II quote.

There are three types of market participants you might see in a level 2 quote. They are the market maker (the market maker is the one who dominates the price action, doing the most buying and selling), electronic communication networks or ECNs (the order placement systems through which people place their trades), and wholesalers (some online brokers and platforms sell their orders to a wholesaler who executes orders for them).

Market makers will sometimes hide their order sizes so as not to tip off the market about their appetite for a stock. Rather than placing one large order, market makers might place several small ones — or trade through an ECN so that you can’t see who’s behind the order.

Resources For Learning More About Level 2 Quotes

The world of level 2 data is more complex than the more widely used market data and stock analysis you might be used to.

To learn more about how the information in a level 2 quote might be indicative of future price action, here’s a few resources worth checking out:

Analyzing a stock using level 2 data could give you insights into liquidity, bid and ask prices, and spread, which may be indicative of trend changes.

If you’re going to go so far as to subscribe to level 2 data, there’s something else you should make sure of, too.

Whether you’re using level 2 quotes to analyze stocks you’re considering trading, or you’d prefer to buy undervalued companies and hold them ‘forever’ like the great Warren Buffet, you must ensure you correctly track your investment portfolio performance.

Also Check Out: How To Use The Zig Zag Indicator To Read Charts

Understanding a stock’s trend is a vital part of trading, and a key focus for technical analysis.

The zig zag indicator is a basic technical analysis tool you can use to determine whether a stock is trending up or down.

This indicator is one of the more simple tools used in technical analysis — the discipline of analyzing charts to make predictions on future price movements.

Discover the zig zag indicator formula is and the basics of how to calculate and use it in your investment analysis.

How The Navexa Portfolio Tracker Helps You Track, Analyze & Understand the Stocks, ETFs and Cryptos In Your Portfolio

Here at Navexa, we’re in the business of creating tools to help self-directed investors better understand their investment portfolio.

Regardless of whether you’re a long-term, buy-and-hold investor who prefers ETFs to stock picking, or you’re an active trader using a specific system to chase profits on a weekly or daily basis, Navexa’s portfolio tracker is designed to track your true performance.

When we invest and trade, we often just focus on stock prices and returns.

But the fact is that there’s many more factors that impact how much money we actually make, or lose.

This is why we’re created a platform that accounts not just for annualization (your average annual return over the whole time you’ve held an investment), but also for trading fees and income (two commonly overlooked but very important factors we sometimes leave out when we analyze our portfolio performance).

Trading and investing properly requires that you properly track and understand the impact of your trades and investments over the long term, in real money terms.

That’s why you need to portfolio tracker that calculates your true performance for your portfolio and the holdings in it.

True performance is different from the simple ‘gain’ you’ll see in your trading account.

It accounts for how long you’ve held a position, trading fees, currency gain and dividend income.

The portfolio tracker we run here at Navexa does all this (plus, you can generate a variety of reports, from diversification to portfolio contributions, and many more).

You can track ASX, NYSE and NASDAQ-listed stocks and ETFs, plus cryptocurrencies using official exchange data.

Try Navexa free today and see for yourself what your portfolio’s true performance really is.

Categories
Financial Technology Investing

Our TD Ameritrade Review: How To Get Started, Pros & Cons, And More

Our TD Ameritrade review covers key pros and cons of trading with one of North America’s most powerful platforms, how to open an account, transaction fees, how to use the variety of research and education tools on offer, and more.

Welcome to our TD Ameritrade review. This (rather long) article dives deep into the TD Ameritrade platform to give you a clear picture of the service’s extensive history and details on:

  • The TD Ameritrade platform, service and offerings
  • How to open your own TD Ameritrade account
  • Pros and cons of using TD Ameritrade
  • How to decide whether TD Ameritrade might suit your investment needs
  • And more!

As one of the largest online brokerage platforms on the planet in its own right, TD Ameritrade was acquired in October 2020 by Charles Schwab.

This huge merger with Charles Schwab will probably take several years to complete. So, for now, we’re reviewing TD Ameritrade as a standalone platform.

If you’re investing in stocks, mutual funds, options or even Bitcoin futures contracts, TD Ameritrade has a variety of services you might find useful.

The best way to describe the trading platform is as a full-service investment services provider.

Whether you’re just starting out as an investor, or you’ve been in the markets a long time, or even if you’re running an investment fund or managing client’s portfolios, TD Ameritrade is a powerful, far-reaching trading platform that offers products and tools that will likely support you in your investing mission.

The service isn’t just focused on facilitating trading and investing. Like CommSec, TD Ameritrade has invested heavily into the education and guidance side of its service. Chatbots, seminars, articles, slideshows and other educational content and tools are packed into the platform to enable investors of all levels to learn and improve. 

TD Ameritrade even offers a virtual trading simulator so you can practice trading with a notional $100,000.

We’ll come back to these features later in our review. Plus, we’ll walk you through opening an account, using the platform, potential pros and cons of using TD Ameritrade and more.

Also, we’ll show you how using this powerful portfolio tracker alongside your TD Ameritrade (or other) trading account can enhance and enrich your understanding of your investment portfolio’s true performance.

What Is TD Ameritrade And What Do They Offer

TD Ameritrade traces its history back to 1975, when four partners opened First Omaha Securities, Inc. in Nebraska.

In 1983, that became Ameritrade Clearing, Inc. Five years later, they introduced the first telephone trade order system. In 1995, they became the first to offer electronic trading.

From there, the group acquired multiple businesses to become a digital-focused trading service. The ‘TD’ in their name comes from their 2006 merger with Toronto-Dominion Bank’s US brokerage business, TD Waterhouse.

TD Ameritrade’s tech focus continued. They are the first company to advertise on the Bitcoin blockchain. As of October, 2020, they’ve been acquired by another huge North American brokerage, Charles Schwab Corporation. Whether the Charles Schwab merger changes much about the platform remains to be seen.

TD Ameritrade offers its electronic trading platform for customers to trade stocks (common and preferred), futures, ETFs, cryptocurrency, foreign exchange, options, mutual funds, fixed income investments and even carry out margin lending.

The company has more than $1.3 trillion on its platform across about 11.5 million accounts.

On average, it supports nearly 900,000 transactions every day and generates approximately $6 billion a year.

The platform offers a large range of services and access to a many different types of investments.

There’s the TD Ameritrade platform itself and the sophisticated active trading service they acquired in 2009, thinkorswim.

Both these sides to the platform are available on web and mobile.

TD Ameritrade offers a large variety of account types.

TD Ameritrade Account Types
  • Standard accounts
  • Retirement accounts
  • Education accounts
  • Specialty accounts for trusts, partnerships and more
  • Managed portfolios
  • Margin trading

Depending on your account type, you’ll have access to a wide range of investments across the web and mobile platforms.

While you can’t directly trade cryptocurrencies (only Bitcoin futures), you can trade pretty much everything else.

What You Can Trade on TD Ameritrade

  • Stocks (long and short selling, plus over-the-counter penny stocks)
  • Mutual funds (nearly 2,000 of them)
  • Bonds (corporate, municipal, treasury, contracts for difference, plus international fixed income and even junk bonds)
  • Options
  • Futures
  • Foreign exchange
  •  Unit investment trusts

Also central to the TD Ameritrade offering is that, unlike some other ‘traditional’ brokers, they’ve recently moved to a low or no-fees model. In 2019 they reduced most of their online trade commissions to zero — meaning you can trade many assets and instruments on the platform for a low fee and pay nothing on your returns.

This brings TD Ameritrade in line with the growing low fees movement driving newer investment platforms into the market.

It also means you can access one of North America’s most powerful investment platforms more cost-effectively than ever before.

So, you’re interested in signing up? Here’s how it works. 

How To Open An Account With TD Ameritrade

Opening a TD Ameritrade account is about as simple as you’d expect with any major North American broker.

You can expect the standard know-your-customer protocol.

To create an account, you’ll need either you Social Security number or your Individual Taxpayer Identification Number.

Plus, you also need to provide your employers’ name and address.

The whole process should take a few minutes.

First, you’ll need to select your account type.

ameritrade review

The signup wizard provides questions and prompts through the process to ensure you register the right account type for you.

Once you’ve confirmed this, you’ll need to enter your personal information.

Then you’ll need to spend a little time reviewing the technical information and terms of your account. This stage includes selecting how you wish TD Ameritrade to treat your cash account — it can go into either a FDIC-insured deposit account or a SIPC-protected TD Ameritrade account.

You’ll also need to review some IRS-related questions here.

Once you’re satisfied — and they’re satisfied — with your information and selections, you’ll need to create your secure login details for your account.

Once you’ve set your password and user ID, TD Ameritrade activates your account and you’re good to go. From here you can fund your account and start trading. You’ll see your official TD Ameritrade account number once you’ve completed the process.

There’s no minimum amount you need to fund your account with to begin. Though if you’re looking to trade options or do margin trading, they require you to fund your account with at least $2,000.

Pros And Cons Of Using TD Ameritrade 

The TD Ameritrade offers an extensive platform that is powerful and — aside from a 2007 hack, in which customers’ details were compromised and circulated on the dark web for several years — largely secure.

TD Ameritrade offers a range of security products, procedures and an asset protection guarantee to protect you from your trading account or personal information being compromised.

As such large trading platform, there are plenty of pros and cons to be debated.

We’ll look at three of each.

TD Ameritrade Pros

Huge array of trading tools and investment options: From the website and mobile versions of both the TD Ameritrade trading platform and its sister active trading platform, thinkorswim, to the number of different things you can invest your money into (from stocks to options and even junk bonds, plus the huge range of mutual funds), the platform gives you a high level of access to the markets. Plus, you have the TD Ameritrade mobile app, and other associated mobile tools.

First-class research and education resources: TD Ameritrade offers you plenty of knowledge in the form of reports, presentations and even an portfolio simulator so that you can progress from beginner to novice, or novice to advanced.

Low fees, high standards: Being one of the more established ‘traditional’ brokers in North America hasn’t stopped TD Ameritrade offering progressive pricing. While you might expect zero fees and commissions from smaller, newer trading platforms like Robinhood, you’ll be pleased to know that TD Ameritrade offers no fees to open an account or trade stocks. They also offer all ETF trades and more than 4,000 mutual fund trades with zero commission.

TD Ameritrade Cons

Information overload: The flipside of TD Ameritrade’s platform being so vast and powerful is that it makes it less than simple for beginner investors or those new to the platform to navigate. With such an array of investments, account types, and a fully customizable trading dashboard packed with information, the chances of overwhelm are high. This may deter you if you’re just looking for a simple platform on which to buy a couple of ETFs.

Occasional outages: The platform had a couple of outages in late 2020, reportedly due to heavy trading volume. This issue apparently prevented users from logging in and/or making trades. This isn’t strictly a con, since even the most robust platforms can suffer occasional outages, but it’s something to be aware of.

No fractional shares, penny stock commissions: If you want to invest in Amazon, but you only want to invest $1,000, you won’t be able to do so on TD Ameritrade. While competitors like Fidelity do cater for fractional share investing, at this stage, Ameritrade does not. Another thing you’ll find is that while many of the platform’s available investments give you zero-fee and zero-commission access, over-the-counter penny stocks do incur a $6.95 commission. And since fees can be a significant factor in your true portfolio performance, it’s important to know this if you’re looking for a trading platform that allows you access to the small and micro-cap end of the stock market.

The Best Way To Use TD Ameritrade For Your Needs 

There’s so many different investment vehicles, account types and tools packed into the TD Ameritrade platform that we’d be here all day if we listed every way you could use it for your needs.

Let’s look the basics of making a trade.

Making a trade

Once you’ve set up your account and moved some funds into it for trading, you’re ready to get started.

You can see from the screenshot below how much information is on the trading account homepage alone.

ameritrade review

To make a new trade, hit the ‘Trade’ button along the top navigation bar.

This will bring up a new screen in which you can select between stocks and ETFs, options and more.

From here it’s a pretty self-explanatory process, similar to most other trading platforms.

Here’s an example of the options trading screen.

ameritrade review

In this example, you look up the ticker symbol and set the various fields to your preference for the trade. Then, click review order. You can also opt to save the trade details for later, which is useful if you want to go away to do some further research before locking it in.

Also near the bottom of the screen you’ll find the SnapTicket. This is TD Ameritrade’s tool for getting quotes and actioning trades. You can open a SnapTicket and it will display no matter where on the platform you navigate.

Using TD Ameritrade for Research

As well as being a powerful tool for buying and selling a multitude of investments, the platform gives you an equally impressive range of research tools and resources.

TD Ameritrade’s stock screeners are completely customizable. If you don’t want to customize, you can choose from nearly 100 preset options. You can also access screening tools for ETFs, options, mutual funds and fixed income.

Plus, through both the TD Ameritrade portal and the sister thinkorswim trading platform, you can access a huge amount of calculators, news, charting tools, trading ideas and third-party research from some of the most respected firms in the world.

ameritrade review

While there may be a risk of information overload thanks to the sheer volume of data and tools at your disposal, if you know what you’re looking for and you know which information will suit your research best, chances are you’ll find it in the TD Ameritrade platform.

Using TD Ameritrade For Analyzing And Tracking Your Portfolio

If you’re familiar with the importance of asset allocation, you’ll know that buying and selling investments is just a part of a much bigger picture.

Being able to zoom back from stock-by-stock analysis and performance, and focus on your overall, long-term portfolio performance is key to a solid investment strategy.

The platform’s Portfolio Planner tool shows you your asset allocation and allows you to compare that to a target allocation for a theoretical portfolio.

If you have a particular pre-defined asset allocation or portfolio management strategy you’re seeking to follow, you’ll be able to add this into your Portfolio Planner and get specific recommendations on which stocks may be a good fit.

This is a valuable tool — one that goes beyond just facilitating trades and allows you to pair your research and investing with a broader, longer-term strategy.

There’s so much packed into TD Ameritrade and thinkorswim (which deserves its own independent review) that we can’t cover everything here.

Your needs for a trading platform will be unique to your individual goals and risk tolerance. But based on the scale and depth of TD Ameritrade’s platform, its likely you’ll be able to find the right combination of assets, research and tools to fit your investing strategy.

Should You Consider Opening An Account With TD Ameritrade?

According to StockBrokers.com, TD Ameritrade is not only the best overall stock broker in U.S., they also rank first for active trading, tools and platforms, and education.

The platform itself makes the bold claim that by joining, you’ll grow smarter with every trade you make. And going by the amount of account types, investing options, and tools for research and education, you’d have to say that TD Ameritrade is in a strong position to make that claim — provided, of course, you understand how to use these tools and interpret the data and analysis these resources generate.

According to this TD Ameritrade customer:

If I started from scratch and had to find a new broker today, these would be the key requirements I’d look for:

  • No Minimum Deposit Requirement
  • Low Transaction Costs
  • Commission Free ETFs
  • Great Research Tools
  • Easy to Use Trading Platform
  • Great Customer Support
  • Easy Tax Reporting’

TD Ameritrade, of course, boasts all these. As the customer points out, the quality and depth of the research tools especially would justify paying more in trading fees and commissions than you might with a competitor platform.

But since 2010, TD Ameritrade has — unlike some of the other big, established trading platforms in the North American market — been aggressively generous in its offer of low or no fees and commissions. This is particularly true of their extensive ETF offering.

So on this basis alone, you should consider signing up with the platform since there’s enough tools and resources to support you whether you’re a beginner investor looking to learn about the markets, an advanced trader who’s seasoned at using stocks, bonds, options and leverage, or pretty much anything in between.

But as we’ve touched on in this TD Ameritrade review, the platform and the organisation behind it has either pioneered — or acquired — so many different services for the modern investor that no review is going to be able to cover everything.

But one thing worth mentioning here is TD Ameritrade’s customer support.

According to the customer we quoted before:

‘Help is easy to come by with phone, email, online chat, in person at a local branch, and the easy to use Ask Ted feature… the educational tools available, and the little help center buttons in all the right places… will walk you through the basics.

On top of that, I get a couple of phone calls every year from the local TD Ameritrade branch. They just check in, see if I have any questions, concerns, and how they can help.’

In other words, if you have any issues with any aspect of your TD Ameritrade account, there’s multiple ways you can access support and assistance.

Of course, only you can decide whether signing up is right for your specific requirements.

But, in short, you should consider signing up to TD Ameritrade if:

  • You want access to a huge variety of investment vehicles, from regular stocks through to options and margin lending.
  • You value in-depth research and educational resources to help improve your financial literacy and skill as an investor.
  • You want the support of trading with one of the biggest (and soon, thanks to the Charles Schwab acquisition, the biggest) trading platforms in North America.
  • You want to minimize the impact of trading fees and broker commissions on your investment portfolio.

How To Get Started Trading Stocks, ETFs, Mutual Funds, Options, Bonds Or Futures Through TD Ameritrade’s Online Brokerage Services

Whatever level of experience you’re at right now — be it embarking on your investing journey or looking to start making more complex trades with futures and options — TD Ameritrade has gone to great lengths to provide to resources to get you started.

If you’ve never traded a single stock before, this is a good place to start. This is TD Ameritrade’s introduction to the world of stock investing.

Here, you’ll find the basics. From the definition of a stock, introductions to common approaches to investing in stocks, a short glossary covering five key terms you should be familiar with before getting into the market (read a more extensive glossary and explanation of stock trading strategies), to a quick guide on setting up an account, this page is a good place to get started — especially if you already know you want to sign up to TD Ameritrade.

Like we’ve said, though, there’s a massive amount of resources on the platform to support investors of every level in building their financial literacy and understanding of the markets.

If you sign up, you’ll have access to TD Ameritrade’s Immersive Curriculum. This is a free online course that curates a series of courses based on your experience level and account setup choices.

Some of the courses available:

  • Simple Steps for a Retirement Portfolio
  • Stocks: Fundamental Analysis
  • Income Investing
  • Stocks: Technical Analysis
  • Trading Options
  • Options for Volatility
  • Weekly Options
  • Fundamentals of Futures Trading

This curriculum means that even if you’re not ready to start trading stocks, or options, or futures, or even to start analyzing potential investments using a particular methodology, you can still get great value from the TD Ameritrade platform.

While other brokers and trading platforms might make empty promises about supporting their customers and furthering their knowledge, the same can’t be said about TD Ameritrade. Their resources and support for investors of all levels is extensive and impressive — particular the way the above courses can be tailored to your particular requirements.

A TD Ameritrade account gives you access to three separate (but connected) platforms. There’s the main web platform for the trading account, the associated TD Ameritrade mobile trading platform, and the elite, active-trader level platform, thinkorswim, which you can see below.

ameritrade review

Thinkorswim comes with a downloadable desktop application, a web platform and a mobile app. So really you can access up to five different platforms between TD Ameritrade and thinkorswim.

Another cool feature is that the trading platform app has been optimised for the Apple Watch, meaning you can moniter watchlists, stock quotes and market data from your wrist.

ameritrade review

Based on TD Ameritrade’s large list of investment offerings — stocks and ETFS, mutual funds, bonds, options and more (most with low or no fees and zero commission to trade) — and its extensive research and education resources, this platform will probably be a good place to start your investment journey. 

In our opinion, any trading platform that invests this much in helping its customers strengthen and deepen their knowledge of investing is worth exploring.

Paired with the scope and power of a platform as expansive as TD Ameritrade, that quality becomes even more beneficial.

Trading With TD Ameritrade? Make Sure You Track Your True Portfolio Performance

This TD Ameritrade review has, we hope, shown you that it’s a platform that can offer investors of traders of nearly every level a powerful suite of tools and resources.

We especially like the asset allocation module, with its model portfolio options and associated investment recommendations.

One area in which TD Ameritrade lacks a little is in its true performance portfolio tracking capability.

You can, of course, easily see how your investments are performing.

This is what your portfolio looks like in their platform:

ameritrade review

In this example, you can see each holding’s dollar value and percentage return. You can also see the relative weighting of each in your portfolio on the coloured pie chart.

For such a sophisticated trading platform, this is a very basic level of portfolio insight.

Let us explain.

The rise of self-directed and so-called ‘democratizated’ investing — in which TD Amertrade is playing a part by offering such valuable trading tools and investment education resources with such a low barrier to entry — has more people entering the market and trying to build wealth.

But what many investors are forgetting — or or just plain aren’t aware of — is that there’s a difference between a portfolio’s gains and its true performance.

Your trading account often only shows you how much money you’ve put into your portfolio, and how much you’ve gained or lost. You can see in the screen above that there’s no data or metrics reflecting how long those holdings have been in the portfolio.

Consider this. If you had to choose from two investments which would both gain 100%, but one took half the time to do so than the other, which would you choose?

That’s a no brainer. Because when you annualize those returns, the one that took half as long to reach that gain has actually performed twice as well.

This is the problem with the nominal gains and returns you’ll see in a trading account like TD Ameritrade. 

They’re only a part of the full financial picture you need to see.

The reality is that time, income, trading fees and other factors play a significant role in determining your real returns and true portfolio performance. This is true for even the smallest, shortest term investment. And it’s especially true for long-term strategies.

Three Things You Should Know About Your Portfolio Performance

Here are three vital things you need to know in order to fully understand the value and performance of a given investment, and your wider portfolio.

1.   How much time have you invested to generate a return? Consider that a 100% gain in a year is far more desirable than a 100% gain in five years.

2.   How much income have you earned from dividend payments? One stock our founder owns has paid him back 40% of his investment in dividends. This substantially affects how you should view an investment’s performance.

3.   How much have you spent in fees? If you’ve been investing for 20 years, making, say 25 trades a year at $20 a trade, that’s $10,000. However much you spend on fees in the course of your trading, you need to factor that in to fully understand your portfolio performance.

If you’re thinking of joining TD Ameritrade, we strongly recommend you sign up with a dedicated portfolio tracking platform like Navexa, too.

Navexa portfolio tracker

We believe that in the most connected and data-rich era of financial history, there’s no excuse for not knowing the exact details of every dollar going into and out of your portfolio.

The truth is that there’s are many more things impacting your portfolio than just whether or not the investments in it have gone up or down this week or month.

This is why we developed Navexa. It’s a portfolio tracker that accounts for every factor impacting your investments — time, income, fees and more.

If you’re using a TD Ameritrade account, use a Navexa account to dive even deeper into your portfolio performance data and analyze holdings across the NYSE and NASDAQ.

You can generate a variety of reports, including upcoming dividends (great for forecasting what income your portfolio is scheduled to generate), portfolio diversification, portfolio contributions, and more.

Open a Navexa account (free).

Categories
Financial Literacy Investing

The Zig Zag Indicator Formula — What It Is And How To Calculate It

Understanding a stock’s trend is a vital part of trading, and a key focus for technical analysis. This post explains what the zig zag indicator formula is and shows you the basics of how to calculate and use it to identify price trends.

The zig zag indicator is a basic technical analysis tool you can use to determine whether a stock is trending up or down.

This indicator is one of the more simple tools used in technical analysis — the discipline of analyzing charts to make predictions on future price movements.

In this post, we’ll explain:

·     How the zig zag indicator works to identify price trends

·     How to calculate the formula

·     The potential benefits

·     Some potential limitations

Plus, we’ll share some examples of technical analysis using the zig zag formula, and other key data you should be looking at for both individual stocks you own and your portfolio as a whole.

This post will give you a good overview of the zig zag indicator and how you can use it to better understand and determine price movement.

It is not intended as financial advice, and we always recommend you do your own research and/or consult with a financial professional before risking your money on an investment. 

What Is The Zig Zag Indicator And How Does It Work

The zig zag indicator is part of the discipline of technical analysis.

Technical analysis involves interpreting historical data about a security from its price chart in an attempt to determine a pattern, which in turn might give you an idea of where the price is likely to go next.

Traders use the zig zag indicator specifically to eliminate the ‘noise’ of day-to-day market conditions and price movement, and get a clear picture of whether a security’s trend is reversing.

The zig zag indicator allows you to make points on a price chart wherever the price reverses by more than a given percentage. The most common percentage threshold for selecting these points is 5%.

So for every instance on a chart where the price shifts from either down to up, or up to down, by more than 5%, you make a point.

Once you’ve found all the points that qualify on the chart you’re looking at, you draw lines between each adjacent point.

Take a look at an example.

zig zag indicator formula
Source: TradingView

The zig zag pattern this creates shows you all the significant changes in trend on the price chart.

By showing you only the trend reversals greater than 5%, the indicator helps you to focus only on the significant ones (which may be useful to you in predicting the next likely trend change) and not on the smaller, less consequential fluctuations.

These significant turning points are known as swing highs and swing lows.

It’s important to know that the zig zag indicator cannot predict future price trends or price movement. Advanced traders use the indicator with both Elliot Waves and Fibonacci projections in predicting likely future price movement.

For the everyday investor, however, this indicator can still be a useful tool in getting a clearer picture of a stock’s past behaviour, volatility and support or resistance levels.

How To Calculate The Zig Zag Indicator For A Stock

Calculating your zig zag indicator is simple.

First, select a starting point. Looking at a historical price chart, you’ll need to determine how far back you want to analyze. Choose a swing high or swing low.

Then, decide which percentage of price movement you want to set as your threshold. Most zig zag analyses use 5%.

Once you’ve set the percentage, find the next swing high or swing low that qualifies by being over that amount relative to the starting point and mark it on the chart.

Draw a trend line (the zig zag line) between the two. Then repeat the process from this new point to the next one.

Remember to calculate the percentage change relative to the previous point.

Repeat this process until the last swing high or swing low on your chart.

Once you’ve completed the process, you’ll see something similar to this:

zig zag indicator formula

Now, you can see the significant swings in the stock’s price — not every single change.

At the right hand side of the chart above, you can see the trend line continues right to the Y axis.

If this chart were up to date, you’d be able to confidently say the stock was currently trending upwards.

You could continue analyzing it day to day — or hour to hour if you’re an active trader — until you identified the next swing high or swing low point, allowing you to potentially exit a trade before the price fell further.

Zig zag Indicator Main Points

  • Calculate the points at which the price reverses by more than a minimum percentage.
  • Rule straight lines between each adjacent point.
  • Add further trend lines and analyses overlays to augment the zig zag indicator with other technical trading tools.

More Examples Of Stocks Analyzed With The Zig Zag Indicator

Overlaying the zig zag indicator onto a price chart helps you to see more simple trends and patterns in what can be confusing collections of noisy information.

Finding the points and plotting the zig zag between them is only part of the process for many traders, though.

Take a look at this chart: 

zig zag indicator formula

You can see the zig zag line in green. And you can see two more lines, in black.

The trader here has drawn these by ruling along the upper and lower points on the chart.

These black lines show resistance and support levels. Resistance and support are central ideas in technical analysis and trading.

Resistance is the price at which an uptrending stock is will likely pause before breaking through due to supply levels. Support, on the other hand is the opposite — the price at which a downtrending stock will likely pause due to demand levels.

In other words, a stock might struggle to get beyond a certain price because many investors will sell at or near that price. Conversely, it might struggle to fall below a certain price because investors will try to buy around that price.

Moving averages and trendlines — like the zig zag indicator — are key tools traders use to determine these levels, as you can see above.

Using The Zig Zag Indicator To Spot Trends & Breakouts

Now let’s look at another example of the indicator at play in a chart.

zig zag indicator formula

In this example, the trader has not only added support and resistance levels based on their zig zag trendline. They’ve also made notes of trends and breakouts.

When a stock price passes a support or resistance line, it can be said to be ‘breaking’ higher or lower.

You can see in the lower left part of the chart the note ‘price breakout’. This shows you where the trendline has passed the resistance line, indicating a new break higher.

After breaking higher, there’s a flurry of new swing highs and lows, which the trader has annotated with new resistance and support lines and the note ‘prices in an uptrend’.

These are just two examples of how the zig zag indicator can be useful in the technical analysis of a stock price chart.

The Benefits Of Using This Type Of Analysis In Your Investing Strategy 

The zig zag indicator has several potential benefits. But they only apply if you’re confident with using technical analysis in your investing or trading.

If you’re more of a passive investor (someone who’d rather put their money in an ETF and leave it alone for a long period), or, say, a value or fundamental investor, the zig zag indicator might not be useful to you.

Here are three potential benefits to using it:

1.   Block out noisy short-term price movements and see the significant ones: It can be easy to get caught up in every single price move a stock makes. But not every move demands you buy or sell. Even the best performing investments probably won’t go up every single day. By using the zig zag indicator, you can focus on the meaningful swing highs and lows — the points at which the price really changes direction, rather than just fluctuating as a result of regular trading.

2.   Pair it with other analyses: As you can see in the charts above, using other technical analyses tools allows you to leverage the indicator further. You can see resistance and support levels, and get an idea of the price a stock needs to move above or below in order to break higher or lower — or trade within to remain in a trend.

3.   Zoom out and see a bigger picture: In a week, a stock might have several swing highs and swing lows. But paired with resistance and support lines, plus other more advanced technical analysis tools like Fibonacci levels, you can use the indicator to get an idea of a stocks longer term patterns and trends.

There are many types of trading strategies that may benefit by employing the zig zag indicator — especially swing and momentum trading.

Why You Should Use Caution Before Deciding To Invest In A Company Based On Zig Zag Indicator Analysis

Like any trading strategy or stock analysis tool, the zig zag indicator is not going to give you any guarantees regarding the likely success of an investment.

It’s a trend following indicator. That means it works on historical data. And while it’s a very useful tool in analyzing past price action, it’s never going to predict what a stock might do next.

In this respect, it’s more of a confirmation tool — albeit a very illustrative and educational one.

If you’re using the indicator in your own investing, be sure to pair it with other forms of analysis and research. And, of course, always be aware that no matter what a trend following indicator — or historical price action — might suggest, you do always risk losing money when you invest it.

Additional Resources Available Online About The Zig Zag Indicator

There’s plenty of good resources about the indicator online to help you learn more.

Here’s a detailed breakdown that explains the basics, strategies for deploying it and several examples of the indicator in use.

This page explains the parameters of the zig zag indicator, and some of the things using it can tell you about a stock’s price action and trends.

Since the indicator is a part of technical analysis, you might want to read this introduction to technical analysis itself.

Level 2 Market Data: How Traders See Market Moves Before They Happen

Imagine knowing how many traders were placing orders in a stock before those orders were fulfilled.

That’s the power of level 2 market data, which, if you’re using the zigzag indicator, or looking for a swing high and swing low in a chart, may come in handy.

We explain how to read and apply level 2 market data here.

Pro Tip: Automate Your Portfolio Performance Tracking

Whatever investment or trading strategy you use, you should always correctly track and analyze your investments’ performance.

The Navexa portfolio tracker tracks stocks, ETFs, cryptocurrencies and unlisted investments together in one account.

Navexa lets you track everything together so that you can track, analyze and optimize your investment performance over time.

With a Navexa account, you’ll receive weekly and monthly email updates on how your portfolio is performing, plus powerful tax reporting tools that make recording and reporting your investment taxes quick and easy.

Plus, Navexa allows you to apply different tax strategies to your investments, meaning you can better control the amount of tax you’ll owe when you sell holdings.

You can access charts of your individual holdings and your portfolio as a whole. If you’re using the zig zag, you could apply it to your entire portfolio to identify historical trends and swings.

Plus, you can drill down on your portfolio diversification, contributions and more — giving you a greater depth of insight into how your investments are performing together and relative to each other.

Navexa portfolio tracker

Create Your Portfolio Performance Tracking Account Free Today

Whether you’re using the indicator as part of a trend following, swing trading or day trading strategy, having access to quality charting and data on your investment and portfolio performance is crucial.

You can try Navexa for free for up to 14 days when you create an account today.

Sign up, add your portfolio securely, and see your true portfolio performance using all our members-only reporting and analysis tools.

Open your Navexa account free today.