Categories
Financial Literacy Investing

How to Calculate Cash Dividends: A Complete Guide

Managing a complex portfolio and calculating cash dividends might be challenging. Here’s how it can be done with ease with a few formulas — and with the Navexa portfolio tracker.

Most people who consider investing are familiar with owning stocks. Some are also highly interested in receiving a dividend payout. Those who go deeper into researching an investment, might decide on purchasing stocks of companies because that pay cash dividends.

Dividends might help investors maintain a stable portfolio, remain invested in quality companies, and earn a profit, all while holding shares.

However, novice investors may find dividends confusing — especially when it comes to calculating their dividend yield per share. 

The traditional way to calculate dividend per share is using the company’s income statement and similar reports. But, there are other, easier methods, too.

Dividends Explained

Cash dividends are payments companies make to shareholders from their profits.

A dividend is defined as a distribution of a company’s earnings or stocks to a class of its shareholders. Dividend payouts are determined by the board of directors, and shareholders receive them for as long as they hold the stock.

A dividend is a form of reward to shareholders for investing in the organization and for holding the stock. Dividends may also help a stock’s price remain relatively stable.

Some companies offer dividend payments and prefer to keep the shareholders satisfied. Others decide not to pay dividends, instead reinvesting profits back into the company.

Dividends are paid monthly, quarterly, or annually, depending on the company. They’re paid at a scheduled frequency, so investors always know when they’ll receive the profit from holding shares.

Receiving a dividend based is a great way to increase one’s income, but there’s more to it.

Shareholders also pay attention to other factors, such as dividend yield, rates, retention ratio, and other key numbers.

Dividend Rate vs Dividend Yield

The dividend rate is a percentage that shows how much the company pays in dividends annually, relative to its stock price. The dividend rate can be fixed or adjustable, and it’s expressed as a dollar figure.

The dividend rate is calculated with the following formula:

Dividend rate = dividend per share / current price

On the other hand, the dividend yield is expressed as a percentage, and shows the ratio of a company’s annual dividend payout, compared to its share price.

Shareholders can calculate the dividend yield by using the following formula:

Dividend yield = annual dividends per share / current share price x 100

Navexa helps share investors by calculating dividend performance automatically. Navexa’s app is easy to use, and tracks multiple types of investments. This includes tracking and reporting on cryptocurrency investments.

Dividend Payout Ratio vs. Retention Ratio

The dividend payout ratio shows how much of the company’s earnings after tax are paid to the shareholders. It’s in direct relation to the organization’s net income amount, and it’s used to measure the net income percentage.

It’s calculated by the following formula:

Dividend payout ratio = total dividends / net income

On the other hand, the dividend retention ratio represents the percentage of net income that the company keeps to grow the business, instead of paying it out to the shareholders as dividends.

It’s calculated by the following formula:

Retention ratio = retained earnings / net income attributed to stockowners

Calculating Dividends per Share and Earnings per Share

Dividends per share (DPS) is the number of stated dividends paid by companies for each of the shares outstanding. It represents the number of dividends each shareholder receives based on the shares they own.

DPS is often used to calculate dividend yield, and the formula goes as follows:

DPS = total dividends paid over a period – special dividend payout / shares outstanding

On the other hand, earnings per share (EPS) are useful in calculating how profitable the company is based on measuring the net income for each of the company’s outstanding shares. 

EPS is also an important number used to determine share price.

EPS shows whether investing in a certain company and holding its shares would benefit the shareholders and improve their net income.

For example, if the company reports an EPS that’s below a certain estimate, that might cause its share prices to drop.

The formula for calculating earnings per share goes as follows:

EPS = net income – preferred stock dividends / outstanding shares

Types of Dividends

Four types of dividends include cash, stock, property, and liquidating dividend.

There are several types of dividends that a company may pay to the shareholders. These include:

  • Cash dividend
  • Stock dividend
  • Property dividend
  • Liquidating dividend

Cash dividends are the most common. They represent a simple distribution of funds to incentivize shareholders to hold their shares, improve the shareholders’ equity, and increase confidence in the organization.

What Are Cash Dividends?

Cash dividends represent money a company pays to the shareholders per share they own. The money can come from the organizations’ current earnings or accumulated profit. Cash dividends are paid regularly, usually by quarterly or annual payments.

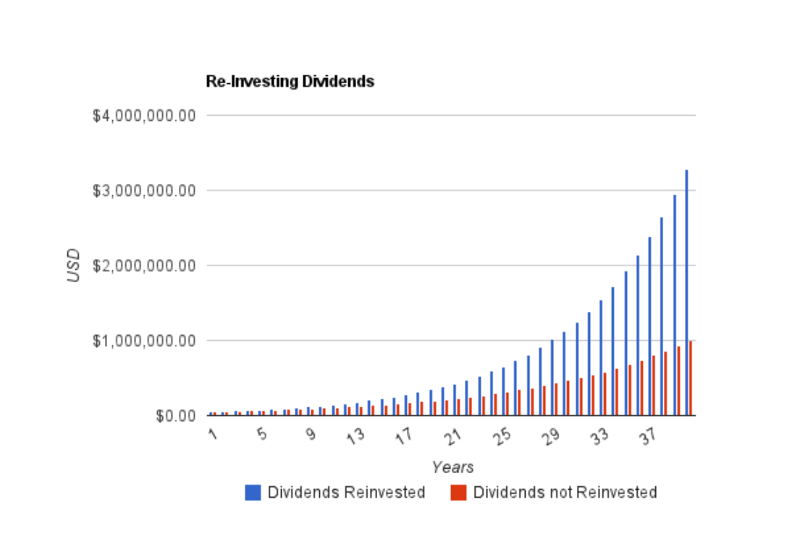
Once the shareholders receive this dividend, they may have the option to accept the cash payment, or reinvest in additional shares (known as a dividend reinvestment plan) and improve their position in the market.

The willingness of the company to pay cash dividends shows a solid financial strength, and positive performance, although that’s not always the case. Sometimes the companies may keep paying dividends, but still be in a poor financial position and eventually shut down.

This is why potential stock owners must be careful when investing and take everything into consideration before they invest in the organization.

Which Company Can Afford to Pay a Cash Dividend Yield?

Many companies have outstanding earnings, and can afford this form of dividend payout. These are just some of the companies that offer dividend payouts across the ASX, NASDAQ and NYSE:

  • IBM
  • AT&T
  • Johson & Johnson
  • QUALCOMM
  • Fortescue Metals Group
  • BHP
  • Magellan Financial Group

More experienced investors can easily determine which company has a solid income statement, and capital, which helps them invest in profitable shares. On the other hand, novice investors may struggle in finding the dividend shares worth investing in.

Potential stock owners must be careful when investing and take everything into consideration before they invest in the organization.

Still, investing in shares that pay these types of dividends can help both new and experienced investors increase capital.

Additionally, those who wish to invest often check out the company’s trailing 12 months (TTM). 

This is a set of performance data that shows how the organization managed finances in the last year. TTM is beneficial for understanding a company’s growth and potential.

Example of a Cash Dividend Payout

Here’s a simple example of a cash dividend:

One investor owns 100 shares of company X. At the end of a quarter, the company X calculates its financial performance for that quarter. 

The board of directors then reviews the information, and decides on a $0.50 dividend per share for the quarter.

This means that the investor is entitled to $0.50 x 100 shares = $50

How Does a Cash Dividend Work?

When a company earns enough, it may decide to distribute part of its earnings to the shareholders. This part of the earnings is most commonly distributed via cash dividends paid in regular intervals, usually quarterly.

While these dividends are a great way of motivating shareholders to stay with the company, they may cause the stock price to drop. Still, investors love companies that offer dividends, as they know they can count on regular payouts.

Why Does a Cash Dividend Matter?

There are many reasons these dividends are important to shareholders. For example, the cash dividends could signal whether the company has good financial health.

It may show that a company is more effective in using its capital, compared to companies that don’t pay dividends.

Dividend payment per stock also increases the chance of shareholders remaining invested in the stock. This means the company’s stock price may stay more stable.

Are Cash Dividends Better Than Stock Dividends?

When it comes to the cash dividend, shareholders have no other option but to either keep it, or reinvest it and increase the number of shares they own.

Even though these dividends are a more common way of paying shareholders, stock ones are sometimes considered better.

When it comes to the cash dividend, shareholders have no other option but to either keep it, or reinvest it and increase the number of shares they own.

With a stock dividend, they can keep the shares or turn them into cash. Plus, stock dividends aren’t treated as taxable, as they’re usually not turned into income.

The Advantages of Cash Dividends

There are many advantages of the dividend payout for shareholders. One of the main advantages is the steady income. These dividend payouts are regular, so shareholders know when they’ll receive the funds.

Regular payouts are especially beneficial for those who build a large portfolio with a view to living on the income.

Receiving dividend payments can also be a good way of establishing a market hedge. This defends the shareholders from the stock price dropping, which often happens during a bear market.

Furthermore, they know that companies that pay dividend yield may be more careful with their financial decisions, as they want to keep people invested in their shares.

The Disadvantages of Cash Dividends

While these types of dividends are common, and can yield great profit for investors, there are certain financial disadvantages for companies.

One of the major disadvantages to paying the dividend is that the money that’s paid to shareowners can’t be used to further develop the business. In a way, paying the dividend prevents the company from investing in increasing sales and profits. Instead, offering a healthy dividend might sustain or even raise the share price — effectively raising capital for the business. 

When it comes to shareholders, dividend payments mean they’ll have taxable income. However, if an investor has an income that’s too low to make them liable for tax, they may be entitled to a refund from the Australian Taxation Office.

Do Cash Dividends Go on the Balance Sheet?

A balance sheet is a financial statement that involves the company’s stock, other assets, liabilities, and shareholder equity. This sheet is also used to evaluate the business.

Dividends do impact the balance sheet, as they will show a decrease in the company’s dividends payable, and financial balance. The balance will be reduced.

To check the total amount of paid dividends, investors should also use a financial statement. This statement shows how much money is entering and leaving the company.

Why Do Shareholders Prefer Cash Dividends?

According to financial theory, investors don’t care much about whether they’ll receive cash or stock dividends, for as long as they have the same value. However, this approach doesn’t include other complexities, such as taxes, transaction costs, dividend payout, demographic attributes of investors, etc.

On the other hand, the theory states that investors would pay additional expenses for receiving cash dividends, and they may prefer them over stock dividends.

Some shareholders would rather pay the taxes and receive cash for their outstanding shares, than receive additional stocks, simply because of direct financial compensation.

Accounting for the Cash Dividend

These forms of dividends are usually accounted for as a reduction of a company’s retained earnings. After the board of directors allows this type of dividend payout, the company debits the retained earnings account, and creates a liability account called ‘dividends payable’.

By moving funds to a dividends payable account, the company reduces equity, which is instantly shown in the company’s balance sheet even though no money has been paid out yet. This, in turn, increases liability.

Once the payment date comes, the company then reverses the dividend payable with a debit entry, and credits the cash account for the cash outflow.

In that way, these forms of dividends don’t actually affect the company’s income statement. Still, all companies that pay these dividends must report the payments in the cash flow statement.

Calculating Cash Dividend

Calculating the dividend payout for the given year is done by subtracting the retained earnings from the beginning of the year from the end-of-the-year numbers.

Based on the complexity of these types of dividends, potential stockholders may struggle in finding the appropriate information they can use to calculate the dividend payout. In general, companies report their dividends in a statement they send together with their accounting summary to their stock owners.

Some organizations share the date in press releases. However, that’s not always the case.

Those who can’t find this data officially, usually consult the company’s balance sheet, which can be found in the annual reports.

Calculating Cash Dividend From a Balance Sheet and Income Statement

If the dividend payout is not explicitly stated in any public document, potential shareholders can look into two things:

  1. Balance sheet
  2. Income statement

The balance sheet is a record of the organization’s assets and liabilities. This document reveals how much the organization has kept in terms of retained earnings. Retained earnings are all earnings of the company that weren’t paid out as dividends.

The second document, which can be found in the annual report, measures the organization’s financial performance for a certain time period. The income statement shows how much net income a company had during a certain year.

This document helps determine what changes would occur in retained earnings if the organization had decided not to offer a dividend payout for that time period.

Calculating the dividend payout for the given year is done by subtracting the retained earnings from the beginning of the year from the end-of-the-year numbers.

This will give the net change in retained earnings, which should then be subtracted from the net income for the year.

The final number shows the total amount of dividends paid during the stated period.

Cash Dividend Per Share Formula

Those who wish to do their own accounting can easily calculate the earnings they receive from per-share dividend yield. After purchasing a stock that pays dividends per share, the shareholder would usually get quarterly dividend checks.

To find the dividend payment per share, the quarterly dividend payout should be divided by the number of shares.

To get annual numbers, the shareholder can multiply the quarterly dividend yield by four.

However, with Navexa, there’s no need to use complicated formulas to calculate the growth of a portfolio. 

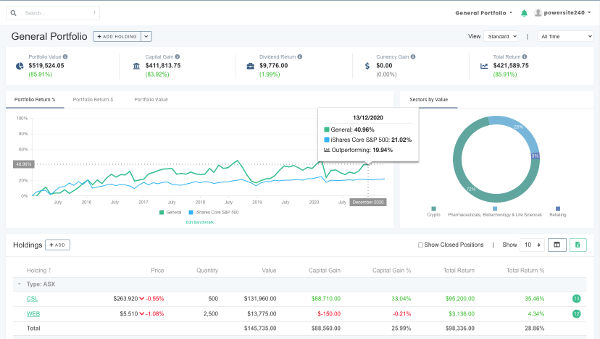
Navexa is a smart portfolio tracker that manages accounting for its users. Our app makes investing simple, as it automatically calculates portfolio changes.

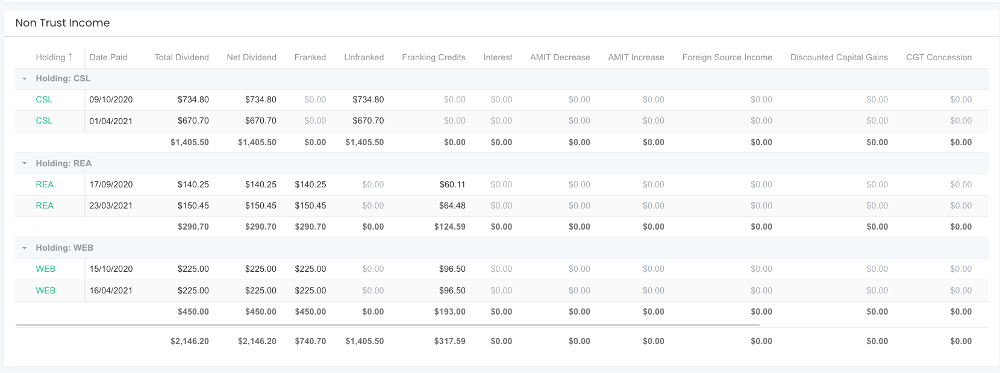
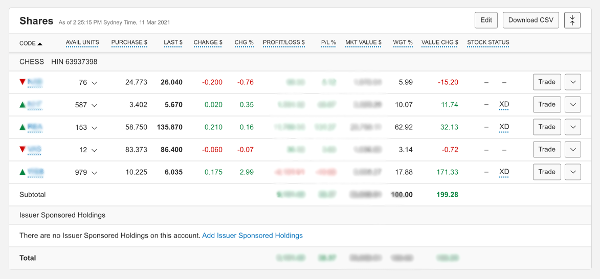
Navexa tracks and records every dividend payment — cash and reinvested — in a portfolio and provides insights into which holdings are earning the most and least in a given period. 

Plus, Navexa can annualize portfolio performance, and automate portfolio income tax reporting.

the Navexa portfolio tracker
The Navexa Portfolio Tracker allows you to track dividends alongside capital gains, trading fees & more.

Final Word On Calculating Cash Dividends

Owning dividend-paying stocks is an attractive proposition and a key part of many investors’ long-term wealth building strategies.

But while earning income from an investing is good, it’s vital that investors keep track of their dividend performance — whether that’s from cash dividends or reinvested dividends. 

This is important not just to understand and analyze how much a portfolio is generating in income (and how much that income contributes to overall performance), but because investment income is taxable.

Tax reporting requirements require that investors provide full details of their investment income.

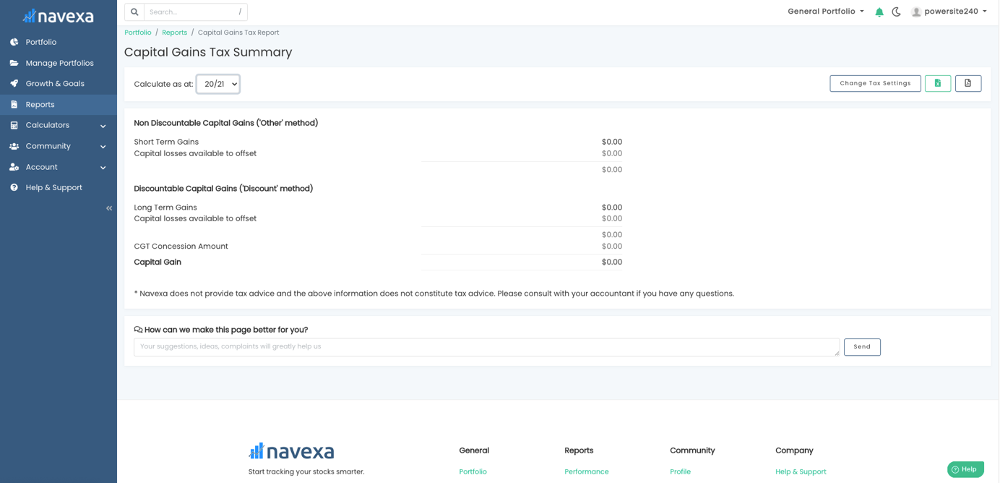
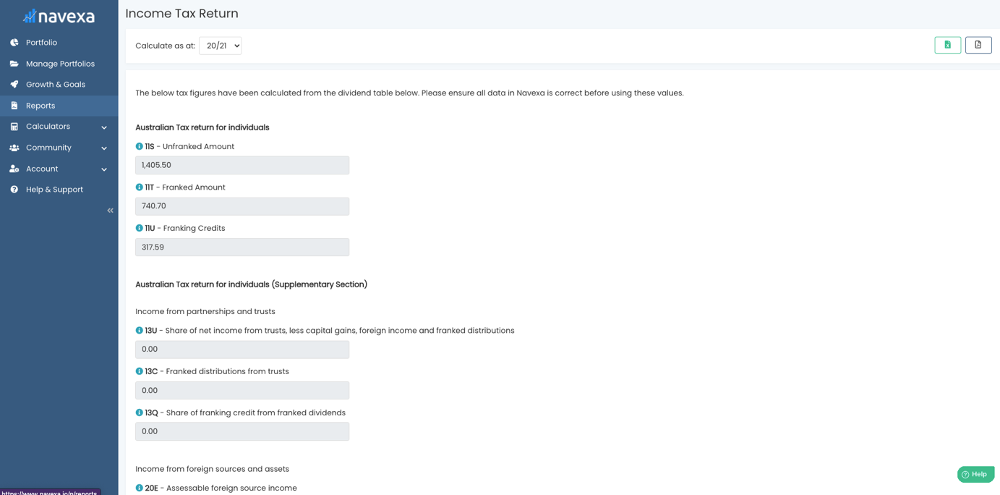
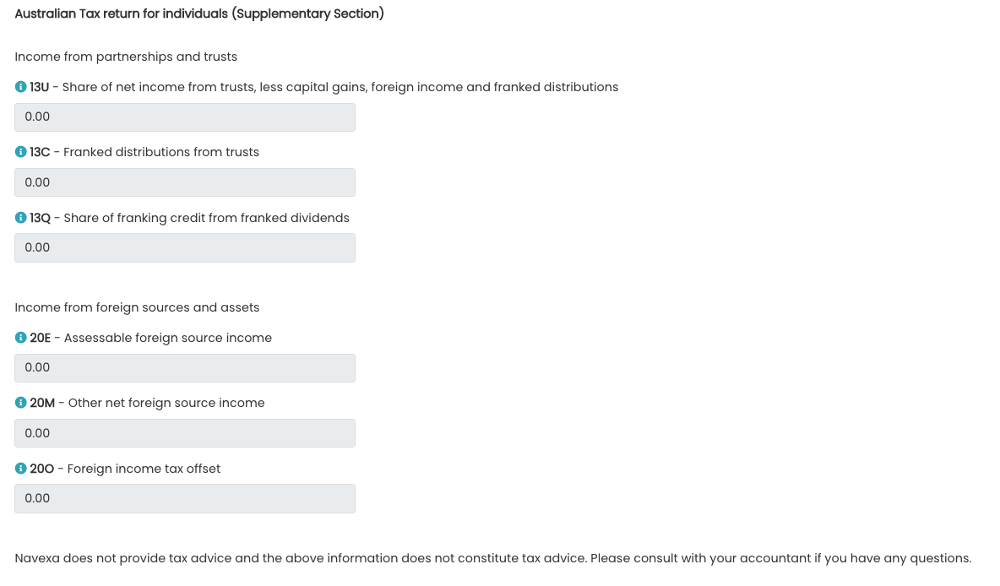
That’s why we’ve built the Navexa portfolio tracker’s automated taxable income calculator. The tool calculates every last cent worth of income an investor needs to report for a given tax year, including details on franking credits (for Australian investors). 

It’s part of our mission to empower investors to build brighter financial futures with simple, but powerful, automated investment analytics and reporting tools.

Categories
Financial Literacy Investing Tax & Compliance

Investment Tax Basics: Capital Gains, Dividend Income & Tax Implications

If you invest in Australia, the Australian Taxation Office requires you pay tax on both capital gains and dividend income. Here are some basic things to know about paying tax on your investments in Australia.

Paying a portion of our income to our government has long been a fact of life — the phrase ‘certain as death and taxes’ stretches back more than 300 years.

In Australia as elsewhere, this goes for income we earn from employment, a rental property, and other sources. It also applies to investment income.

Below, you’ll find information (general, of course, and not in any way to be considered financial or taxation advice!) about:

  • The Australian tax year and cycle.
  • Capital gains tax (CGT) events for investments (long and short term).
  • Taxable investment income from dividends.
  • Different ways you can report on your investments for tax purposes.
  • Tax benefits from ‘franked’ dividends.

Let’s start by explaining the Australian tax cycle.

Tax Time: Key Australian Dates

These are the key dates to keep in mind for calculating your portfolio tax and filing your tax return in Australia.

The income year for tax purposes — otherwise known as the ‘financial year’ — goes from July 1 to June 30.

This is the period for which you’ll need to collect and collate your financial information for assessment during the period known as ‘tax season’.

Australian Tax Season

Tax season runs from the start of the next financial year (July 1) to October 31 — a period of four months.

If you’re lodging your own tax return, you have until October 31 to do so. If you use a registered tax agent, you have a little longer — usually May 15 the following year.

Check with your accountant or the Australian Taxation Office (ATO) to ensure the key dates for your specific situation.

If you’re an investor, you’ll need to report on your portfolio’s activities during the relevant financial year. Here are the main things you’ll need to consider as an individual.

Capital Gains Tax On Investments In Australia

Australian tax law specifies that you must pay tax on any assets you own when you sell them, or when another ‘CGT event’ happens to them.

At its most basic, this refers to selling shares. But it covers many other events, too, including switching shares in a managed fund between funds and owning shares in a company which another company takes over (or merges with).

What Is The Capital Gains Tax Rate?

Australians pay CGT on their investments at the same marginal tax rate they pay on their personal income for the financial year.

So, for example, if someone earned $100,000 from their employment and also made $20,000 from selling shares they’d held for more than 12 months, their marginal tax rate would be 32.5% — meaning they would need to pay $6,500 in tax on the capital gains from their investments.

The CGT rate differs for individuals, companies and self-managed superannuation funds.

If someone sell some shares for a capital loss, this may result in tax benefits, since they can deduct that loss from any gains they may have realized on other assets. If they didn’t make any capital gains (only losses) in a given financial year, they can carry a capital loss over to other financial years!

Long Term & Short Term Capital Gains

Australian tax law makes a distinction between long term and short term capital gains. This is effectively an incentive for investors to hold investments for more than a year at a time.

In the example above, where someone makes a combined $120,000 in the financial year from their employment and selling some shares, they’ve held those shares for less than 12 months.

This means they pay the same tax on their investment profits as they do their personal income (for tax purposes, capital gain profit gets added to other income to determine the marginal tax rate).

But if that person held the shares for more than 12 months, they’d qualify for a 50% CGT discount. Instead of paying $6,500 of their $20,000 capital gain, they’d only need to pay $3,250.

Learn more here.

How To Calculate Your Portfolio’s Capital Gains Tax Obligations In Seconds

Bearing in mind we’re only talking about the capital gain side of portfolio tax, it’s easy to understand why so many of us don’t exactly look forward to tax time.

Navexa’s tax reporting tools are powerful ways to remove the need for someone to have to manually calculate — or pay someone to manually calculate — their portfolio tax obligations.

Navexa’s CGT Reporting Tool

Navexa’s Capital Gains Tax Tool

What you see above is Navexa’s CGT Report.

Once you track your investment portfolio in a Navexa account, you can access a suite of analytics about everything from individual holding performance through to portfolio contributions, and of course tax analysis.

Provided the portfolio data in your account is correct and up to date, you can run an automated tax report in literally a few seconds.

The CGT Report Breakdown

As you can see in the sample image above, Navexa calculates your taxable capital gain and displays a detailed breakdown.

Under ‘Non Discountable Capital Gains’ you have: 

  • Short Term Gains: The capital gains you’ve made on assets sold within 12 months of buying them.
  • Capital losses available to offset: Any capital loss you’ve realized by selling assets for less than you paid for them.

Under ‘Discountable Capital Gains’ you have:

  • Long Term gains: The capital gains you’ve made on assets sold after holding them for 12 months or more.
  • Capital losses available to offset: Any losses realized from assets you’ve sold after holding longer than 12 months.

Then you have your CGT Concession Amount and, finally, your total Capital Gain for the portfolio (for the financial year and tax settings you’ve selected).  

It’s important to note that Navexa doesn’t provide tax advice. But as long as your account information is accurate and up to date, this should be all you need to file your return.

At the top right of the report, you’ll find buttons for exporting the report as both an XLS and PDF file.

So now you understand the basics of capital gains tax for investments.

Let’s dive into the income side of the portfolio tax equation.

Investment Income Tax

Capital gains isn’t the only form of investment income people pay tax on in Australia. Just like income from a rental property, dividends count, too. You must declare investment income.

Dividends, of course, are payments made to shareholders as a percentage of an investment’s profits. These profits have generally already been subjected to Australian company tax. Thus, the ATO doesn’t tax shareholders again on the already taxed profits when they’re distributed as dividends.

Franking Credits

This is where ‘franking’ credits come in. If a dividend is ‘fully franked’, it means the ATO judges it has already been taxed appropriately.

Depending on where an investor’s personal tax rate falls relative to the rate at which their dividends have been taxed (and had the appropriate franking credits distributed with them), they’ll either pay less than their personal tax rate (a tax offset) or, in some cases, a tax refund.

This is a great guide on dividend franking.

How Australian Tax Law Treats Dividend Reinvestment Policies

Some companies allow investors to receive dividends in the form of new shares instead of cash. This is known as a dividend reinvestment policy.

For tax purposes in Australia, the ATO treats dividend reinvestment the same as cash dividend.

If someone receives new shares instead of a cash dividend, they need to pay tax on them as though they did receive cash.

Like a cash payout, reinvested dividends may be partially or fully franked, since they still represent investors receiving a portion of profits.

How To Calculate Your Taxable Investment Income Obligations In Seconds

Navexa doesn’t just allow you to skip the hassle of working out your portfolio’s capital gain for a financial year.

It also lets individuals drastically accelerate the process for determining their taxable investment income, too. Take a look:

Navexa’s Taxable Income Reporting Tool

Navexa’s Taxable Income tool

When you automate your portfolio tracking in Navexa, the taxable investment income tool gives you everything you need to know when preparing your tax return.

You can see unfranked and franked amounts of investment income across your portfolio and the actual franking credit amount.

In the ‘Supplementary’ section, you’ll see six other fields:

The Taxable Income Report Breakdown

  • Share of net income from trusts, less capital gains, foreign income and franked distributions
  •  Franked distributions from trusts
  • Share of franking credits from franked dividends

And in the ‘Income from foreign sources and assets section’:

  • Assessable foreign source income
  • Other net foreign source income
  • Foreign income tax offset

Below the return fields you’ll see a holding by holding breakdown of your taxable investment income, like this:

This shows you subtotals for payments from each holding, and grand totals for each column at the bottom.

At the top right of the report, you’ll find buttons for exporting the report as both an XLS and PDF file.

This is the automated way to fast-track preparing to declare investment income for assessment.

Simplifying & Accelerating Investment Tax Reporting

We hope you’ve enjoyed this guide to the basics of portfolio tax in Australia.

We’ve covered the main points of tax implications for both capital gains and investment income (including franking tax offset).

There are, of course, many more scenarios and details than what we’ve had time to cover today.

As always, consult your accountant or seek other professional advice, and ensure you manage your tax obligations and tax return responsibly.

Try Navexa Today

Navexa empowers investors to build brighter financial futures with simple, but powerful, automated investment analytics and reporting tools.

The CGT and Taxable Income reporting tools we’ve detailed here are just two of the tools at your disposal when you automate your portfolio tracking with Navexa.

Sign up free here and explore them now.

Categories
Financial Literacy Investing

Thinking Long Term: Investing Your Way To Financial Freedom

Powerful ideas on building life-changing wealth — from passive income investment strategies to staying calm through stock market crashes and financial crises.

How much do you think a person needs to invest to make a million dollars?

$100,000? $250,000?

Try $1,525.

If you invested $1,525 today in a fund that tracked the Australian stock market’s growth over the next 20 years — and you committed to investing that much every month — your portfolio would grow to just over $1 million.

(That’s based on the Australian market’s annualized performance over the 20 years to December 2017.)

While past performance is never any guarantee of future returns — and this post most definitely does not qualify as financial advice — going by that historical return, a meagre $352 a week is all it would have taken to build a million-dollar portfolio in those 20 years.

When you consider that putting that much into a savings account would have yielded not even half that over the past 20 years, it’s clear why some of us are prepared to accept more risk when we’re considering which long term investments we want to put our money in.

It seems simple, doesn’t it? Creating a significantly brighter future financial situation for yourself (and your family) is a matter of socking away money on a regular basis — personal circumstances permitting, of course — and letting the market work its magic.

As you’re about to see, executing a successful long term investment strategy isn’t as easy as it may seem.

You need some key ingredients: Financial education and literacy, clear investment objectives, a solid grasp of personal finance, and a specific investment timeframe or horizon, to name a few.

This post introduces some key ideas around investing for long term success and financial freedom.

Read on to discover some of the fundamental ideas and factors for those looking to build long term, life changing wealth through consistent and patient investing.

Examples Of Long Term Investment Strategies’ Epic Performance (Despite Multiple Stock Market Crashes)

Seth Andrew Klarman is a billionaire. The private investment partnership he founded in 1982 has realized a 20% compounded return for the past 40 years.

Let that sink in for a moment.

Twenty percent a year. For 40 years.

What started as a $270 million fund has grown to be worth around $270 billion.

In that time, the US stock market has, according to Wikipedia, crashed 10 times.

The 1987 Black Monday crash alone was enough to inflict serious, lasting financial damage to someone in my own family. The rest of their life they had to live with consequences of having sold in panic as investors all over the world rushed to get out.

But over Klarman’s 40 years running his investment portfolio, none of the 10 crashes have, in the long term, impeded him from racking up what most of us would agree is insane wealth.

According to him:

The daily blips of the market are, in fact, noise — noise that is very difficult for most investors to tune out.

‘Klar’, by the way, is German for ‘clear’.

Whether or not Klarman’s name had any bearing on the way he viewed the markets during his four decades (so far), it’s certainly clear that ignoring the so-called ‘noise’ in favour of a long term strategy has been immensely profitable for him and his investors.

Noise: The Enemy Of Successful Long-Term Investing

When we talk about market noise, we’re talking about a lot of things.

Daily price movements, economic changes that impact the markets, like interest rate rises, and news flow are three common examples.

Even the talk of interest rate rises — amplified of course by the media — has been causing market jitters in early 2022.

Here’s a quick example of just how useless most noise is — and why smart investors like Seth Klarman ignore it, preferring instead to focus on their strategy.

https://twitter.com/BackpackerFI/status/1469366461407772675

The chart shows you the S&P500 index between 2009 and mid 2017. As you can see, annotated along the line is every time the financial media claimed ‘the easy money has been made’.

In other words, nine times they claimed the good times were over for the S&P500…

That things were about to get tough for investors…

That you should perhaps be scared about what was about to happen to the stock market.

And yet, while in the short term the S&P500 did indeed fluctuate — sometimes severely and abruptly — over the seven-and-a-half years this chart shows, it still doubled in value.

We can’t know how many people were scared into selling their stocks each time they read a ‘the easy money…’ headline. But, you can bet there were quite a few.

I know people who won’t even get into the stock market on account of the fact values can fall, let alone stay in stocks they own through volatile or uncertain times. Such is their appetite for investment risk (zero).

Getting back to Seth Klarman’s point…

Successful Long Term Investing Demands That You Can Stomach Volatility, Noise & Risk

‘Get rich quick’ has become virtually synonymous with ‘scam’. You read those words and you know there has to be a catch.

While it’s true that some investors do bag huge gains from speculative investments like penny stocks, it’s very rare that they’re able to repeat those successes by applying any sort of discipline or formula.

Getting rich quick, we could say, depends on luck. You have to be in the right investment at precisely the right time and you have to sell it before it plummets back down to earth (as many do).

Getting rich slowly, on the other hand — building financial freedom and exponential wealth by investing like the Seth Klarmans and Warren Buffets of this world — depends on something else.

Building financial freedom through investing depends on discipline.

As you’re about to see in this post, you have to cultivate discipline around your saving, spending and investing habits. You have to be honest with yourself about your goals. You have to understand how much risk, volatility and stress you’re prepared to tolerate. You have to start thinking in decades, not years — and certainly not months or weeks.

In other words, you have to find or create a long term investing strategy that you feel comfortable and confident is going to result in the financial freedom you seek.

And, of course, you have to get wise to short-term market noise like attention-grabbing headlines about the easy money having already been made.

What follows are some generally-agreed upon solid ideas and approaches from both the investment industry and the financial freedom (or FIRE) community.

(Again, NOT financial advice 🙂)

Find Your Investing Mindset & Bring Order To Your Finances 🔥

If you’re yet to begin investing, or you’ve started but are still caught up in the idea of getting wealthy fast, then you need to lay the groundwork for your strategy.

A solid long term wealth building strategy can’t exist without a strong foundation of financial literacy, discipline and clarity.

This means you need to get into the weeds on every aspect of your financial life.

You need to have a firm grasp on your whole financial position as it stands: Income, debt, expenses, savings, everything. Why? Because successful investing — no matter whether you’re aiming to make $100,000 or $100 million — depends on a few key principles.

Three Rules For Investing Long Term

Here are three tenets the FIRE community generally accepts as foundations for building wealth:

  1. Spend less than you earn.
  2. Invest the difference.
  3. Continuously look to widen the gap between what you spend and what you earn.

If you don’t fully understand your personal finances, you’re not going to be able to confidently and consistently spend less than you earn.

And consistency, as many in the investing world can attest, is crucial to successful long term investment strategies.

The Power Of Investing Consistently Over The Long Term

Take a look at this:

Source: https://www.lynalden.com/build-wealth/

This table shows you how much your portfolio would be worth 25 years from now based on different monthly investments, which you can see on the Y axis, at different annual rates of return, which you can see along the X axis.

As you can see, just $750 a month ($9,000 a year) has the power to become more than $1 million.

That works out at $173 a week. So when you see a table like this, ask yourself:

How much money are you prepared to commit to become a millionaire?

If you’re not — or if you don’t have $173 a week at your disposal — then you need to assess your goals, priorities and your financial position.

Remember, the first rule is that we should spend less than we earn and invest the difference.

The Australian stock market returned an average 9.7% between 1991 and 2021, according to Canstar.

Going by the 25-year table above, a monthly investment of $1,500 would hit $1 million at that rate.

As you can see, the most powerful factor here is time. Remember Seth Klarman’s portfolio performance and opinions regarding ignoring market noise.

And consider this:

Choose A Strategy (And Commit To It)

There’s no end to the opinions and advice out there about exactly how one should set about building long term wealth in the stock market.

Only you can determine your goals, values and risk tolerance.

Fortunately, we’re living in a time when there has never been such a plentiful and wide range of opinions and advice.

This section details three broad investing strategies commonly employed by long term investors.

First, a word of warning on getting too caught up in other people’s ideas about investing success (or any success, for that matter):

While there’s lots to learn and much to gain from following in the footsteps of great investors, it’s important your investment strategy suits you first, not someone else.

(If I had a dollar for every person who says they subscribe to ‘the Benjamin Graham method’, I wouldn’t need my own investment strategy.)

Idea #1: Buying Exchange Traded Funds

Exchange traded funds, or ETFs, have been growing in popularity in recent years — particularly among the FIRE community.

You can buy an ETF like you would any shares on the stock market. The difference is these funds are structured to track indexes, sectors and other specific market themes.

For example, I recently bought shares in an ETF that tracks the Dow Jones technology index. This means I’m exposing my capital to the progress of that entire market, as opposed to picking out a particular company to invest in.

Many long term investors and financial freedom seekers favour ETFs as they are relatively ‘low touch’ — you can buy them easily and bypass the need to conduct research into individual securities.

Think of ETFs as a door through which you can access different parts of the markets and financial system. You might choose an ETF than tracks growth stocks in Asia. Or, you could choose one that tracks a particular commodity or currency pair. Index funds, while different investment vehicle, can service a similar function, as do mutual investment funds.

Idea #2: Buying Growth Stocks & Value Stocks

While you can bypass researching individual stocks using ETFs or index funds, you might actually prefer to invest directly in particular stocks.

One thing you’ll need to understand when building and managing your investment portfolio is diversification. This is a good place to start.

If the risk tolerance, strategy and investment timeline allow for it — and if an investor can commit to doing in-depth market and company research — they may choose to invest in companies.

While there’s a lot of different types of companies trading on the stock market, from the miniscule (speculative penny stocks) to the mammoth (Tesla, for example), across all sorts of criteria and risk profiles, let me introduce you to two types you might find in a long term investment portfolio.

Pocket Rockets For Your Portfolio 🚀

Growth stocks are the jet boats of the stock market. They’re exciting, attention-grabbing companies that carry both higher promise and higher risk relative to more established, stable companies.

These stocks often tend to be technology companies, and are often smaller companies that are in the midst of capturing market share. According to Bankrate, these companies ‘generally plow all their profits back into the business’, since they’re in the process of expanding. This means they may be less likely to pay dividends to their shareholders, who rely instead on rising valuations to generate returns on their investments.

Growth stocks don’t necessarily have to be small-cap companies. Generally speaking, investors probably need to be prepared to be more active when it comes to owning a growth stock, since their value can rise and fall faster than blue chip companies. This means a ‘set and forget’ strategy which may be appropriate for ETF investing may not apply to riskier growth stocks. 

Buffett’s Favourite Types Of Companies 🛳️

Value stocks, on the other hand, present a very different prospect for an investing strategy. If growth stocks are jet skis, value stocks are a cruise ship.

In basic terms, a value stock is a company that is trading at less than their ‘true’ value. How you determine that value isn’t an exact science. There are several methods you can use to calculate whether a company’s share price is trading at a discount on its fundamental value (one of the most common methods is the discounted cashflow calculation, which you can run in our portfolio tracker for free).

Value stocks often display high dividend yields and low price-to-earning ratios. They tend to be big companies that don’t have much room left to grow relative to their smaller, more dynamic counterparts, but which can also produce higher long-term returns (even if they may not deliver spectacular short term gains like a growth stock).

Value stocks might suit more of a low-touch, buy-and-hold type of investment strategy. For many seeking financial freedom, the prospect of lower share price volatility and a steady stream of dividend income makes value stocks a sensible inclusion in their portfolio.

It’s worth noting as well, that there are ETFs on the market that track value stocks — meaning you don’t necessarily have to approach value investing company by company.

Idea #3: Dividend Stocks & Passive Income 💵

For many on the financial freedom trail, dividends are king. Here’s why.

Source: https://www.dividendmonk.com/reinvest-dividends/

What you see here is the power of income in a long term investing strategy.

The red bars represent the annual returns over 40 years of holding a stock that rises an average 8% a year and collecting the dividend payments as cash.

The blue bars show you the same investment with reinvested dividends over the same time period.

If you held the stock and pocketed the dividend cash, after 40 years a $50,000 investment would have grown to around $1 million.

But if you reinvested those dividends — meaning you opted to receive additional shares as opposed to cash — you would end up with more than $3 million.

That’s a substantial difference. Of course, the example doesn’t account for what you could have done with the cash if you’d taken it instead of reinvesting it (more on that below).

Why Income Investing Suits Long Term Investment Strategies

Remember the three points from the start of this post:

  1. Spend less than you earn.
  2. Invest the difference.
  3. Continuously look to widen the gap between what you spend and what you earn.

You can understand why income investing is so attractive for those seeking financial freedom.

Dividend reinvestment hits all three of these action items. This is why so many investment strategies include income investments.

Once I’ve bought your shares and committed to leaving them for a long period, I don’t need to put any more of my regular income into the stock.

As the stock pays me dividends in the form of more shares, I automatically invest the difference.

And, even better, the more shares I accumulate through dividend reinvestment, the more I widen the gap between what I spend and what I earn (remember that in the example above I start with just $50,000 and end up earning nearly $3 million through capital gains and reinvested income).

Einstein’s Theory Of Compounding Investment Returns 🔬

Income investing is popular for good reason. Especially with those looking to invest for long term wealth.

If you decide to make dividend stocks (or ETFs — remember ETFs exist for most markets and sectors, and you can find plenty of income-focused funds on the market) part of your long term investment strategy, you’ll be in good company.

Legend has it that someone once asked Albert Einstein what he thought was the eighth wonder of the world.

His response: ‘Compound interest’.

He who understands it’, Einstein said, ‘earns it. He who doesn’t, pays it’.

Wise words worth keeping in mind as you assemble your plan to build long term financial freedom!

Aim For ‘Infinite’ Investment Returns ♾️

If this sounds a little ‘hidden secrets of the rich’, that’s because it is.

Infinite returns are ultimately what you should aim for if you aspire to the sort of financial freedom the world’s wealthiest long term investors are able to enjoy.

The idea behind the term is that you buy an investment, which makes you money (either through capital gains, income, or both) and then you sell your initial stake at a certain point.

For example, say you buy $50,000 worth of shares in an ETF that tracks relatively stable, income-paying companies. You leave it alone for five years. Between capital gain and reinvested dividend income, your position grows to be worth $100,000. Then, you take out your initial $50,000, and leave the investment to run on profits alone.

If you consider the dividend reinvestment illustrations above, just imagine that the $50,000 you start with in the 40-year example was the result of profit from a previous investment.

The, imagine you do it again. What started as $50k profit becomes the capital for a new investment. Then that investment generates its own profit, allowing you to free up the $50k and continue ‘cycling’ through new opportunities.

This is the essence of infinite investment returns. Of course, this explanation makes it sound super straightforward. Like everything in the investing world, this strategy carries risk.

But when you adopt the long term investing mindset…

And you’ve learnt to ignore the market noise that triggers so many into FOMO buying and panic selling (I literally saw this in the course of writing this post)…

And you’ve structured your personal finances in such a way that consistently investing in the assets you want your money in for the long term without adversely impacting your day to day…

Then the prospect of infinite investment returns becomes more and more attainable the longer you stick to your plan.

If buying a lotto ticket is one extreme of the investing world, then infinite returns are the opposite extreme. They don’t happen overnight and they take time and sacrifice to create.

As Blake Templeton, of Forbes, points out, building wealth is a long term game.

Those dreams of hitting it big in the stock market are exciting, but they rarely come true. Instead, focus on building long-term wealth that grows consistently over time, like the super-rich. When you use their same strategies for wealth-building, you set yourself up for exponential gains that you can pass down to future generations.’ 

Takeaways: Continuously Invest In Knowledge — And Track Everything As You Go 📈

Perhaps the most important investment you’ll ever make on your journey to financial freedom through long term investing is in yourself.

(Yes, you’ve probably read versions of that a thousand times on Twitter. But it’s for a reason!)

At a high level, you have to back yourself to create the discipline, strategy and trajectory that will allow you to realize your vision of financial freedom.

Once you’re making progress though, it’s not only financial assets you need to invest in. You should also make time to build your knowledge of finance, investing, economics and useful information about the wider world (as opposed to ephemeral, short-lived ‘noise’).

That means making connections, reading books, listening to podcasts and following blogs (like this one, obviously). Like everything in life, the investment world never stays still. Change is constant and often dramatic.

Trends shift and investment strategies that work today may no longer work next year — see the ructions over the US Federal Reserve’s announcement about (finally) raising interest rates in early 2022.

Make sure you have good sources of information to keep building your financial literacy and stay informed of the deep themes and trends at play in the world and its markets.

Track & Analyze Your Portfolio Consistently

Most of all, make sure you have good sources of information about your own financial position and portfolio progress. As Peter Drucker points out:

What can’t be measured, can’t be improved.’

As so many people have found when they start tracking their fitness, their diet or their personal finances, you start behaving differently when you can fully grasp your long term progress.

Long term investing is no different.

Whether you’re investing $500, or $1,000, or $5,000 a month towards financial freedom decades down the line, you’re going to need to accurately track your progress.

This is what we specialise in here at Navexa — advanced investment analytics for everyday people looking to build long term wealth.

Navexa portfolio tracker
The Navexa Portfolio Tracking Platform

If noise is the enemy of long term investing, then proper portfolio tracking is one of your best defences against it.

Try tracking your investments in Navexa for free today.

Categories
Financial Literacy Financial Technology Investing

Why Your Brokerage Account Might Not Reflect Your True Portfolio Performance

Your trading account is designed to help you buy and sell investments. While it shows you a bunch of metrics related to your portfolio, it might not reflect your actual returns or performance. This post explains the difference and shows you why tracking is arguably as important as trading itself.

As a dedicated portfolio performance tracking platform serving thousands of people, the team here at Navexa communicate with our community frequently.

One of the most common questions we receive from those just beginning their portfolio tracking journey with us, is this:

Why are the investment returns in my Navexa account different from those in my trading account?’

Many of our new members are accustomed to viewing their portfolio performance through a very different lens from the one Navexa provides.

That’s because the numbers you see when you log in to your trading account aren’t so much to do with portfolio performance as they are with nominal ‘gains’ or changes in value.

In a portfolio tracker, you’re seeing your rate of return, or growth rate, over time.

In this post, we’re going to explain the difference.

We’ll explain why, in our (biased) opinion, you won’t get a clear and complete picture of your long-term investment returns from checking your trading account alone.

We’ll explain how the figures you see differ both in their calculation and the information they reflect.

We’ll touch on the extent to which brokerage fees and commissions impact your portfolio performance — and why your trading account may not reflect that impact.

We’ll explain how an investment’s true performance differs from its gains, and share with you exactly how our portfolio tracking platform calculates that performance.

And, we’ll show you how to access our purpose-built portfolio performance tracking platform free today so you can see for yourself the difference from the numbers in your trading account.

Let’s start with the key differences between trading account numbers and those in a portfolio tracker.

Trading Accounts Are For Trading — Not Portfolio Performance Tracking

In our CommSec Review, you’ll learn my honest opinion about using Australia’s most popular trading platform.

 As a trading platform, it’s great. But, as I argue in the review:

‘Having been in the market since 2013, and done my fair share of buying and selling, all I can see are two performance metrics: Today’s Change, and Total Profit/Loss.

‘To be blunt, that’s not enough for me.

‘Why?

‘Because portfolio performance is a lot more complex than just my total profit or today’s change. 

I need to see lots more.’ 

I can see today’s change in both dollar and percentage terms, my total profit/loss, my portfolio’s current market value, and the total cost (which, as you’ll see, isn’t actually my total cost).

Below this portfolio level information, there’s a holding-by-holding breakdown. This shows me the price I bought each investment at, the last price it traded for, the day’s percentage change and so forth.

Take a look:

CommSec-Review

That’s all the information available to about how my investments are progressing. Frankly, it’s not enough to satisfy my appetite for data on my journey to creating long-term wealth through investing.

Which is why I’m in favour of using a dedicated portfolio tracker.

As I said, given that we operate one such tracker, this is obviously a biased opinion. But take a look at this screen compared with the one from my trading account:

portfolio tracker

That’s the Portfolio Performance Report in Navexa. Rather than providing just a handful of metrics about profit/loss and price changes, this screen shows four key metrics:

Total Return: In both dollar and percentage terms, the Navexa portfolio tracker shows me my portfolio’s actual, annualized return net of trading fees, income and currency gains (or losses).

Capital Gain: This shows me how much of my total return is comprised of capital gains across my investments. Again, this is annualized to reflect how long I’ve been running this portfolio (otherwise, my ‘gain’ would be the same regardless of whether it had taken me one year, or twenty, to achieve).

Dividend Return: This shows me how much of my annualized return over a given time period is down to my investments generating dividend income. In my CommSec account, for example, I can’t see my income factored into my portfolio performance.

Currency Gain: While not applicable in the example above, the reality of investing across multiple markets and currencies is that foreign exchange fluctuations impact a portfolio’s returns. A dedicated portfolio tracker, like Navexa, shows this.

You’ll also see, beneath the metrics I’ve just detailed, there’s another row showing the same numbers for IOZ, a leading ASX200 ETF.

This allows me to see at a glance how the portfolio is performing relative to the ASX200 across each of these factors. In the example, you’ll see that while the annualized return and capital gain is outperforming the benchmarked fund, it is lagging behind with respect to dividend income.

This is a valuable insight — and not one I can easily get by looking at my trading account.

In the holding list below, you can see the performance breakdown for each of the investments in the portfolio.

All the numbers you see reflect more than just the price movement of the investments. Here’s an example.

Fees & Commissions Impact Your Performance (But May Not Be Reflected In Your Brokerage Account)

My trading account doesn’t show me how fees are impacting my performance. That’s probably because I pay my broker to execute my trades for me. But consider this:        

Let’s say I make 50 trades a year for 10 years at a cost of $20 a trade.

That’s $10,000. At the end of the 10 years, say I have 50 investments in the portfolio. When it’s time to sell out and collect the cash I’ve (hopefully) earned as the portfolio’s total value has appreciated over that time… that’s another $1,000 for all the sell trades on the 50 holdings at the end of the period.

The impact of fees? $11,000.

If the portfolio had started with $50,000, and we assume a 100% total return over the 10 years (that’s a 7.18% annualized return), the investor has, on paper, doubled their money.

Hooray! Right? Not quite. 

You can see how this plays out in terms of actual portfolio performance.

For our purposes in this post, I hope you can see that trading fees play a major part in determining your true performance. Which is why you need to be able to easily see your returns net of that impact — as opposed to hidden away, as they are in many trading accounts.

Fees Aren’t The Only Factor: A Dedicated Portfolio Tracker Helps You Measure Everything Impacting Your Performance

While my CommSec account is, in my opinion, brilliant for conducting market and investment research (their tools and resources are second to none across Australian trading platforms), it’s severely limited in showing portfolio performance details.

When you really dive into the world of long-term wealth building, there are four factors that deeply affect your real returns.

Remember, I’m not talking about gains here. I’m talking about our net performance after every factor impacting a portfolio has been accounted for.

Here are the four factors:

Time: While it might be tempting to look at your overall returns going all the way back to the first day of a portfolio’s life, this can result in us misinterpreting our performance. My favourite illustration of this? Would you rather make a 500% return over one year, or 10? There’s a huge difference, and we all know it. Leaving time out of our portfolio performance calculations is straight up wilful blindness.

Trading Fees: As we lay out in detail, trading fees can and often do have a significant impact on portfolio performance. Looking at your tasty triple digit ‘gain’ in your trading account might feel nice, but when you add up the cost of all the buying and selling it’s taken to achieve that gain, the reality is probably not quite so glorious.

I have a friend who sold some crypto recently and, thanks to my incessant nagging about true performance, accepted that, while they’d made a healthy profit, they’d handed over a huge percentage in exchange and account fees.

Income: This one’s a counterbalance to time and trading fees. If I have a $100,000 portfolio that generates $10,000 in income every year, that’s a massive factor in my overall performance and returns. While my trading account only shows me my capital gains on an investment, my portfolio tracker shows me my total return including dividend income — and breaks down how much of my return constitutes income versus capital gains.

Taxation: Now this one’s a little different. But the reality is — especially for those of us investing with a view to financial independence or early retirement — we must pay a significant percentage of our profits to the government when we sell out of investments. This is important to consider when you’re assessing what you’ll gain from buying and selling stocks. It doesn’t impact your portfolio performance per se, but it does massively impact your financial outcome as you draw down or completely exit a portfolio.

(FYI: Navexa provides automated CGT and income tax obligation reports, plus an Unrealized Capital Gain report to help you assess and forecast your portfolio’s taxes.)

Currency gain is also important, but of course not all of us invest beyond our home markets. In Australia, in fact, the majority of investors doesn’t stray beyond the ASX, although this is gradually shifting as more services arrive to facilitate offshore investing through new platforms and apps.

Another point here is that Navexa’s portfolio performance calculation is money weighted. That means it accounts for inflows and outflows of cash in your portfolio. This is because the reality for many of us isn’t as simple as making an initial investment and leaving it alone. Rather, we buy and sell as we go.

A money weighted return is different from a time weighted return, which doesn’t account for cash inflows and outflows.

Navexa portfolio tracker

How Navexa Tracks Your Portfolio’s Performance With Automated Accuracy

When I set out to build Navexa, I just wanted a tool that would save me having to combine the data in my trading account with my own manual calculations in order to work out my true portfolio performance.

I — like many of the Navexa community — am a long-term, buy-and-hold investor to whom strong, annualized returns matter more than eye-grabbing one-off gains.

I’ve been learning about money and wealth creation for a long time. Everything I’ve learned has taught me it’s far better to work with hard data than skewed or incomplete information about a portfolio.

This is why the Navexa Portfolio Tracker, today, is one of the leading portfolio tracking platforms in Australia. We calculate annualized portfolio performance that accounts for all the factors I mention above.

Once you load your portfolio into Navexa, you start seeing true performance over the long term. You can see at a glance your capital gains, currency gains, investment income — all net of your trading fees.

You can run comprehensive tax reports with a couple of clicks. You can track & analyze more than 8,000 ASX & US-listed stocks and ETFs, plus cryptos, cash accounts and unlisted investments (like property).

And, you can go even deeper, running reports like Portfolio Contributions, which shows you in chart form which of your investments are boosting (and which are dragging down) your overall performance.

Like I said, I’m biased, since I started Navexa. But I wouldn’t have had to — and thousands of satisfied members wouldn’t be tracking with us — were it not for my trading account failing to provide a full and clear picture of my portfolio performance.

Trading accounts are for trading. Navexa is for portfolio tracking. If you’re doing the former, you should, IMHO be doing the latter, too.

Happy tracking — create an account here (zero obligation & no credit card required!).

Categories
Financial Literacy Investing

The Zig Zag Indicator Formula — What It Is And How To Calculate It

Understanding a stock’s trend is a vital part of trading, and a key focus for technical analysis. This post explains what the zig zag indicator formula is and shows you the basics of how to calculate and use it to identify price trends.

The zig zag indicator is a basic technical analysis tool you can use to determine whether a stock is trending up or down.

This indicator is one of the more simple tools used in technical analysis — the discipline of analyzing charts to make predictions on future price movements.

In this post, we’ll explain:

·     How the zig zag indicator works to identify price trends

·     How to calculate the formula

·     The potential benefits

·     Some potential limitations

Plus, we’ll share some examples of technical analysis using the zig zag formula, and other key data you should be looking at for both individual stocks you own and your portfolio as a whole.

This post will give you a good overview of the zig zag indicator and how you can use it to better understand and determine price movement.

It is not intended as financial advice, and we always recommend you do your own research and/or consult with a financial professional before risking your money on an investment. 

What Is The Zig Zag Indicator And How Does It Work

The zig zag indicator is part of the discipline of technical analysis.

Technical analysis involves interpreting historical data about a security from its price chart in an attempt to determine a pattern, which in turn might give you an idea of where the price is likely to go next.

Traders use the zig zag indicator specifically to eliminate the ‘noise’ of day-to-day market conditions and price movement, and get a clear picture of whether a security’s trend is reversing.

The zig zag indicator allows you to make points on a price chart wherever the price reverses by more than a given percentage. The most common percentage threshold for selecting these points is 5%.

So for every instance on a chart where the price shifts from either down to up, or up to down, by more than 5%, you make a point.

Once you’ve found all the points that qualify on the chart you’re looking at, you draw lines between each adjacent point.

Take a look at an example.

zig zag indicator formula
Source: TradingView

The zig zag pattern this creates shows you all the significant changes in trend on the price chart.

By showing you only the trend reversals greater than 5%, the indicator helps you to focus only on the significant ones (which may be useful to you in predicting the next likely trend change) and not on the smaller, less consequential fluctuations.

These significant turning points are known as swing highs and swing lows.

It’s important to know that the zig zag indicator cannot predict future price trends or price movement. Advanced traders use the indicator with both Elliot Waves and Fibonacci projections in predicting likely future price movement.

For the everyday investor, however, this indicator can still be a useful tool in getting a clearer picture of a stock’s past behaviour, volatility and support or resistance levels.

How To Calculate The Zig Zag Indicator For A Stock

Calculating your zig zag indicator is simple.

First, select a starting point. Looking at a historical price chart, you’ll need to determine how far back you want to analyze. Choose a swing high or swing low.

Then, decide which percentage of price movement you want to set as your threshold. Most zig zag analyses use 5%.

Once you’ve set the percentage, find the next swing high or swing low that qualifies by being over that amount relative to the starting point and mark it on the chart.

Draw a trend line (the zig zag line) between the two. Then repeat the process from this new point to the next one.

Remember to calculate the percentage change relative to the previous point.

Repeat this process until the last swing high or swing low on your chart.

Once you’ve completed the process, you’ll see something similar to this:

zig zag indicator formula

Now, you can see the significant swings in the stock’s price — not every single change.

At the right hand side of the chart above, you can see the trend line continues right to the Y axis.

If this chart were up to date, you’d be able to confidently say the stock was currently trending upwards.

You could continue analyzing it day to day — or hour to hour if you’re an active trader — until you identified the next swing high or swing low point, allowing you to potentially exit a trade before the price fell further.

Zig zag Indicator Main Points

  • Calculate the points at which the price reverses by more than a minimum percentage.
  • Rule straight lines between each adjacent point.
  • Add further trend lines and analyses overlays to augment the zig zag indicator with other technical trading tools.

More Examples Of Stocks Analyzed With The Zig Zag Indicator

Overlaying the zig zag indicator onto a price chart helps you to see more simple trends and patterns in what can be confusing collections of noisy information.

Finding the points and plotting the zig zag between them is only part of the process for many traders, though.

Take a look at this chart: 

zig zag indicator formula

You can see the zig zag line in green. And you can see two more lines, in black.

The trader here has drawn these by ruling along the upper and lower points on the chart.

These black lines show resistance and support levels. Resistance and support are central ideas in technical analysis and trading.

Resistance is the price at which an uptrending stock is will likely pause before breaking through due to supply levels. Support, on the other hand is the opposite — the price at which a downtrending stock will likely pause due to demand levels.

In other words, a stock might struggle to get beyond a certain price because many investors will sell at or near that price. Conversely, it might struggle to fall below a certain price because investors will try to buy around that price.

Moving averages and trendlines — like the zig zag indicator — are key tools traders use to determine these levels, as you can see above.

Using The Zig Zag Indicator To Spot Trends & Breakouts

Now let’s look at another example of the indicator at play in a chart.

zig zag indicator formula

In this example, the trader has not only added support and resistance levels based on their zig zag trendline. They’ve also made notes of trends and breakouts.

When a stock price passes a support or resistance line, it can be said to be ‘breaking’ higher or lower.

You can see in the lower left part of the chart the note ‘price breakout’. This shows you where the trendline has passed the resistance line, indicating a new break higher.

After breaking higher, there’s a flurry of new swing highs and lows, which the trader has annotated with new resistance and support lines and the note ‘prices in an uptrend’.

These are just two examples of how the zig zag indicator can be useful in the technical analysis of a stock price chart.

The Benefits Of Using This Type Of Analysis In Your Investing Strategy 

The zig zag indicator has several potential benefits. But they only apply if you’re confident with using technical analysis in your investing or trading.

If you’re more of a passive investor (someone who’d rather put their money in an ETF and leave it alone for a long period), or, say, a value or fundamental investor, the zig zag indicator might not be useful to you.

Here are three potential benefits to using it:

1.   Block out noisy short-term price movements and see the significant ones: It can be easy to get caught up in every single price move a stock makes. But not every move demands you buy or sell. Even the best performing investments probably won’t go up every single day. By using the zig zag indicator, you can focus on the meaningful swing highs and lows — the points at which the price really changes direction, rather than just fluctuating as a result of regular trading.

2.   Pair it with other analyses: As you can see in the charts above, using other technical analyses tools allows you to leverage the indicator further. You can see resistance and support levels, and get an idea of the price a stock needs to move above or below in order to break higher or lower — or trade within to remain in a trend.

3.   Zoom out and see a bigger picture: In a week, a stock might have several swing highs and swing lows. But paired with resistance and support lines, plus other more advanced technical analysis tools like Fibonacci levels, you can use the indicator to get an idea of a stocks longer term patterns and trends.

There are many types of trading strategies that may benefit by employing the zig zag indicator — especially swing and momentum trading.

Why You Should Use Caution Before Deciding To Invest In A Company Based On Zig Zag Indicator Analysis

Like any trading strategy or stock analysis tool, the zig zag indicator is not going to give you any guarantees regarding the likely success of an investment.

It’s a trend following indicator. That means it works on historical data. And while it’s a very useful tool in analyzing past price action, it’s never going to predict what a stock might do next.

In this respect, it’s more of a confirmation tool — albeit a very illustrative and educational one.

If you’re using the indicator in your own investing, be sure to pair it with other forms of analysis and research. And, of course, always be aware that no matter what a trend following indicator — or historical price action — might suggest, you do always risk losing money when you invest it.

Additional Resources Available Online About The Zig Zag Indicator

There’s plenty of good resources about the indicator online to help you learn more.

Here’s a detailed breakdown that explains the basics, strategies for deploying it and several examples of the indicator in use.

This page explains the parameters of the zig zag indicator, and some of the things using it can tell you about a stock’s price action and trends.

Since the indicator is a part of technical analysis, you might want to read this introduction to technical analysis itself.

Level 2 Market Data: How Traders See Market Moves Before They Happen

Imagine knowing how many traders were placing orders in a stock before those orders were fulfilled.

That’s the power of level 2 market data, which, if you’re using the zigzag indicator, or looking for a swing high and swing low in a chart, may come in handy.

We explain how to read and apply level 2 market data here.

Pro Tip: Automate Your Portfolio Performance Tracking

Whatever investment or trading strategy you use, you should always correctly track and analyze your investments’ performance.

The Navexa portfolio tracker tracks stocks, ETFs, cryptocurrencies and unlisted investments together in one account.

Navexa lets you track everything together so that you can track, analyze and optimize your investment performance over time.

With a Navexa account, you’ll receive weekly and monthly email updates on how your portfolio is performing, plus powerful tax reporting tools that make recording and reporting your investment taxes quick and easy.

Plus, Navexa allows you to apply different tax strategies to your investments, meaning you can better control the amount of tax you’ll owe when you sell holdings.

You can access charts of your individual holdings and your portfolio as a whole. If you’re using the zig zag, you could apply it to your entire portfolio to identify historical trends and swings.

Plus, you can drill down on your portfolio diversification, contributions and more — giving you a greater depth of insight into how your investments are performing together and relative to each other.

Navexa portfolio tracker

Create Your Portfolio Performance Tracking Account Free Today

Whether you’re using the indicator as part of a trend following, swing trading or day trading strategy, having access to quality charting and data on your investment and portfolio performance is crucial.

You can try Navexa for free for up to 14 days when you create an account today.

Sign up, add your portfolio securely, and see your true portfolio performance using all our members-only reporting and analysis tools.

Open your Navexa account free today.

Categories
Cryptocurrencies Investing

The Top 10 Performing Cryptocurrencies Of 2020 (Bitcoin Wasn’t Even Close)

Last year was packed from beginning to end with extreme and unexpected events. The cryptocurrency markets were no exception. In this post, we reveal the top 10 performing cryptos in 2020, how they compared to the top performing stocks, and share some analysis and predictions on Bitcoin and the wider crypto and blockchain sectors for 2021.

Bitcoin is the coin we most often talk about when discussing the boom and bust cycle of the cryptocurrency markets. The original crypto recently smashed through US$40,000 to make yet another all-time high.

But looking back on 2020, it turns out Bitcoin didn’t even make the top 10 in terms of gains.

When you zoom out and compare the crypto markets to the major stock markets in the US, you’ll see that the top performing crypto — with a tiny market caps relative to Bitcoin — eclipsed even the so called ‘Golden Bull’ microcap NASDAQ top performer last year.

So what wild and unexpected twists and turns will we see across stocks and cryptos in 2021 after the crises-packed 12 months just gone?

Let’s start with the top performing cryptocurrencies of 2020 (all prices are in US Dollars).

An Average Gain Of Nearly 1,700%: The Top 10 Performing Cryptocurrencies Of 2020

With so many different exchanges and price trackers around for cryptocurrencies, it’s not uncommon for investors to never really know the all-time high for a particular coin.

The same goes for determining the precise price movement for a given period.

According to coincodex.com, the top performers for 2020 were:

KSM: 4,813%
CEL: 3,263%
YFI: 1,832%
THETA: 1,776%
SNX: 1,481%
ZIL: 1,204%
ADA: 662%
ETH: 608%
WAVES: 595%
XEM: 533%

Bitcoin came in 15th, just over 300%, before it embarked on its steep ascent to new highs the first weeks of 2021.

Ethereum was by far the biggest crypto by market capitalization in the top 10, ending the year just over $100 billion.

Top performer, KSM, had just over half a billion dollar market cap.

So you can see that much like the microcaps that come from nowhere each year to top the stock market gains leader boards, it was — apart from ETH — the smaller, lesser recognized cryptocurrencies that produced the biggest gains in 2020.

A $1,000 investment in KSM could have transformed into just under $50,000 in 12 months.

As for the top 10 cryptocurrencies by market cap, this widely-referenced annual experiment spread $1,000 evenly across each.

The return, a less stellar but nonetheless impressive 139%.

Still, when you compare that against the S&P 500’s 16% gain in 2020 (admittedly, still impressive during a pandemic!), there’s no denying where you would have been better investing that $1,000 last year.

Given the explosive start to the year cryptos have had in 2021, what might be possible in the next 12 months? We’ll get to that. First, let’s look at stocks.

NASDAQ Plays Host To Biggest 2020 Stock Gains (Thanks BTC) While Tech Stocks Dominate S&P 500

The NASDAQ more than doubled the S&P 500’s 16% annual gain in 2020, finishing up 43% higher at the end of the year.

But the top performing stocks on those indices gained way more than that.

Technology dominated the S&P 500, where Tesla ended 2020 the top performer on 743%, Etsy delivered 302% and Nvidia gained 122%.

Over on the NASDAQ, however, a string of microcap tech companies not traded on the S&P 500 delivered some crypto-esque gains.

In fact, the top performer, Bit Digital (which gained 3,691%) owed it’s number one status directly to the crypto bull market that took hold late in the year.

The microcap car rental company focused on mining bitcoin, which allowed it to outperform vaccine companies, renewable energy stocks and biotech players.

Three of the NASDAQ’s top 10 last year gained their spots through cryptocurrency activity.

The highest performing non-crypto stock on the NASDAQ last year was Novavax, which received more than $1.6 billion as it emerged as a player in the COVID-19 vaccine contest of 2020. 

So it’s not as though last year was a write-off for stocks and a home run for cryptocurrencies.

But, while the best performing stock on the major US exchanges could have turned $1,000 into more than $40,000 (thanks Bitcoin), the top performing crypto last year still could have made you a better return.

And if you’d gone for a more measured approach and deployed that $1,000 across the top 10 cryptos by market cap (which represent most of the capital in the crypto markets), you could still have more than doubled your money, compared to relatively weaker double-digit gains from the NASDAQ and weaker again from the S&P 500.

Here at Navexa we aren’t in the business of telling you what to buy or sell.

Whether it’s an asset class, a sector or an individual investment, we only look at the data. The past is never a guide to future performance for any market, sector or investment.

When you consider what a wild ride the world and the markets went on last year, you can understand why making predictions about 2021 is especially fraught.

Our Crypto Analyst’s Three Predictions For 2021

Aaron Boyd is a blockchain engineer and co-founder of Pretoria Research Lab in Berlin.

According to Aaron there are three major developments on the cards in the crypto space this year.

The first hinges on continuing monetary expansion and currency devaluation (which you can read more on in our Medium article here).

Twenty five percent of all US Dollars in existence were printed in 2020.”

That’s not a typo.

The amount of money in the global financial system exploded higher again last year as governments keep up the same strategy they’ve been using to deal with crises for centuries — printing more.

Aaron: “Trillions more Dollars will be printed in 2021 for COVID relief and stimulus packages. This will result in new all-time highs for crypto assets — and stocks.”

That might sound strange, but as fiat currency itself grows less valuable as a result of its diminishing scarcity, that ‘cheap money’ pours into the stock market at the same time as it boosts interest and confidence in Bitcoin’s intrinsic (and decentralized) scarcity.

In other words, in terms of crypto and stock prices in 2021, expect to see more of the what we saw in 2020.

Aaron notes that cryptocurrencies are increasingly becoming a credible alternative hedge to expansive monetary policy.

Gold and other precious metals have historically held this safe haven role.

But in 2021, we’ll see more private investors and institutions choosing Bitcoin over bullion.

It won’t all be smooth sailing and ever higher prices, though, according to Aaron.

There will be another market correction after the past couple of months’ bull run.

Bitcoin will be declared dead for the 417th time!”

No Matter Where Stocks & Cryptos Go In 2021, Make Sure You’re Effectively Tracking Your Performance

Whichever way you slice it, 2021 is going to be an unprecedented year for the markets.

Bitcoin probably could be declared dead yet again… And then go on to hit $100,000 a month later.

That’s not a prediction. But after such a turbulent 2020, you have to concede that anything is possible this year — in both stocks and cryptos.

Whether you’re investing in one or both, make sure you’re getting the data and insights you need to make informed decisions.

The Navexa portfolio tracker gives you the tools to track, analyze and report on ASX, NASDAQ and NYSE holdings and every cryptocurrency, as well as cash accounts and unlisted investments.

Categories
Financial Literacy Investing

True Story: My First Investment

Back in 2013, I became interested in the idea of investing.

I was watching a tv show that featured a brief clip about how Warren Buffet had started investing at a young age and was now worth $40 billion dollars!

Hearing this piqued my interest.

I was 25 and envisaging a wealthy future for myself based on a long-term, systematic wealth building method.

So, I started a search for knowledge on everything I could about Buffet.

I read The Intelligent Investor by Benjamin Graham — the man who taught Buffet in the beginning of his career.

It was a dry read if I’m honest, but a necessary one to get the basics of investing into my head.

With just enough knowledge to be dangerous, I thought I’d try my hand at the real thing and buy some shares!

But in what exactly?

I knew you had to value a stock to see if it was trading at a good price, but I had no idea how to do it.

So off I went Googling ‘how to value a stock’ and reading website after website on various methods and techniques.

I arrived at a valuation method called Discounted Cash Flow (DCF).

The DCF is a classic valuation method used to value stocks as well as entire businesses.

It seemed like a good place to start.

Now I just had to find a stock that had a DCF value about 20% less than the current trading price.

Easy… not!

I decided I would stick with companies I knew, so I started valuing all the big companies I could think of.

Banks, insurance companies, technology companies. But everything at the time was overvalued… according to my calculations.

Then, I arrived at a stock that had a valuation 20% lower than what it was trading for.

Webjet (ASX:WEB).

I knew Webjet. I knew what the company did so I felt I could easily explain it to other people.

But I still felt uneasy about buying their shares.

I had read various books and spent hours trawling investing articles online.

But I still had no idea if I was doing it right.

What if I invested my money but then the price went down!?

What if I lost all my money!?

But I thought back to what I had learned from Buffet.

The price is going to go up and down every day.

I wouldn’t sell my house just because every day someone came to the door and told me its valuation had gone down.

So, I just had to trust in the process.

I took the leap.

I logged onto my broker and put in the buy trade for WEB at $4.050.

Not long after that the trade was executed, and I became a real-life stock investor!

I’ll freely admit I did check my portfolio every five minutes for the next few days (*cough* weeks).

Lucky for me, the price went up fairly quickly, so I was able to sleep easy each night.

Looking back though…

I had accidentally bought myself a winner.

Despite not knowing nearly enough to confidently buy the stock in the first place.

Yes, it was 20% undervalued, but I did not investigate enough about the business’s future plans, what the industry performance looked like, what the competition was, and so on.

But lucky for me all of that worked out and WEB is currently trading at $14.38, seven years later.

At the time of writing, that’s a 255% increase (I still haven’t sold my shares).

Since then, I have bought other stocks to build up my portfolio, but none ever taught me as much as that first trade.

As with anything in life, the first time you do something can be extremely tough.

The uncertainty and hesitation will never be as great as it was buying my first shares.

I trusted in the process.

But today, I have the proof to match that trust.

You’ll never have 100% confidence in what you are doing if you’ve never done it before.

Taking my first dip into the investing world taught me about the process, emotions, resilience and confidence.

All of those lessons helped shape me into the investor I am today.

And I don’t say this as someone who thinks they’ve somehow mastered investing.

The more I learn, the more I know I need to learn.

No two days in the financial markets are the same.

No two investments play out the same.

I’m always having my ideas and opinions challenged by the markets and by fellow investors.

But, thanks to the research I did before buying my first stock…

And the solid triple-digit gains that investment has achieved so far…

I can now buy stocks with confidence in my process — and sleep easy every time.