Categories
Financial Literacy Financial Technology Investing

Navexa 3.0: A New Breed Of Portfolio Tracker

In October 2023, we unveiled a major new update to the Navexa Portfolio Tracker. Here’s an explainer on the key changes.

Navexa started life as a basic portfolio tracking tool. Today, it’s developed into a multi-asset, multi-market platform that gives investors professional-level portfolio tracking and analysis on a level no other tool can match.

In October 2023, we launched the most advanced iteration of Navexa to date. In this post, we explain the changes and walk you through a few of the powerful new tools we’ve created to make understanding and optimizing your investments easier than ever before.

Watch our Navexa 3.0 Webinar

We revealed and explained the latest iteration live on a webinar for our customers. Watch the replay free — just click the player:

Navexa 3.0: The Philosophy Behind The Redesign

Navexa started life in 2018 as a basic portfolio tracking tool. It quickly evolved, supporting more markets and offering more solutions to the all-too-common problems investors encounter trying to accurately track and analyze their long-term investment performance.

Today, we’re shedding our reputation as ‘another portfolio tracker’ and revealing four big new changes and additions to our platform.

Here, we introduce and explain the key new tools and updates, and show you why Navexa now offers performance tracking and portfolio analysis tools distinctly different from other platforms.

New: Portfolio Overview Screen

The most visible update we’ve made to Navexa is the new Overview screen:

The idea behind this screen is that investors can see all their key portfolio performance metrics at a glance in one place.

While previously (and on other platforms) you needed to visit different parts of your account to find everything you might need to know, the new overview is effectively a one-stop shop for checking your portfolio’s vitals.

The five key metrics at the top of the chart (value, gain, income return, currency gain and total return) are now clickable — clicking each will display a chart for that specific metric.

Below the chart, you’ll find four bar chart panels.

Clockwise from top left:

Holding Performance: A list of the top performing holdings in the portfolio.

Category Performance: A list of the top performing sectors in the portfolio.

Diversification: Select from holding, exchange, sector, industry and currency to view the portfolio’s diversification.

Income Return: A list of the highest income-earning holdings in the portfolio.

The first three panels all have clickable dropdown menus. You can customize what they show, like return, value, dollar or percentage.

This screen lets you both understand your portfolio performance at a glance, and allows you to drill down into greater detail. Just click the bottom of each panel to access the corresponding report based on your settings.

New: Filtering System

A key tool in Navexa 3.0 is the filter system.

This small, but powerful, tool allows you to ‘filter’ what you view throughout your account.

Click it and select from the dropdown (holding, exchange, sector, industry, currency). This will prompt you to make a selection.

Once you choose your filter, your account will reload, and all the charts, metrics and reports will apply only to your selection.

Note: Your filter selection remains as you move throughout your account — you’ll see it above the chart, and can click the ‘X’ to remove it and revert to an unfiltered view.

New: Benchmark Analysis

You’ve long since been able to choose your portfolio performance benchmark in Navexa.

But whereas previously, this was a simple addition to the main portfolio performance chart, we’ve now created a new Benchmark Analysis page:

Like the Overview screen, the Benchmark Analysis chart features clickable metrics along the top. Click each to view the corresponding performance chart and benchmark chart together.

You can edit the benchmark both on this page and on both the Overview and Portfolio screens.

Below the chart, you’ll find two panels with bar charts:

These display which holdings (or sectors, exchanges, currencies, or industries) are overperforming and underperforming relative to your selected benchmark.

New: Income Calendar

We have another cool new tool for you — the Income Calendar.

Where previously Navexa could only forecast confirmed upcoming dividends, the new Income Calendar lets you estimate portfolio income 12 months in advance.

The solid coloured bars represent confirmed income, and the shaded bars represent predicted, or forecast, income.

Navexa calculated the predicted income based on the previous year’s earnings.

Below the chart, you’ll see a list of holdings and income ordered by date.

More New Stuff: Charts, cash account options & more!

We have left no stone unturned in this latest big upgrade.

You’ll also now find a Sankey chart for analyzing your portfolio income, the option to rename cash accounts, a slew of UX improvements (like labelling, and switching between showing open or closed positions).

Navexa 3.0 is live now — start tracking today!

Ready to start tracking and analyzing your portfolio?

Start tracking with Navexa today.

Go here to get started!

Categories
Cryptocurrencies Financial Literacy Investing

How to Calculate the ROI of Your Crypto Investment

Tracking a cryptocurrency portfolio might be challenging. Here’s what experienced inventors use to understand their crypto ROI.

Investing in cryptocurrencies can be challenging, especially for investors who are used to dealing with traditional assets. These investors often see the crypto market as highly volatile.

In addition, there’s a lot of market manipulation, which often causes drastic price movements.

However, most people get attracted to crypto investment and jump into a digital asset because of the possibility of a high return on investment.

Even the experienced trader who deals with gold might test out the waters and get into crypto, ready to take the risks.

Here’s how they calculate the ROI, rate of return, and their net profit.

Briefly on Cryptocurrencies

There’s a lot that can be said about cryptocurrencies, but new investors should know that it all started with Bitcoin (BTC) in 2009. It was the first-ever digital currency that introduced a peer-to-peer electronic cash system.

Once the first cryptocurrency started getting traction, others followed. Soon, a whole new market was born, and ever since, the financial industry hasn’t been the same. Cryptocurrency opened up many doors to investors who can now invest in these assets in several ways, such as:

  • Purchasing coins or tokens directly on the exchange
  • Investing in an Initial Coin Offering (ICO)
  • Investing via Initial Exchange Offering (IEO)
  • Getting into Crypto Exchange Traded Fund (ETF)

Some of the new options for investing in crypto include purchasing non-fungible tokens (NFTs) and lending money via some of the Decentralized Finance (DeFi) platforms.

calculating cryptocurrency ROI
How to calculate rate of return and net profit for crypto investments

Dangers of Investing in Cryptocurrency

Even though there are many ways to get introduced to crypto investments, novice investors often worry about the limitations regarding current and future regulations.

Many investors don’t consider the value, efficiency, or use case of the cryptocurrency they invest in. Some also completely ignore the technology behind the project and only follow a hyped community and current market sentiment.

This often results in a poor, emotion-driven investment decision, which brings a negative return on investment (ROI).

On the other hand, some investors are fortunate, and hit the nail on the head by getting into tokens which prove to be successful projects, bringing high ROI.

Still, those who purchased crypto and learned to manage the risks claim there’s a potential for a decent return on investment (ROI).

However, ROI depends on the current price of the asset and market fluctuations, which can be shaken with just one negative headline.

This is why calculating the rate of return and ROI can be tricky.

What Is Return on Investment (ROI)?

Return on investment, or ROI, is defined as the percentage growth or loss of investment, divided by the initial cost of an investment, multiplied by 100. ROI calculation measures the profitability of an investment.

On the other hand, the rate of return, or IRR, is the rate of all future expected cash flows of an investment. IRR measures the estimated return.

Both are used to measure the performance of investments, with ROI being used by individual investors or institutions and IRR being used by financial analysts.

ROI metrics are important for crypto investors

Positive ROI and Negative ROI

The difference between a positive ROI and a negative ROI is simple. A positive return on investment means that net returns are greater than any investment costs.

The negative ROI percentage shows the net returns are poor, meaning the total costs are greater than returns.

The Importance of the ROI Metric

ROI is the key performance indicator that shows how successful an investment might be. ROI calculation can be handled in two different ways:

  1. By using the standard ROI formula: subtracting the initial value of the investment from the final value of investment, and then dividing the number by the cost of investment x 100
  2. By using the alternative ROI formula: dividing net return on investment with the cost of investment x 100

Still, investors should be mindful that the annualized return formula often ignores the compounding that’s added to the initial value, which is why it might give incorrect results.

Tools Investors Use to Calculate ROI

There are many tools to calculate ROI, and experienced investors often don’t even have to use a formula to get the numbers right.

For example, Navexa is one of the best ROI and portfolio trackers people can use to keep track of the money they invested.

It’s a smart portfolio tracker tool, developed to pull data from all sorts of platforms, including crypto exchanges.

Navexa helps traders and investors see their annualized ROI with ease — bypassing the need to use any manual calculation.

what is cryptocurrency ROI?

What is Crypto ROI?

Crypto ROI helps investors calculate the performance and efficiency of their crypto investment.

By calculating crypto ROI, traders and investors also compare how different crypto investments perform against one another, and which asset has the highest potential of bringing more money.

What’s more, crypto ROI is a key metric in determining the performance of an asset compared to its initial price.

Calculating crypto ROI has become a popular indicator for Bitcoin, Ethereum, and altcoin traders and investors.

Crypto ROI is observed in the same manner as traditional investments ROI — if an ROI is positive, that means the investment is performing well — the price is increasing over a certain period.

On the other hand, if the value of ROI is negative, that means the asset has lost value.

When it comes to crypto, it might be tricky to know whether a crypto investment will bring ROI.

Digital assets often look quite appealing, especially to new investors, but the market is very volatile and high ROI often depends on multiple factors.

Why do Investors Measure Investment ROI in Crypto?

The most common reason investors measure crypto return on investment ROI is to see whether the initial value of the investment has increased.

Calculating crypto ROI gives the general idea of how profitable an investment is.

It also shows how the investor’s portfolio performance compares to the initial investment.

the Navexa portfolio tracker
Navexa tracks and reports on crypto returns & performance

How to Calculate ROI in Cryptocurrencies?

Investors usually calculate crypto ROI by subtracting the original cost of investment from the current value and then dividing it by the original cost.

Just like with traditional investment assets and markets, ROI calculation shows whether an investment strategy is working or not.

Is ROI an Ideal Metric?

While ROI is a powerful metric that shows the success or failure of the investment strategy, it has some flaws. For example, ROI doesn’t usually account for the time someone spent investing. This is why analysts often calculate annualized ROI, which shows the progress of profit or loss for a given timeframe.

ROI doesn’t explain the asset’s environment, market risk, and liquidity changes. This is why investors often rely on a few other metrics, and not just the ROI.

Those crypto investors who prefer trading to holding should also account for other factors and costs, such as trading fees, wallet fees for sending the coins, and any other metric related to their expenses.

They should also account for the dates when they bought and sold an asset.

The ROI metric doesn’t reflect the risk associated with purchasing, trading, and holding crypto, which is why investors must rely on additional data.

Crypto ROI Calculator

There are many crypto investment ROI calculators out there and most are super easy to use to calculate profit on crypto investments.

Navexa is one of the top crypto ROI calculator tools investors use to get the percentage of their ROI.

The Navexa portfolio tracker calculates performance for stock and cryptocurrency holdings, including capital gains, currency gain tracking, income tracking and more. Navexa is easy to use and free to start with, so both novice and experienced investors can test out its features.

Example: Calculating the ROI of a Bitcoin Investment

Bitcoin is likely the first asset investors get into when they start investing in crypto. Here’s a simple example of how people calculate the ROI of BTC.

Let’s say someone invested $2,000 into BTC. After a while, their $2,000 grew to $6,500.

They would calculate the BTC ROI following the standard formula:

($6,500 – $2,000) / $2,000 = 2.25 x 100 = 225% ROI

Return on Investment for Different Digital Assets

With so many different assets on the crypto market, each asset may have a different ROI. Those projects that have a more active community, and a better use case for their tokens may provide higher ROI to early investors. However, that’s not always the case and this post should not be considered financial advice!

Bitcoin is already a somewhat established asset, and its ROI has historically been the highest compared to other assets. On the other hand, Ethereum is the second-largest cryptocurrency after Bitcoin, but it just recently provided a higher ROI for some investors.

Some of the best performing assets currently include The Sandbox, Terra, Decentraland, and other assets that are related to the metaverse, play-to-earn gaming models, NFTs, and a few other new technologies in the crypto space.

However, experienced investors know that the crypto market is unstable and that ROI on most crypto assets can become negative if the coins face a massive sellout.

Final Word on Calculating Crypto ROI

One of the reasons people get into crypto is the promise of a potentially high ROI. However, getting great returns with crypto can be challenging. Still, measuring ROI can help investors make more rational decisions. ROI metric also helps people allocate the money in their portfolio in the right way so that they’re more profitable in the long run.

On the other hand, calculating ROI on a crypto investment could be tricky, as investors often forget to account for their trading fees and other expenses they managed.

However, with Navexa, getting a clear ROI metric is easy 🙂

Categories
Financial Literacy Investing Tax & Compliance

Investment Tax Basics: Capital Gains, Dividend Income & Tax Implications

If you invest in Australia, the Australian Taxation Office requires you pay tax on both capital gains and dividend income. Here are some basic things to know about paying tax on your investments in Australia.

Paying a portion of our income to our government has long been a fact of life — the phrase ‘certain as death and taxes’ stretches back more than 300 years.

In Australia as elsewhere, this goes for income we earn from employment, a rental property, and other sources. It also applies to investment income.

Below, you’ll find information (general, of course, and not in any way to be considered financial or taxation advice!) about:

  • The Australian tax year and cycle.
  • Capital gains tax (CGT) events for investments (long and short term).
  • Taxable investment income from dividends.
  • Different ways you can report on your investments for tax purposes.
  • Tax benefits from ‘franked’ dividends.

Let’s start by explaining the Australian tax cycle.

Tax Time: Key Australian Dates

These are the key dates to keep in mind for calculating your portfolio tax and filing your tax return in Australia.

The income year for tax purposes — otherwise known as the ‘financial year’ — goes from July 1 to June 30.

This is the period for which you’ll need to collect and collate your financial information for assessment during the period known as ‘tax season’.

Australian Tax Season

Tax season runs from the start of the next financial year (July 1) to October 31 — a period of four months.

If you’re lodging your own tax return, you have until October 31 to do so. If you use a registered tax agent, you have a little longer — usually May 15 the following year.

Check with your accountant or the Australian Taxation Office (ATO) to ensure the key dates for your specific situation.

If you’re an investor, you’ll need to report on your portfolio’s activities during the relevant financial year. Here are the main things you’ll need to consider as an individual.

Capital Gains Tax On Investments In Australia

Australian tax law specifies that you must pay tax on any assets you own when you sell them, or when another ‘CGT event’ happens to them.

At its most basic, this refers to selling shares. But it covers many other events, too, including switching shares in a managed fund between funds and owning shares in a company which another company takes over (or merges with).

What Is The Capital Gains Tax Rate?

Australians pay CGT on their investments at the same marginal tax rate they pay on their personal income for the financial year.

So, for example, if someone earned $100,000 from their employment and also made $20,000 from selling shares they’d held for more than 12 months, their marginal tax rate would be 32.5% — meaning they would need to pay $6,500 in tax on the capital gains from their investments.

The CGT rate differs for individuals, companies and self-managed superannuation funds.

If someone sell some shares for a capital loss, this may result in tax benefits, since they can deduct that loss from any gains they may have realized on other assets. If they didn’t make any capital gains (only losses) in a given financial year, they can carry a capital loss over to other financial years!

Long Term & Short Term Capital Gains

Australian tax law makes a distinction between long term and short term capital gains. This is effectively an incentive for investors to hold investments for more than a year at a time.

In the example above, where someone makes a combined $120,000 in the financial year from their employment and selling some shares, they’ve held those shares for less than 12 months.

This means they pay the same tax on their investment profits as they do their personal income (for tax purposes, capital gain profit gets added to other income to determine the marginal tax rate).

But if that person held the shares for more than 12 months, they’d qualify for a 50% CGT discount. Instead of paying $6,500 of their $20,000 capital gain, they’d only need to pay $3,250.

Learn more here.

How To Calculate Your Portfolio’s Capital Gains Tax Obligations In Seconds

Bearing in mind we’re only talking about the capital gain side of portfolio tax, it’s easy to understand why so many of us don’t exactly look forward to tax time.

Navexa’s tax reporting tools are powerful ways to remove the need for someone to have to manually calculate — or pay someone to manually calculate — their portfolio tax obligations.

Navexa’s CGT Reporting Tool

Navexa’s Capital Gains Tax Tool

What you see above is Navexa’s CGT Report.

Once you track your investment portfolio in a Navexa account, you can access a suite of analytics about everything from individual holding performance through to portfolio contributions, and of course tax analysis.

Provided the portfolio data in your account is correct and up to date, you can run an automated tax report in literally a few seconds.

The CGT Report Breakdown

As you can see in the sample image above, Navexa calculates your taxable capital gain and displays a detailed breakdown.

Under ‘Non Discountable Capital Gains’ you have: 

  • Short Term Gains: The capital gains you’ve made on assets sold within 12 months of buying them.
  • Capital losses available to offset: Any capital loss you’ve realized by selling assets for less than you paid for them.

Under ‘Discountable Capital Gains’ you have:

  • Long Term gains: The capital gains you’ve made on assets sold after holding them for 12 months or more.
  • Capital losses available to offset: Any losses realized from assets you’ve sold after holding longer than 12 months.

Then you have your CGT Concession Amount and, finally, your total Capital Gain for the portfolio (for the financial year and tax settings you’ve selected).  

It’s important to note that Navexa doesn’t provide tax advice. But as long as your account information is accurate and up to date, this should be all you need to file your return.

At the top right of the report, you’ll find buttons for exporting the report as both an XLS and PDF file.

So now you understand the basics of capital gains tax for investments.

Let’s dive into the income side of the portfolio tax equation.

Investment Income Tax

Capital gains isn’t the only form of investment income people pay tax on in Australia. Just like income from a rental property, dividends count, too. You must declare investment income.

Dividends, of course, are payments made to shareholders as a percentage of an investment’s profits. These profits have generally already been subjected to Australian company tax. Thus, the ATO doesn’t tax shareholders again on the already taxed profits when they’re distributed as dividends.

Franking Credits

This is where ‘franking’ credits come in. If a dividend is ‘fully franked’, it means the ATO judges it has already been taxed appropriately.

Depending on where an investor’s personal tax rate falls relative to the rate at which their dividends have been taxed (and had the appropriate franking credits distributed with them), they’ll either pay less than their personal tax rate (a tax offset) or, in some cases, a tax refund.

This is a great guide on dividend franking.

How Australian Tax Law Treats Dividend Reinvestment Policies

Some companies allow investors to receive dividends in the form of new shares instead of cash. This is known as a dividend reinvestment policy.

For tax purposes in Australia, the ATO treats dividend reinvestment the same as cash dividend.

If someone receives new shares instead of a cash dividend, they need to pay tax on them as though they did receive cash.

Like a cash payout, reinvested dividends may be partially or fully franked, since they still represent investors receiving a portion of profits.

How To Calculate Your Taxable Investment Income Obligations In Seconds

Navexa doesn’t just allow you to skip the hassle of working out your portfolio’s capital gain for a financial year.

It also lets individuals drastically accelerate the process for determining their taxable investment income, too. Take a look:

Navexa’s Taxable Income Reporting Tool

Navexa’s Taxable Income tool

When you automate your portfolio tracking in Navexa, the taxable investment income tool gives you everything you need to know when preparing your tax return.

You can see unfranked and franked amounts of investment income across your portfolio and the actual franking credit amount.

In the ‘Supplementary’ section, you’ll see six other fields:

The Taxable Income Report Breakdown

  • Share of net income from trusts, less capital gains, foreign income and franked distributions
  •  Franked distributions from trusts
  • Share of franking credits from franked dividends

And in the ‘Income from foreign sources and assets section’:

  • Assessable foreign source income
  • Other net foreign source income
  • Foreign income tax offset

Below the return fields you’ll see a holding by holding breakdown of your taxable investment income, like this:

This shows you subtotals for payments from each holding, and grand totals for each column at the bottom.

At the top right of the report, you’ll find buttons for exporting the report as both an XLS and PDF file.

This is the automated way to fast-track preparing to declare investment income for assessment.

Simplifying & Accelerating Investment Tax Reporting

We hope you’ve enjoyed this guide to the basics of portfolio tax in Australia.

We’ve covered the main points of tax implications for both capital gains and investment income (including franking tax offset).

There are, of course, many more scenarios and details than what we’ve had time to cover today.

As always, consult your accountant or seek other professional advice, and ensure you manage your tax obligations and tax return responsibly.

Try Navexa Today

Navexa empowers investors to build brighter financial futures with simple, but powerful, automated investment analytics and reporting tools.

The CGT and Taxable Income reporting tools we’ve detailed here are just two of the tools at your disposal when you automate your portfolio tracking with Navexa.

Sign up free here and explore them now.

Categories
Financial Literacy Financial Technology Investing

Why Your Brokerage Account Might Not Reflect Your True Portfolio Performance

Your trading account is designed to help you buy and sell investments. While it shows you a bunch of metrics related to your portfolio, it might not reflect your actual returns or performance. This post explains the difference and shows you why tracking is arguably as important as trading itself.

As a dedicated portfolio performance tracking platform serving thousands of people, the team here at Navexa communicate with our community frequently.

One of the most common questions we receive from those just beginning their portfolio tracking journey with us, is this:

Why are the investment returns in my Navexa account different from those in my trading account?’

Many of our new members are accustomed to viewing their portfolio performance through a very different lens from the one Navexa provides.

That’s because the numbers you see when you log in to your trading account aren’t so much to do with portfolio performance as they are with nominal ‘gains’ or changes in value.

In a portfolio tracker, you’re seeing your rate of return, or growth rate, over time.

In this post, we’re going to explain the difference.

We’ll explain why, in our (biased) opinion, you won’t get a clear and complete picture of your long-term investment returns from checking your trading account alone.

We’ll explain how the figures you see differ both in their calculation and the information they reflect.

We’ll touch on the extent to which brokerage fees and commissions impact your portfolio performance — and why your trading account may not reflect that impact.

We’ll explain how an investment’s true performance differs from its gains, and share with you exactly how our portfolio tracking platform calculates that performance.

And, we’ll show you how to access our purpose-built portfolio performance tracking platform free today so you can see for yourself the difference from the numbers in your trading account.

Let’s start with the key differences between trading account numbers and those in a portfolio tracker.

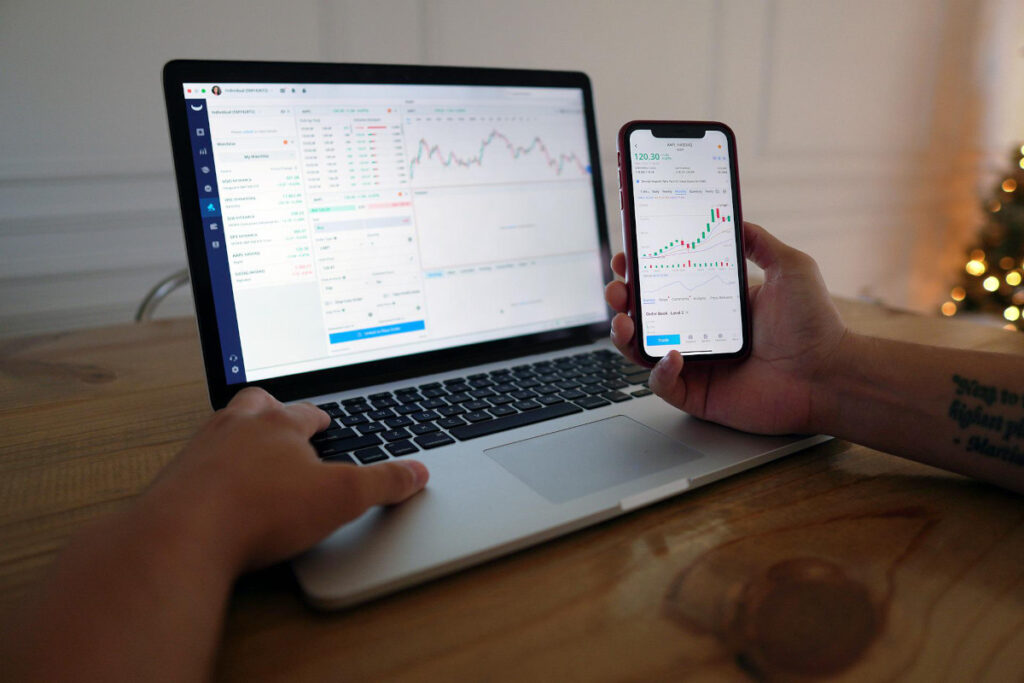
Trading Accounts Are For Trading — Not Portfolio Performance Tracking

In our CommSec Review, you’ll learn my honest opinion about using Australia’s most popular trading platform.

 As a trading platform, it’s great. But, as I argue in the review:

‘Having been in the market since 2013, and done my fair share of buying and selling, all I can see are two performance metrics: Today’s Change, and Total Profit/Loss.

‘To be blunt, that’s not enough for me.

‘Why?

‘Because portfolio performance is a lot more complex than just my total profit or today’s change. 

I need to see lots more.’ 

I can see today’s change in both dollar and percentage terms, my total profit/loss, my portfolio’s current market value, and the total cost (which, as you’ll see, isn’t actually my total cost).

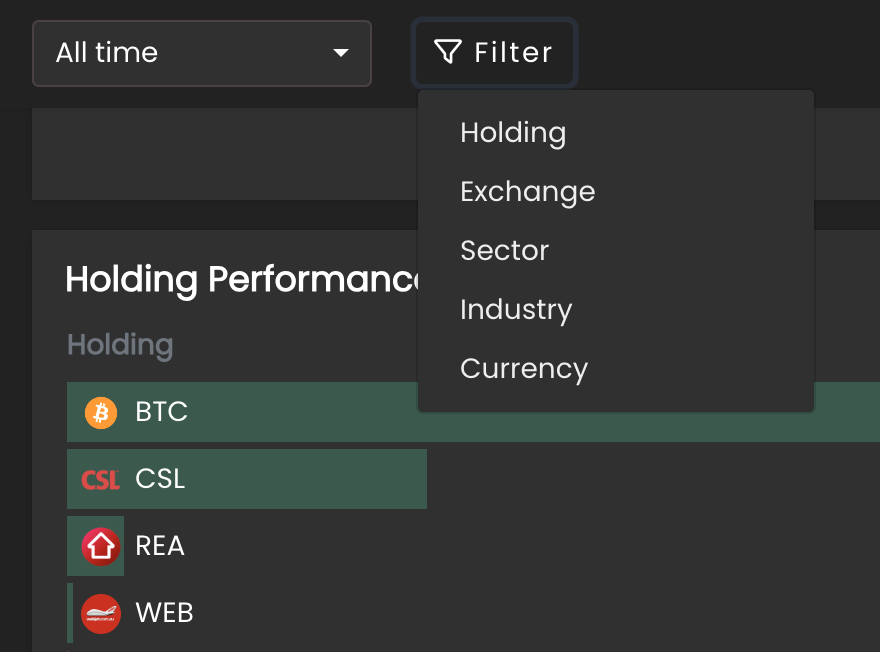
Below this portfolio level information, there’s a holding-by-holding breakdown. This shows me the price I bought each investment at, the last price it traded for, the day’s percentage change and so forth.

Take a look:

CommSec-Review

That’s all the information available to about how my investments are progressing. Frankly, it’s not enough to satisfy my appetite for data on my journey to creating long-term wealth through investing.

Which is why I’m in favour of using a dedicated portfolio tracker.

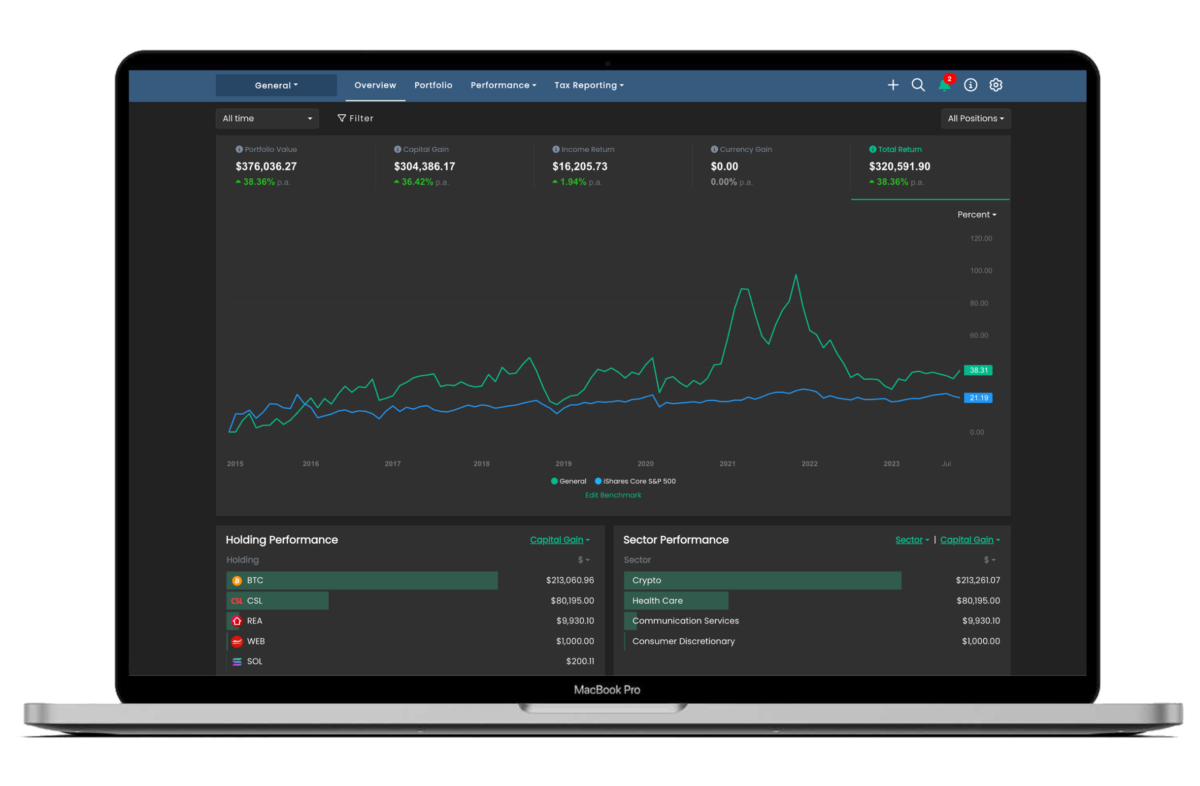
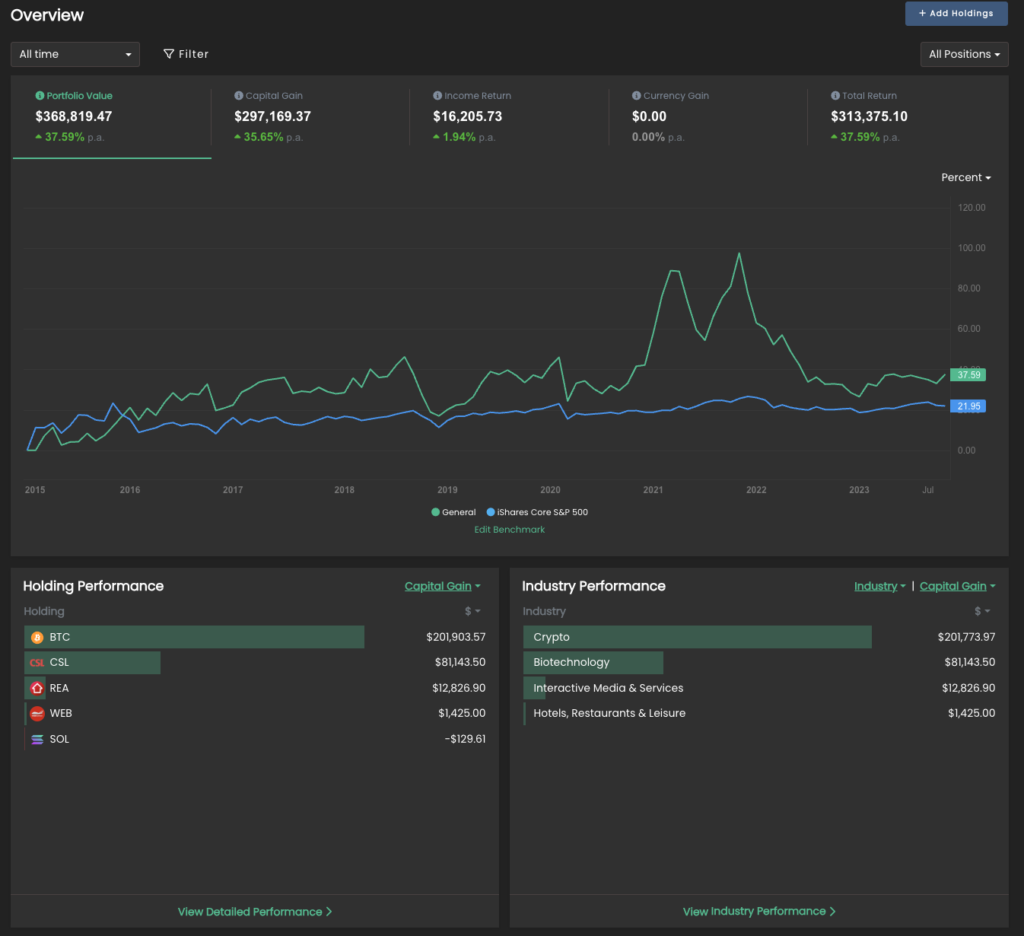
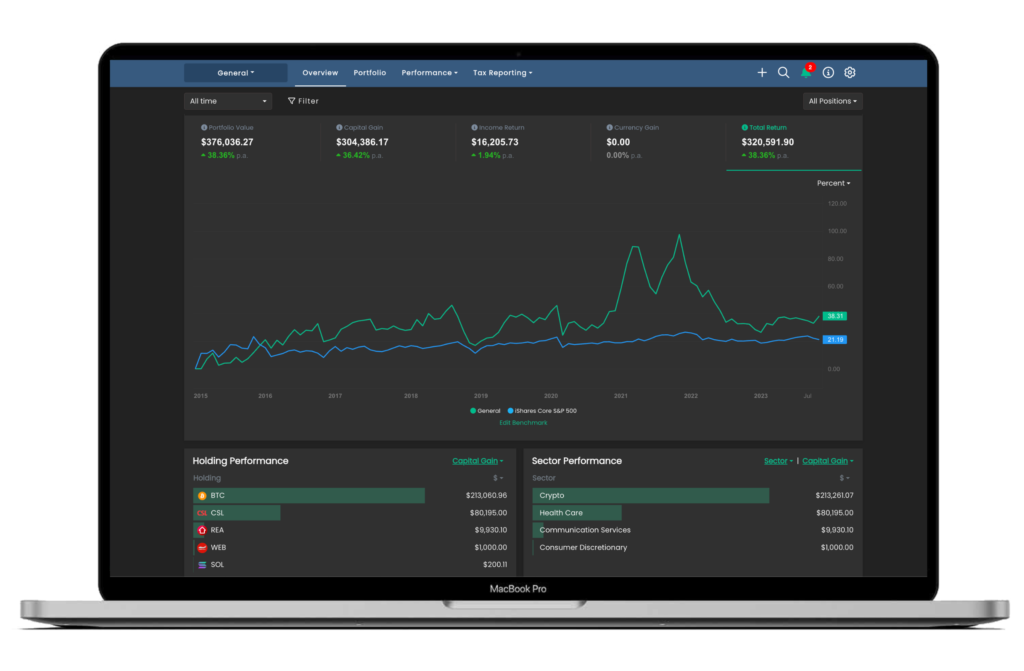
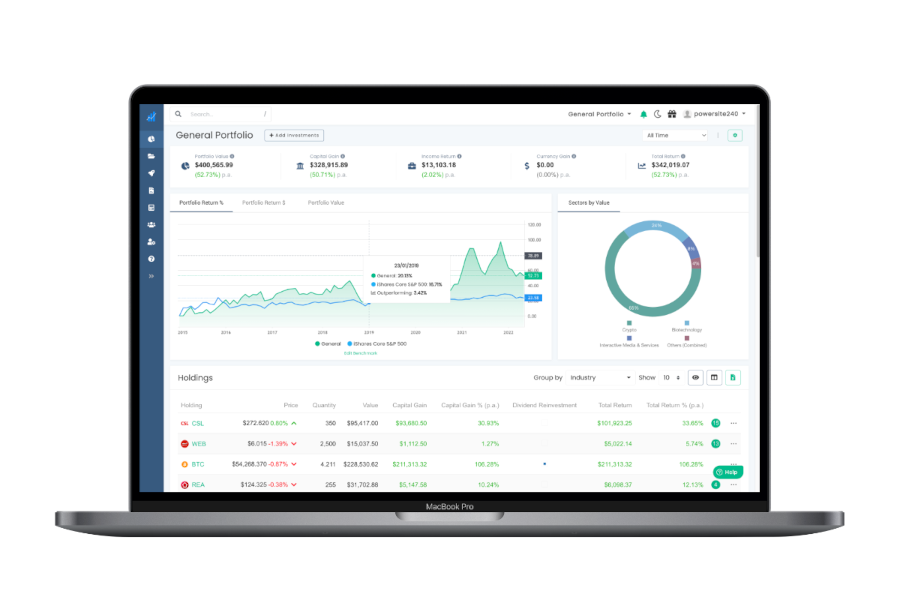
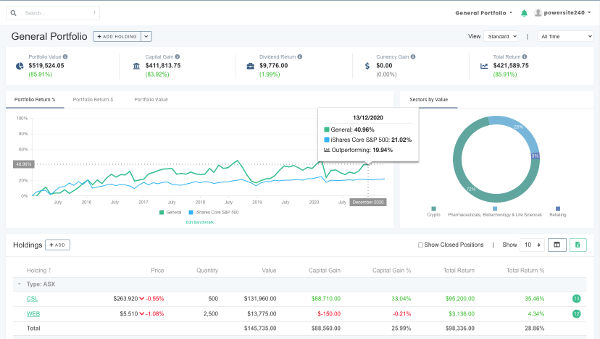
As I said, given that we operate one such tracker, this is obviously a biased opinion. But take a look at this screen compared with the one from my trading account:

portfolio tracker

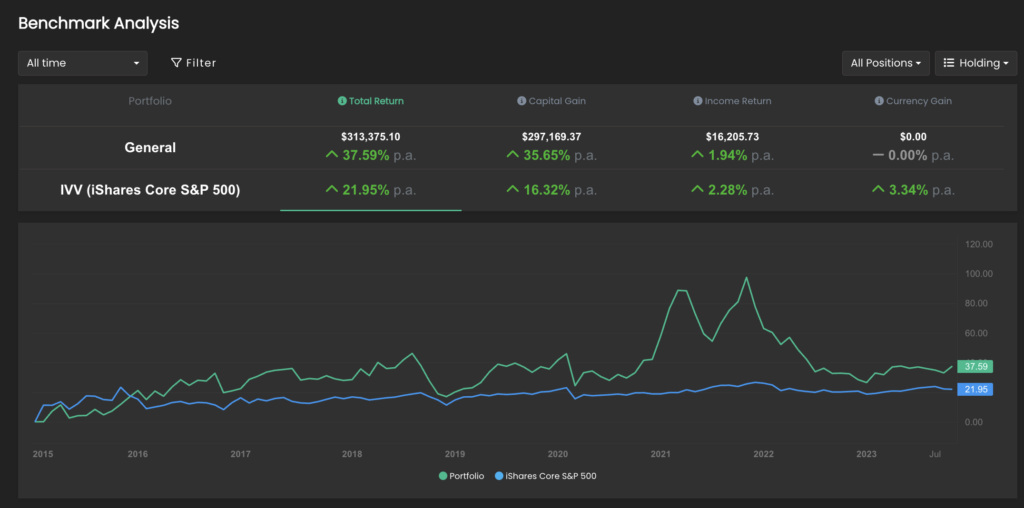
That’s the Portfolio Performance Report in Navexa. Rather than providing just a handful of metrics about profit/loss and price changes, this screen shows four key metrics:

Total Return: In both dollar and percentage terms, the Navexa portfolio tracker shows me my portfolio’s actual, annualized return net of trading fees, income and currency gains (or losses).

Capital Gain: This shows me how much of my total return is comprised of capital gains across my investments. Again, this is annualized to reflect how long I’ve been running this portfolio (otherwise, my ‘gain’ would be the same regardless of whether it had taken me one year, or twenty, to achieve).

Dividend Return: This shows me how much of my annualized return over a given time period is down to my investments generating dividend income. In my CommSec account, for example, I can’t see my income factored into my portfolio performance.

Currency Gain: While not applicable in the example above, the reality of investing across multiple markets and currencies is that foreign exchange fluctuations impact a portfolio’s returns. A dedicated portfolio tracker, like Navexa, shows this.

You’ll also see, beneath the metrics I’ve just detailed, there’s another row showing the same numbers for IOZ, a leading ASX200 ETF.

This allows me to see at a glance how the portfolio is performing relative to the ASX200 across each of these factors. In the example, you’ll see that while the annualized return and capital gain is outperforming the benchmarked fund, it is lagging behind with respect to dividend income.

This is a valuable insight — and not one I can easily get by looking at my trading account.

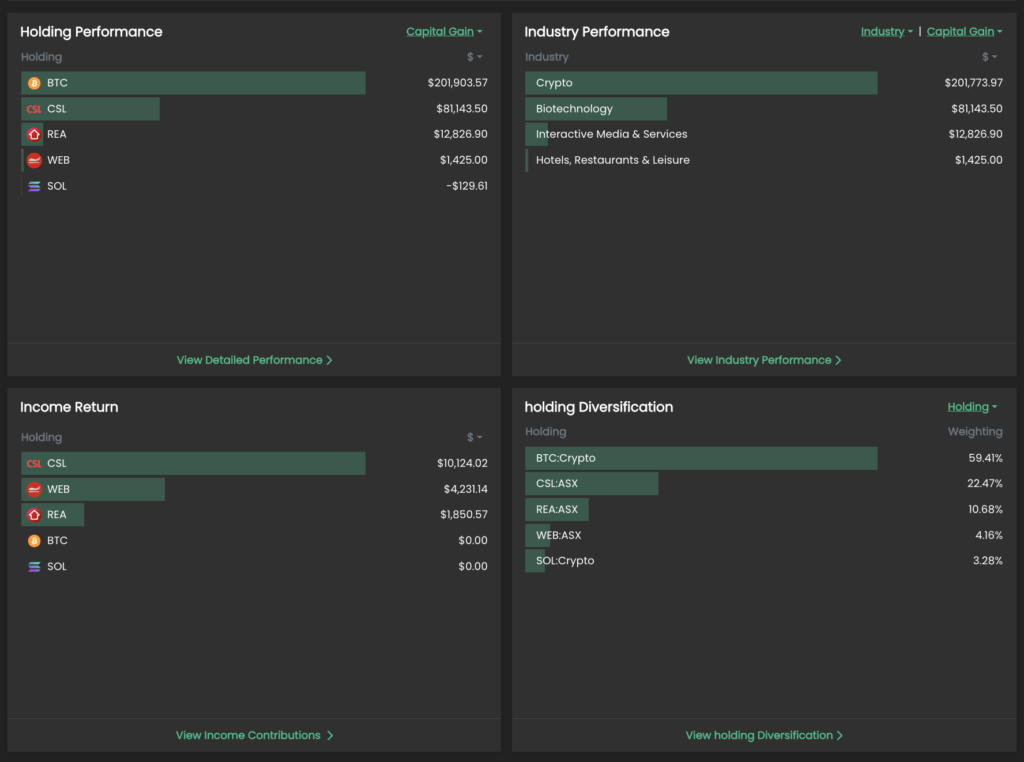
In the holding list below, you can see the performance breakdown for each of the investments in the portfolio.

All the numbers you see reflect more than just the price movement of the investments. Here’s an example.

Fees & Commissions Impact Your Performance (But May Not Be Reflected In Your Brokerage Account)

My trading account doesn’t show me how fees are impacting my performance. That’s probably because I pay my broker to execute my trades for me. But consider this:        

Let’s say I make 50 trades a year for 10 years at a cost of $20 a trade.

That’s $10,000. At the end of the 10 years, say I have 50 investments in the portfolio. When it’s time to sell out and collect the cash I’ve (hopefully) earned as the portfolio’s total value has appreciated over that time… that’s another $1,000 for all the sell trades on the 50 holdings at the end of the period.

The impact of fees? $11,000.

If the portfolio had started with $50,000, and we assume a 100% total return over the 10 years (that’s a 7.18% annualized return), the investor has, on paper, doubled their money.

Hooray! Right? Not quite. 

You can see how this plays out in terms of actual portfolio performance.

For our purposes in this post, I hope you can see that trading fees play a major part in determining your true performance. Which is why you need to be able to easily see your returns net of that impact — as opposed to hidden away, as they are in many trading accounts.

Fees Aren’t The Only Factor: A Dedicated Portfolio Tracker Helps You Measure Everything Impacting Your Performance

While my CommSec account is, in my opinion, brilliant for conducting market and investment research (their tools and resources are second to none across Australian trading platforms), it’s severely limited in showing portfolio performance details.

When you really dive into the world of long-term wealth building, there are four factors that deeply affect your real returns.

Remember, I’m not talking about gains here. I’m talking about our net performance after every factor impacting a portfolio has been accounted for.

Here are the four factors:

Time: While it might be tempting to look at your overall returns going all the way back to the first day of a portfolio’s life, this can result in us misinterpreting our performance. My favourite illustration of this? Would you rather make a 500% return over one year, or 10? There’s a huge difference, and we all know it. Leaving time out of our portfolio performance calculations is straight up wilful blindness.

Trading Fees: As we lay out in detail, trading fees can and often do have a significant impact on portfolio performance. Looking at your tasty triple digit ‘gain’ in your trading account might feel nice, but when you add up the cost of all the buying and selling it’s taken to achieve that gain, the reality is probably not quite so glorious.

I have a friend who sold some crypto recently and, thanks to my incessant nagging about true performance, accepted that, while they’d made a healthy profit, they’d handed over a huge percentage in exchange and account fees.

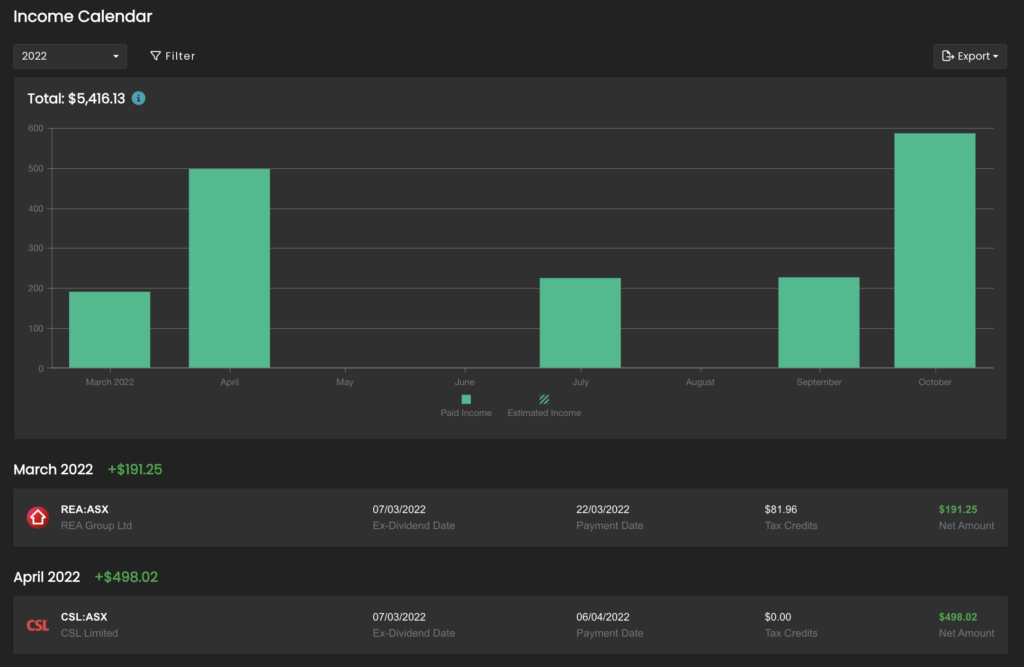
Income: This one’s a counterbalance to time and trading fees. If I have a $100,000 portfolio that generates $10,000 in income every year, that’s a massive factor in my overall performance and returns. While my trading account only shows me my capital gains on an investment, my portfolio tracker shows me my total return including dividend income — and breaks down how much of my return constitutes income versus capital gains.

Taxation: Now this one’s a little different. But the reality is — especially for those of us investing with a view to financial independence or early retirement — we must pay a significant percentage of our profits to the government when we sell out of investments. This is important to consider when you’re assessing what you’ll gain from buying and selling stocks. It doesn’t impact your portfolio performance per se, but it does massively impact your financial outcome as you draw down or completely exit a portfolio.

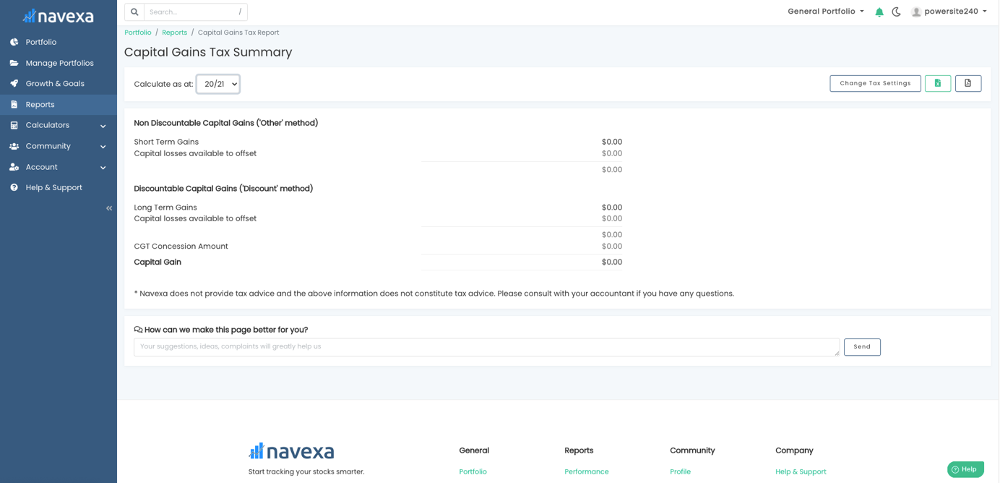
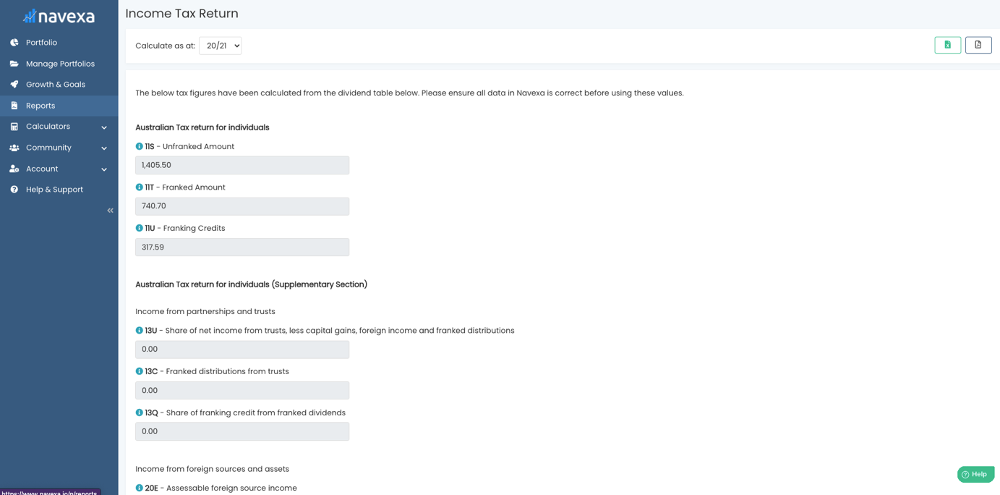
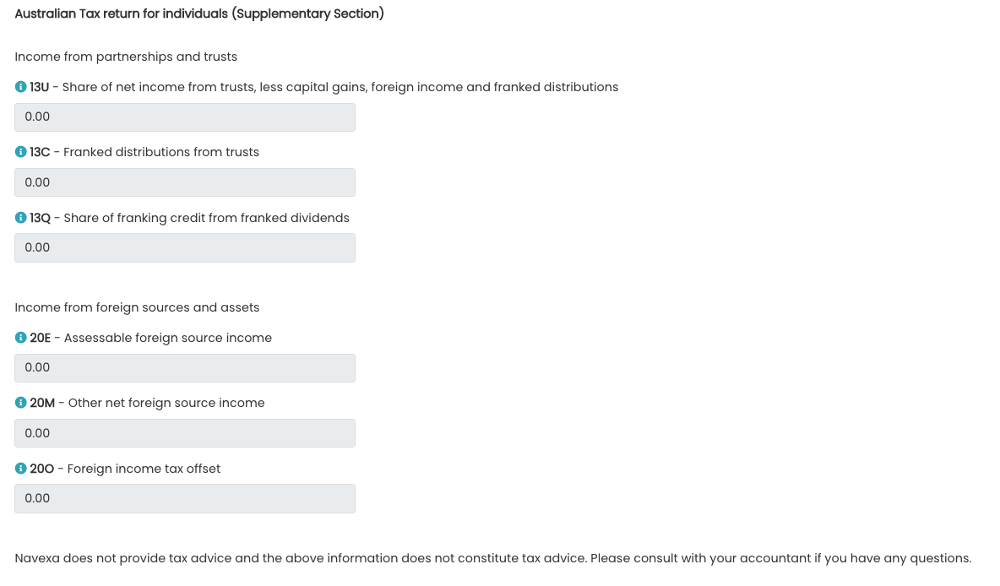
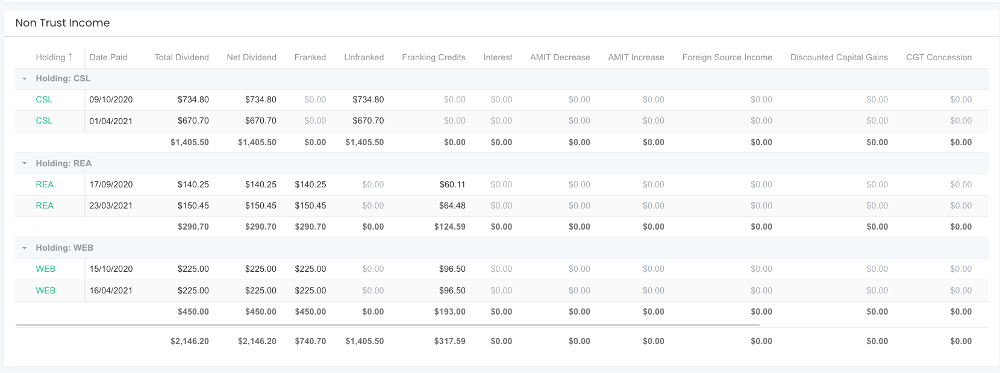
(FYI: Navexa provides automated CGT and income tax obligation reports, plus an Unrealized Capital Gain report to help you assess and forecast your portfolio’s taxes.)

Currency gain is also important, but of course not all of us invest beyond our home markets. In Australia, in fact, the majority of investors doesn’t stray beyond the ASX, although this is gradually shifting as more services arrive to facilitate offshore investing through new platforms and apps.

Another point here is that Navexa’s portfolio performance calculation is money weighted. That means it accounts for inflows and outflows of cash in your portfolio. This is because the reality for many of us isn’t as simple as making an initial investment and leaving it alone. Rather, we buy and sell as we go.

A money weighted return is different from a time weighted return, which doesn’t account for cash inflows and outflows.

Navexa portfolio tracker

How Navexa Tracks Your Portfolio’s Performance With Automated Accuracy

When I set out to build Navexa, I just wanted a tool that would save me having to combine the data in my trading account with my own manual calculations in order to work out my true portfolio performance.

I — like many of the Navexa community — am a long-term, buy-and-hold investor to whom strong, annualized returns matter more than eye-grabbing one-off gains.

I’ve been learning about money and wealth creation for a long time. Everything I’ve learned has taught me it’s far better to work with hard data than skewed or incomplete information about a portfolio.

This is why the Navexa Portfolio Tracker, today, is one of the leading portfolio tracking platforms in Australia. We calculate annualized portfolio performance that accounts for all the factors I mention above.

Once you load your portfolio into Navexa, you start seeing true performance over the long term. You can see at a glance your capital gains, currency gains, investment income — all net of your trading fees.

You can run comprehensive tax reports with a couple of clicks. You can track & analyze more than 8,000 ASX & US-listed stocks and ETFs, plus cryptos, cash accounts and unlisted investments (like property).

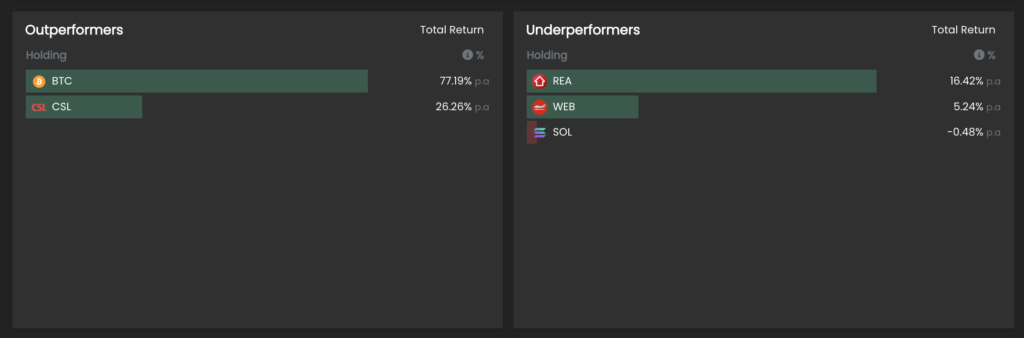
And, you can go even deeper, running reports like Portfolio Contributions, which shows you in chart form which of your investments are boosting (and which are dragging down) your overall performance.

Like I said, I’m biased, since I started Navexa. But I wouldn’t have had to — and thousands of satisfied members wouldn’t be tracking with us — were it not for my trading account failing to provide a full and clear picture of my portfolio performance.

Trading accounts are for trading. Navexa is for portfolio tracking. If you’re doing the former, you should, IMHO be doing the latter, too.

Happy tracking — create an account here (zero obligation & no credit card required!).

Categories
Financial Literacy Investing

The Truth About Ethical Investing

Ethical & unethical investments may not be what you think

Last month, Australia suffered destructive and widespread bushfires.

Debate around climate change, fossil fuels and sustainability heated up as large parts of New South Wales and Victoria burned.

But this debate is not new.

You might have seen the ‘clean money’ ads for Bank Australia, targeting customers who want to know their savings and investments are not funding destructive, unethical business activities.

The idea of ‘ethical’ investing is the idea of aligning your investments with your own ethical code.

In this post, we’re taking a quick look at what makes an investment ‘ethical’ or ‘unethical’.

Before we launch into it, a disclaimer: We’re not trying to tell you what you should do with your money.

(However you choose to invest, we provide a powerful portfolio tracker to help you track and analyze your portfolio.)

We’re exploring the question because we believe it’s beneficial to consider how your wealth building lines up with your personal — and your community’s — values.

So, pour yourself a glass of scotch or herbal tea (no judgment from us either way!) and let’s get into it.

Gambling, Drinking & Sex: Classic ‘Unethical’ Investments  

A highly developed stock exchange cannot be a club for the cult of ethics.”

Max Weber, German Economist

You can generally classify unethical investments as those which derive profits and returns from activities that harm or negatively influence people and the environment.

Making money from casino businesses, the sale of tobacco and alcohol, or prostitution are classic unethical investments.

Why?

Because those activities rely on consumers who are — in the case of tobacco — addicted to a significantly harmful product.

And yet, as the great Warren Buffett (who we seem to mention time and again in our posts — see the post that sparked a comment war on social media) says…

The sale of tobacco not only generates high profit margins.

It also cultivates a vast and loyal consumer base that supports business even as regulation and tax drives prices higher.

In other words, what makes that product unethical is the very thing which makes it a sound investment from a purely financial point of view.

As society has become more conscious of peoples’ impact on the planet and climate, the definition of unethical investing has evolved.

Today, you can say that any business that damages the planet is not an ethical investment.

Fossil fuels, logging, mining and other operations that seek to extract value from the earth by plundering natural resources for profit.

Again, though; these businesses can deliver huge returns.

Consider the returns rare earths and industrial metals mining have produced as we’ve moved through the industrial and technological ages.

As the German economist Max Weber pointed out, the market can be a tricky place to practice one’s ethics.

Because generally speaking, we enter the market to make money for ourselves.

But for many investors in the midst of the current generational shift, there are other considerations than simply maximising returns.

Protecting Planet And People:
Modern ‘Ethical’ Investments

Being an economist is the least ethical profession,
closer to charlatanism than any science
.”

Nassim Nicholas Taleb

Ethical investing largely boils down to the idea that we should not make money from any business that profits from inflicting harm to living things.

People, animals, the environment; these things must be protected and respected at all costs.

So instead of investing in fossil fuels, you might put your money into renewables.

Instead of investing in aggressive property development that impacts the environment, you might invest instead into community-focused, sustainable housing projects.

Or, you’ll park your money with a fund or bank who pledges to manage it in line with a clear ethical code.

You might think that investing ethically would drastically compromise your potential to earn a good return.

But one look at Canstar’s managed funds comparison table and you’ll see one ethical Australian fund is vying with the established aggressive players.

History shows that some of the most unethical businesses — illicit drugs, gambling, mining and burning fossil fuels — are some of the most lucrative.

The way of the ethical investor has tended not to bring such generous returns.

That’s because ethical investing is an attempt to balance the inherent selfishness of wealth building with a broader minded, ecologically-driven attempt to give back — or at least to take sustainably.

But don’t underestimate the shift happening in the economy and broader society right now.

In Australia, you now have options for ethical investing from banking and superannuation through to investment funds and companies that are ‘B Corporation’ certified.

Would you have guessed that an ethical managed fund could offer an annual return within a few percent of the top performing ‘unethical’ fund?

The times they are a changing.

‘Ethical’ Doesn’t
Always Mean ‘Green’

As with most things, the ethical investing debate is not black-and-white.

There’s a grey area.

And it is vast and shaded.

When you break it down, an ethical code is an ethical code.

Whether that code is good or bad is subjective and open to debate between individuals and within the community.

One definition of unethical is any decision that goes against one’s own ethical code.

So if you believe that climate change is not real, that there is no cost to burning fossil fuels and so forth, but you invest in a business focused on planting sustainable forests, you could say that you are making an unethical investment.

Even though the place you’re putting your money is considered ethical based on its actions, your investing in it would be unethical because it doesn’t line up with your beliefs.

The debate around how we make money at this point in history, which businesses and organizations we choose to support, is more heated than it has ever been.

So where do you stand? To what extent do your beliefs inform your investments?

Today, more than ever, it might pay (financially and otherwise) to take a look at how your portfolio lines up with your own ethics.


Whatever your ethics, understanding how your money is performing in the modern financial market requires a specific set of digital tools.

Navexa provides these tools.

Go here to learn more.

Categories
Financial Literacy Investing

How To Become A Self-Directed Investor

Part I in our series on self-directed investing.

Do you trust your financial future to someone else, or do you take charge yourself?

It’s a fundamental question you have to answer on your journey to building wealth.

If you’re just getting into investing, or you’re considering taking over control of your portfolio for the first time, there’s a lot of information to get your head around.

In this series of posts, we aim to introduce you to the ideas, skills and discipline involved with taking ownership of your own portfolio.

Never has grasping the principles of self-directed investing been more important.

According to Canstar, ‘we are in the midst of the most significant shift of power in the finance world of the past decade’.

What is this shift?

It’s the rise of the self-directed investor.

Generation X and Y will control about 70% of financial assets within the next 10 years.

We’ll control these assets amid unprecedented trends using new technology and services as we create wealth and build our financial future.

So, will you leave your investments and wealth building to a third-party advisor or manager?

Or…

Take Ownership Of Your
Portfolio Management

The better you understand yourself, the better you’ll become.
You’ll be better. You’ll do better
.” — Jocko Willink

Managing your own portfolio is a way of taking direct control of your financial future.

You choose what to buy, what to sell and when to buy and sell it.

You choose your asset allocation.

You choose the types of stocks you invest in.

If you have a vision for how you want your life to be — especially when you retire — then it makes sense that you should steer your investments instead of paying someone else to do so.

But, it only makes sense if you have…

The time, the inclination and the discipline.

Portfolio management requires focus and energy.

But when you look at how those whose full-time job it is to manage other people’s money perform; you can see why it can be worth taking ownership.

This article from Liberated Stock Trader reveals that more than 60% of fund managers failed to beat the wider market over a 12-month period.

Over three years, a staggering 92.91% failed to beat the market index.

Now, if the market is rising, it’s not the end of the world if a fund manager fails to beat it.

If stocks rise 10%, you theoretically increase your portfolio’s value by the same amount.

The thing is, you’ll pay the advisor or fund manager a percentage for achieving nothing more than the broader market did anyway.

Worse, you’ll pay them for a return that is actually below what you would have made simply investing in an indexed fund.

And worse still…

You won’t gain the knowledge and understanding that comes from taking ownership of your own investing.

As retired Navy SEAL commander, Jocko Willink, points out, the better you understand yourself, the better you’ll do.

In other words, by taking ownership of your own investments rather than paying someone else (who probably won’t beat the market)…

You can directly guide the investments that will determine your financial future.

Are you ready for that?

Great. Next, you’ll want to…

Learn From The Portfolio Management Masters.

Someone is sitting in the shade today because someone
planted a tree a long time ago
.” — Warren Buffett

Taking ownership means you will need to take guidance from others who have done the same.

You can save yourself having to learn hard lessons by studying those who’ve learned them before you.

You will have at least heard the name Warren Buffett.

The finance world generally regards Buffett as the king of investing.

Buffett followed the principles set out by Benjamin Graham to amass a multibillion dollar fortune.

If you’d invested $10,000 with Buffet’s Berkshire Hathaway in 1965, that investment would now be worth more than $50 million.

But more amazing than the gargantuan long-term gains the man has achieved are the simple principles he has followed to get them.

Buffett researches his investments in depth, sticks to a proven formula for selecting sectors and companies, and doesn’t let emotion or hype dictate his decisions.

He’s also deeply patient, claiming his favourite holding period for an investment is ‘forever’.

He has built his wealth by thinking about the long term.

His mentor, Benjamin Graham, is the man behind the ‘value investing’ idea so central to Buffett’s success.

This is the idea that an investment should be worth a lot more than you pay for it.

Graham believed in fundamental analysis. He looked for companies with strong balance sheets, little debt, above-average profit margins, and ample cash flow.

In other words, good companies with favourable outlooks. Simple, right?

Buffett and Graham are just two investing masters you can learn a lot from.

But the list of intelligent, wealthy investors willing to share their knowledge is long and worth diving into as you create your own strategy.

Check out Ray Dalio, John Templeton and Peter Lynch (and feel free to suggest your personal favourites in the comments!)

Three Questions To Ask
Yourself Before Becoming
A Self-Directed Investor

OK, so you know you’re living in a time of massive change.

Generation X and Y are becoming the dominant forces in the financial markets.

The way we invest — our values, objectives, the tools and tech we’re using — is changing rapidly.

Financial advisors and mutual funds tend not to deliver great returns (especially when you take their fees into account).

The masters like Buffett and Graham prove that self-directed investors can flourish if they deploy strategy, patience and critical thinking in a disciplined fashion.

You want to take ownership and start managing your own portfolio.

This great article from Forbes suggests you ask yourself four key questions before you take the reins.

Are you truly motivated to
become a self-directed investor?

This isn’t as simple as yes or no.

Rather, define the precise nature of your motivation.

Maybe you’re taking control back from a financial manager and want to maintain a certain performance level while saving on fees.

(Consider that a $1 million portfolio might cost up to $12,000 in fees a year.)

Perhaps you want to test out a particular strategy to boost your returns and take on more risk.

Or, maybe you’re looking to invest in a specific area of the market you understand and are passionate about.

Whatever your motivation, be clear about it from the outset of managing your own investments.

Will you make the time to manage your portfolio?

Managing your portfolio isn’t a full-time job.

But it will take a serious commitment of both time and energy.

If you’re just learning about investing your money and implementing a strategy, be patient and prepared to dig in — especially at the start.

Your investing style will also affect how much time you need to commit week to week.

If you’re a buy-and-hold type of investor, you might not need to keep tabs on your portfolio as much as you would if you were a day trader.

Either way, understand that taking ownership of your investments like this requires a significant time commitment. 

What knowledge do you already have — 
and how much will you learn as you go?

You don’t need a finance degree to manage your own portfolio.

But, you do need to be able to interpret large amounts of information — about the markets, the business world, your own financial goals — to make good decisions.

Don’t invest beyond your current level of knowledge.

Seek guidance from those more experienced.

Use second and third opinions to your advantage.

But most of all…

Turn every experience you have managing your own portfolio into a lesson you can implement next time you make a decision.

Taking ownership of your invested wealth means making a commitment to learning all the time.

I hope this first part in our self-directed investing series has been helpful to you.

Please let us know your thoughts and opinions in the comments.

And keep an eye out for part two, coming soon.