
For the everyday investor, the world of short selling can seem like a dark and mysterious art. Perhaps one of the least understood terms in it is the ‘short float’. In this article, we explain what short float means, how it fits into trading, and how some investors use it to find profitable trades.
What is a short float?
Like many jargon terms you encounter when you get into the investing world, the short float is an often misunderstood — but relatively easy to grasp — term.
In this post, we explain what a short float means, why it exists, and how understanding it applies to everyday investing.
Plus, we share some examples of how investors and traders use the short float when they’re researching and executing trades.
Breaking It Down: What Is A Stock’s Float?
In the context of investing, the ‘float’ refers to the number of a company’s shares that are available to the public at a given time.
See, not all a stock’s shares are available for the everyday investor to buy or sell.
Shares are generally divided up into restricted and unrestricted groups.
Restricted shares are those issues to directors, executives and corporate affiliates.
The rest are available to the market.
It’s these unrestricted shares that constitute a stock’s float.
It’s important to understand that the size of a stock’s float (in other words, the total number of shares available on the open market) can impact its volatility.
A smaller float could mean it’s more difficult to buy or sell shares.
You might think checking a stock’s ‘shares outstanding’ figure will give you an indication of its potential liquidity.
But, it’s important to understand that the float is different from shares outstanding.
While shares outstanding refers to the total number of shares a stock has (including restricted shares), the float refers only to those actually available for everyday investors to buy and sell.
Short Selling: A Brief Explanation
You might have heard the term ‘short selling’ when the Gamestop story was in the headlines in early 2021.
Short selling — or just ‘shorting’ for… well, short — is when you borrow shares from a stock broker and sell them to another investor for a given price.
You also agree that you will buy those shares back at a specific time.
If you borrowed $5,000 worth of shares in a company you thought was going to be trading 50% lower in three months — and your prediction proved correct — you’d be able to buy those shares back for $2,500, return them to your broker and pocket the other $2,500.
That’s shorting in a nutshell.
It’s a way to potentially profit from prices falling instead of rising.
It’s important to note that you can’t short sell shares you own.
You have to borrow them, sell them, buy them back and return them to make money from shorting.
There have been many famous and infamous examples of traders making their fortunes by shorting assets and markets.
Kyle Bass, for example, bet about $4 billion against US subprime mortgage-backed securities right before they sent the global markets into a crash.
Intelligent Portfolio Performance Tracking
Track Australian & US trades, cryptos, cash accounts, currency gain, dividend income and more with the Navexa Portfolio Tracker.

The Short Float Explained
A stock’s short float is the percentage of shares which investors are shorting relative to the total available — or floated — shares.
Another term for it is ‘short interest’, which says it all.
Learning about a stock’s short float means you’re learning how many investors are betting that the share price is going to fall.
According to ragingbull.com, the short float for a given stock rarely exceeds 50% — although it’s not impossible.
Generally speaking, you could say a stock had substantial short interest if the short float were above 40%.
A figure like that tells you that 40 in every hundred of a company’s unrestricted shares have been borrowed by short sellers.
Remember, shorting a stock involves borrowing from a broker, selling at market prices and agreeing to buy back and return at a specified time.
What does that mean for the everyday investor?
Primarily, you might look to the short float as an indicator of market sentiment.
While I personally prefer a value-based fundamental analysis approach, you could, for example, use the short float information to compare against a stock’s fundamentals to gain a clearer idea of where the price might be going.
How Do You Find Information On A Stock’s Short Float?
The exchange on which a stock trades should publish the numbers indicating short interest regularly.
The NYSE publishes short numbers twice a month, for instance.
Check with your local exchange to make sure you know where and when to access the data.
How Understanding A Stock’s Short Float Could Help
While the short float isn’t a complete indicator of coming price action or sentiment around a stock, it can help you understand a couple of things.
If you find that a stock has high short interest, this may mean that the company is struggling and that prices are indeed on their way lower.
If you are comfortable and competent with short selling, perhaps you’ll choose to use that as an opportunity to short.
Or, according to ragingbull.com, high short interest may be indicating that while a stock could be about to drop in value, investors are expecting the price to bounce back.
They may be trying to short the stock lower and then buy shares before it rebounds — trying to profit on the way down and the way up.
It’s never going to be obvious exactly what high short interest indicates about a given stock. There’s many possibilities.
That’s why, in my case at least, I’d be looking to pair my understanding of the short float with other forms of analysis.
For me, that would be fundamental analysis and company valuation.
For others, maybe that means technical analysis or research into news around the business and future events that could impact its profitability.
If 40% Is A High Short Float, What’s A Low One?
This trader points out that in 10 years of trading, they’ve seen a lot of short float data.
It’s possible that a short float can go to zero — that there are no borrowed shares at all and no one willing or able to short the stock.
That’s rare though.
Generally, you’d consider a stock to have a low short float if it were around 10%-20%.
When there’s little supply, as in a low float, it won’t take as much volume to produce a price movement.
For example, 10,000 shares changing hands in a stock that has a float of 1 million would, in theory, create a bigger price movement than if that stock’s float were 10 million.
In terms of the short float, this relationship between the amount of shares available and the volume matters, too.
- It’s important to understand that float matters relative to volume.
- You can think of the float as the supply of shares at any given time.
- You can think of volume as the demand.
Calculating The Short Interest Ratio
The short interest ratio is a means of understanding what a stock’s short float could tell you about upcoming price action.
You can work out the extent to which short sellers are targeting a stock by calculating its short interest ratio.
How do you do it?
It’s easy.
You just need to find the short float number — remember, that’s just the amount of available shares traders have borrowed for short positions.
Then, divide that number by the stock’s average daily volume.
Some investors will refer to this ratio as ‘days to cover’.
The short interest ratio will give you the approximate number of days it would take for the market to ‘cover’, or buy, all the short positions in the stock.
The bigger the ratio, the longer it could take for the market to buy the shares from the short sellers.
And the longer it would take the market to buy those shorted shares, the higher you’d judge the short interest in that stock.
The short interest ratio will rise and fall as trades and volume fluctuate.
Trading Stocks? Track Them With Navexa
Import your portfolio in seconds. Track your investment performance. Automate your tax reporting & more.
How Investors Can Use The Short Interest Ratio
Here’s a great example of the short interest ratio at play with Tesla.
Take a look at the charts:
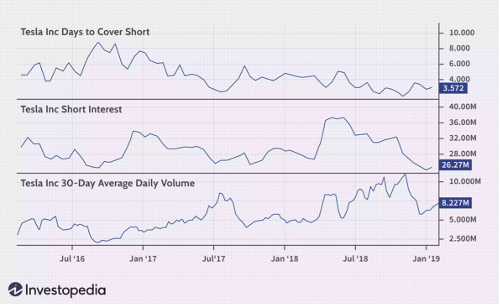
The three charts show…
- How many days it would take for the market to cover the Tesla short positions — in other words, the short interest ratio.
- The number of shares borrowed for short selling (the short float).
- The daily average trading volume for Tesla stock.
This example illustrates that the relationship between the short float, short interest ratio and volume don’t always move in sync with each other.
According to the article:
‘In July and August 2016, the short interest ratio rose despite the number of shares short falling.
‘That was because the daily average volume fell sharply during that time.
‘Additionally, the short interest was steadily declining in 2018 despite short interest being elevated because the average daily volume was steadily rising on the stock.’
You can see that — as with most things in investing — understanding the short interest in a stock is not an exact science.
It’s important to consider information like the short float, short interest ratio and volume in relation to one another.
Short Interest Ratio Limitations
One of the main limitations of the short interest ratio — and the short float — as an indicator, is that it’s only updated relatively infrequently.
Generally, the market reports the short float (and therefore the short interest ratio) every fortnight.
By the time that information reaches the market, the short positions in a stock could have grown or shrunk.
Volume, too, fluctuates far more frequently than every two weeks!
The short interest ratio — even if were updated on a daily basis — is really only a guide.
Current events and market news also impact trading volumes greatly.
Think of the stock in the example from Investopedia above, Tesla.
This is a stock that often produces dramatic price movement thanks to its high profile business operations and highly visible CEO.
If you were looking at the short interest ratio on the day Tesla announced its massive Bitcoin investment in early 2021, for instance, and that information was two weeks old, the numbers probably wouldn’t be accurate at that time.
Short Float Versus Short Interest Ratio
Now that you know what the short float and the short interest ratio are, be sure to understand the difference between the two.
Remember, the short float is the number of unrestricted shares investors have borrowed to short sell in the hope that they can buy them back at a lower price.
Investors will sometimes refer to the short float as short interest.
But short interest and the short interest ratio are two different things.
The short interest ratio is a formula you use to determine how many days it would take the market to buy — or cover — all the shorted shares.
Now You Know How To Determine & Interpret The Short Float
If you came into this blog post unsure about what short selling, short float and short interest meant, I hope you now have a much better idea.
Like other methods of analyzing a stock, trying to interpret short interest isn’t an exact science.
When you’re sizing up a potential investment and trying to determine whether you want to risk your capital on it — and bearing in mind this post is general information, not investment advice — you can never be 100% sure what a stock is going to do next.
But, what you can be sure of is how your investments and portfolio are performing to date given the decisions you’ve made.
While past performance is no guide to future returns, understanding the details of your portfolio performance is, I believe, a crucial part of forging a profitable wealth building journey.
That’s why my team and I developed the Navexa portfolio tracker — a platform that gives you in-depth true performance analytics on your stocks, ETFs, cash accounts, cryptocurrencies and even unlisted investments like property.