One of the first stocks I ever bought was a total disaster. Or so I thought.
After holding it for five years, the value had risen 0%.
I would have been better off loaning the money to a friend and asking them to pay me $1 in interest.
So I logged into my broker account to sell my shares.
Before I hit ‘sell’, I figured I’d work out how much money the shares had generated in dividend income.
To my utter amazement, the dividends had nearly paid me back my whole investment.
This changed my perception of the investment completely.
What I thought had made me nothing has, in reality, returned 100% — just not in the capital gains I was looking for.
This is the power of knowing all the factors of investment performance.
Unfortunately, most investors don’t have an easy way to calculate things such as dividend performance.
This means they end up making poor decisions based on incorrect data.
And as a data-driven investor, this pains me.
Here are the four things you absolutely must understand about any investment.
1. Capital Gains
Obvious, right?
Most investors buy into an investment, hoping that the price will go up, resulting in a capital gain.
This is one of the main metrics to track for any investment.
Like I said, obvious. But important.
2. Dividend Income
As you saw in my story about the stock I nearly (stupidly) sold, dividends can have a huge impact.
If I hadn’t calculated the investment income and factored it into my performance, I could’ve sold this holding and ended up missing out on future profits.
Not only that, dividend income — in Australia at least — carries tax implications. These are difficult to manage if you’re not property tracking your investment income.
3. Currency gain & loss
This one is crucial when investing in foreign stocks.
Currency exchange rate fluctuations can massively impact investments.
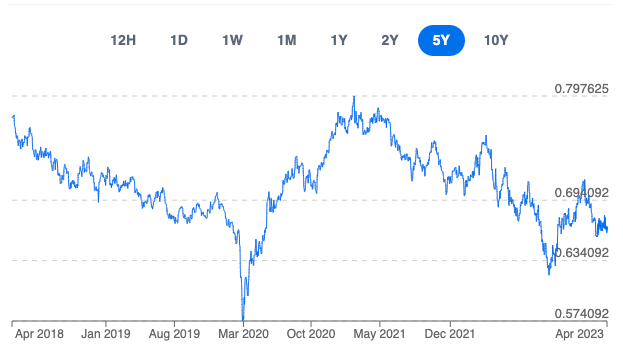
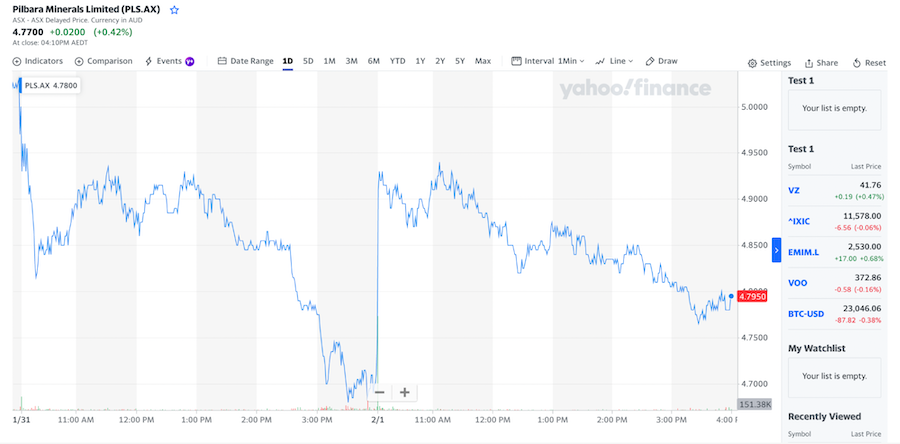
See the USD/AUD currency chart for the last 5 years.
Say you bought a $10,000 dollar investment in a US stock from Australia, in March 2020.
In December 2020, the exchange rate completely turned around in dramatic fashion.
Assuming the share price of the stock hadn’t changed at all.
You would have made a 32% loss, on the currency movement alone.
Sometimes this shift is against you and other times it can make you a lot of money.
But if you don’t measure it, you’re not going to know, either way.
4. Time
What do you mean time?
Well let me ask you, would you rather make a 100% gain in one year…
Or a 100% gain over five years?
Basically anyone I know would choose the first option. So would you, right?
Look at this scenario.
You buy ‘Stock A’ for $1 and in the first year it goes up to $2.
Happy with the 100% gain, you keep a hold of this stock for another year.
But in that year, the price stays at $2.
So now instead of a 100% return, you now have an annualized return of 50%.
You can see if this plays out across a few more years staying at $2, it quickly eats away at your performance.
Which is why it is crucial to factor in time when you analyze your investment performance . This is what we mean when we talk about ‘annualization’.
These Are The Four Pillars of Investment Performance
Capital gains. Income. Currency gains. Time.
These are what I call the four pillars of investment performance.
Any investor who’s serious about building wealth long term should, in my humble opinion, understand and track these factors.
Remember how I nearly sold a stock that had doubled my money?
These are the sorts of poor decisions investors might make if they don’t have all the information.
It’s very rare for anyone to fluke their way to success or wealth.
For most people, a plan, a strategy and a certain amount of discipline is a much better path than trying to get rich quickly with a financial fluke.
This is why I’m a data-driven investor.
Because if you can’t measure it, you can’t improve it.
Pen and paper. Then a spreadsheet. Now digital apps. You no longer need to do napkin maths to figure out how your investments are doing thanks to automated portfolio trackers like Yahoo Finance and Navexa (that’s us!).
Portfolio trackers consolidate disparate data about holdings, kept in different accounts (stocks, bonds, mutual funds, crypto, etc) and provide real-time analytics about your assets’ performance. So that you can know how much you’re earning each day and stay on track with your financial goals.
But a modern portfolio management tool does more than suggest when to buy or sell. The best-in-class apps also provide a snapshot of your investment returns, which include annualized capital gains, dividend payouts, and brokerage fees. With this data, you can proactively adjust your stakes in different asset classes and minimize risk exposure.
In this post, we compare Yahoo Finance and Navexa — two popular trackers, used by Australian and global investors alike.
Yahoo Finance
Yahoo Finance is best known as the go-to financial data hub for quantitative and qualitative research on new stocks, mutual funds, or alternative investment funds. But Yahoo also offers a simple portfolio tracker, which allows you to monitor the assets’ performance in real time via a spreadsheet-like online dashboard.
Main features:
Real-time data on financial market performance (including crypto)
Ample fundamental market data for technical analysis
Custom alerts for tracked assets and asset classes
Navexa
Navexa is an investment portfolio tracking app with tax reporting features. Connect your online brokerage accounts to track all your investments from one dashboard. Improve your asset allocation with real-time reports on asset performance, capital gain returns, and dividend income.
Integrated tax calculators for CGT, trust, and foreign-sourced income
Reports inclusive of dividends, currency fluctuations, and brokerage fees
Features and Functionality
For this review of portfolio management software, we’ve set up test accounts on Yahoo Finance and Navexa to assess the main features from a new user perspective.
Both apps promise to facilitate portfolio monitoring. But the scope of offered functionality differs a lot.
Investment Portfolio Tracking
Yahoo Finance offers two portfolio tracking options:
Basic,which supports only Buy transactions and doesn’t support cash management or Lot trades.
Portfolio 2.0, which supports other transaction types (Buy, Sell, Short, Buy to Cover Transactions), plus cash accounts, lots, and dividend management.
Disclaimer: At the moment of writing, Portfolio 2.0. functionality was still in beta and the dividend feature didn’t work properly during tests.
Yahoo Finance allows adding multiple investment portfolios to one account. For each, you get a separate dashboard view. That’s convenient if you’re just selecting stocks or private equity funds and want to model different asset allocation scenarios.
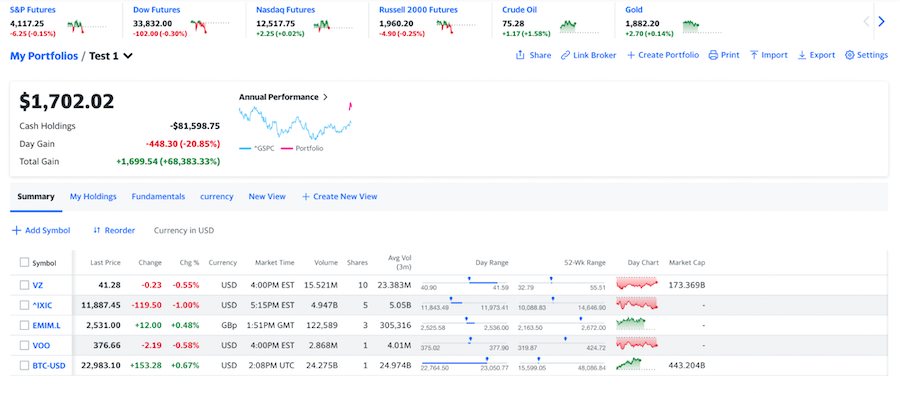
Once you’ve listed your holdings (manually or by linking a brokerage account), the main account dashboard comes to life:
All investment data is updated in real-time, while the markets are open. You can monitor metrics like last sell price, price changes, trading volumes, and day/week price ranges. It’s especially convenient for investors who want to trade actively during market hours.
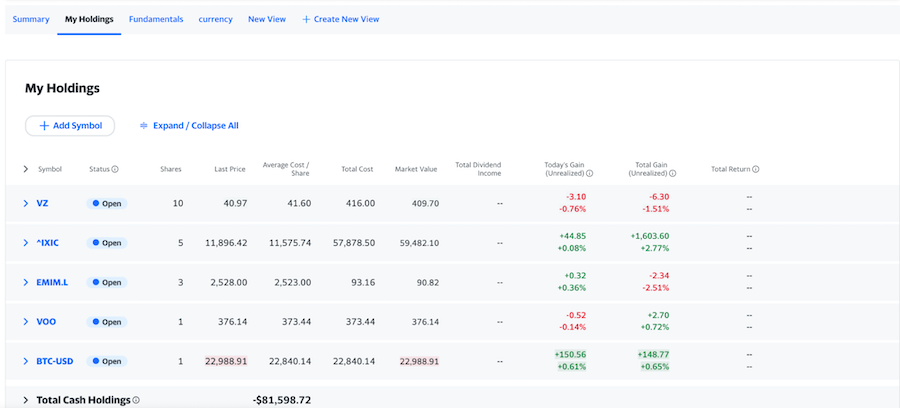
My Holdings tab provides extra per asset data. Here you can also record all buy/sell transactions.
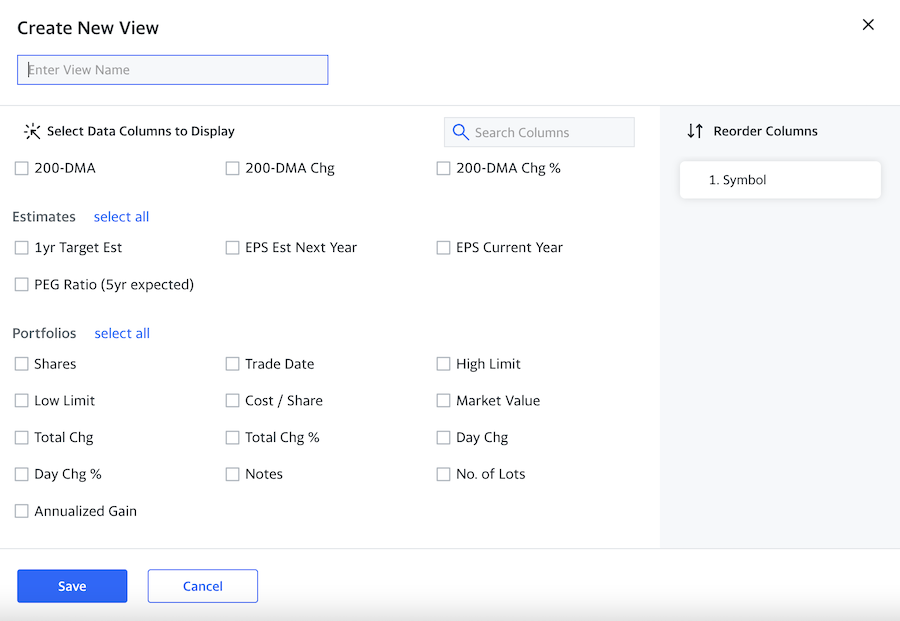
You can also create a custom portfolio view, based on the supported metrics. These include basics like currency, volume, day rate; technical data (e.g. market cap, Price/Book, forward annual dividend rate, etc); and portfolio items like daily change, annualized gains, trade dates, etc).
Most metrics are geared towards hedge fund administrators who need to know how the markets are hailing day or night. But passive investors may find Yahoo Finance dashboards overwhelming.
The definite advantage of Yahoo Finance is its global market data. The platform tracks all major stocks, ETFs, mutual funds, indices, futures, and crypto assets. That’s why it’s a go-to tool for leading financial institutions.
The downside, however, is how Yahoo Finance reports on portfolio performance.
You don’t get to see your current portfolio value. Instead, you can only monitor your daily gains and all-time gains (which don’t include information on dividends, brokerage fees, or foreign currency fluctuations).
Soundly, you have Navexa as an alternative portfolio tracker.
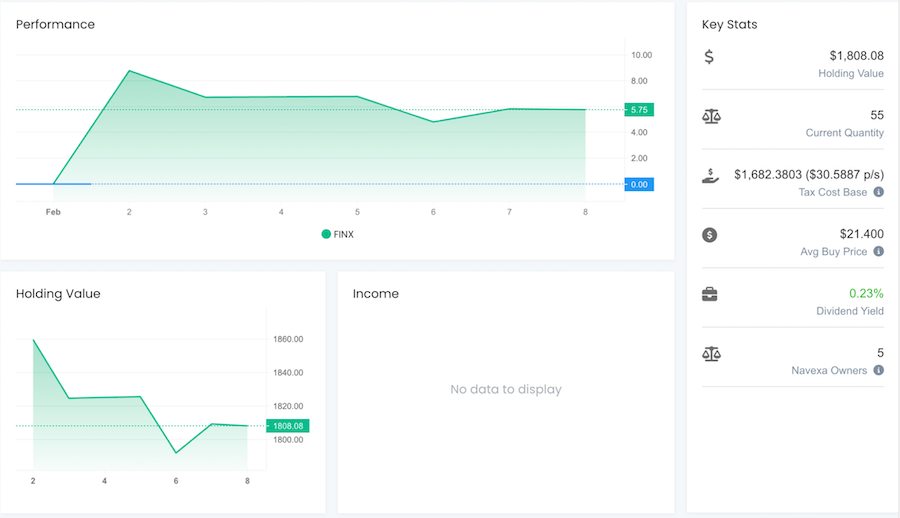
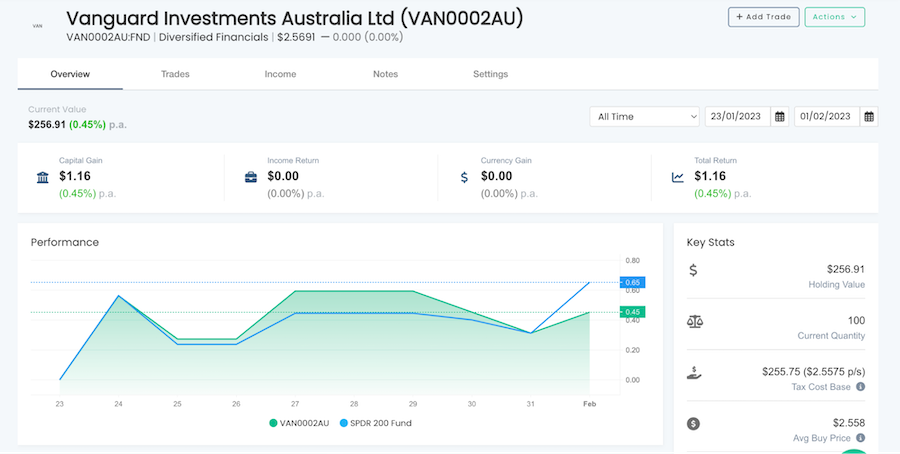
Our share portfolio management software supports just as many asset classes as Yahoo Finance but delivers more accessible portfolio performance reports. The main report provides a birds-eye view of key portfolio stats: Current value, capital gains, income returns, and currency gains.
You can also host multiple portfolios with Navexa and view them independently. Or create portfolio groups. This feature helps manage complex portfolios with different asset classes more efficiently.
Unlike Yahoo Finance, Navexa provides portfolio performance data for any custom range — last week, three months, one year, or between June 15 and June 18th. At any time, you can zoom back in time to understand how your assets performed then versus now.
Similar to Yahoo Finance, Navexa also provides a per asset summary view featuring sale dates, current prices, and total returns.
Portfolio Performance Reporting
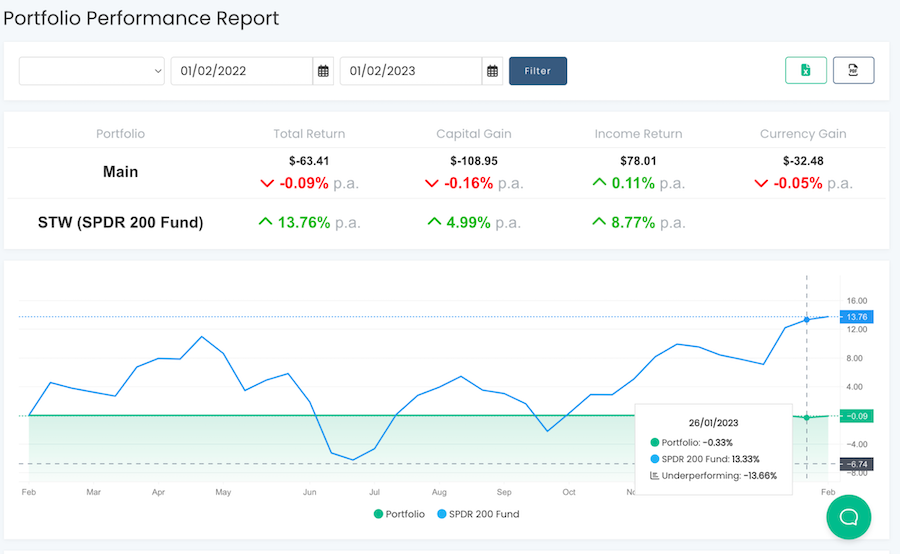
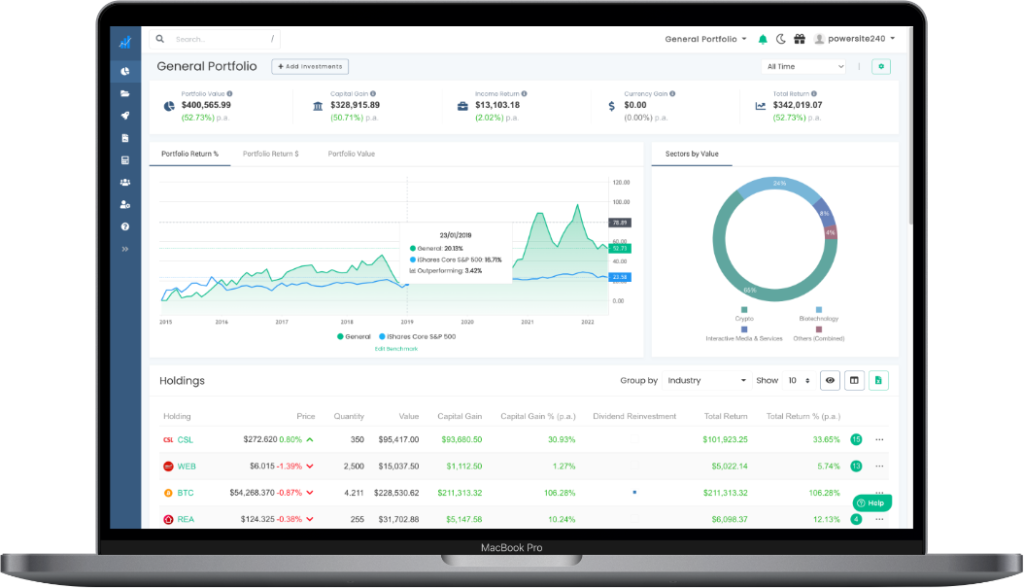
Navexa stock portfolio organizer presents all key metrics at glance: Total portfolio value, capital gains, income returns, currency gains, and total return. You can also monitor your portfolio growth trends in percentage or dollar-based equivalent.
To understand how you’re doing compared to the market, you can benchmark your investment portfolio against popular indices like SPDR 200 Fund, FTSE 100, or S&P 500.
Unlike Yahoo Finance, Navexa also reports on dividends (and factors them when calculating your portfolio returns). You get a heads-up on the upcoming dividends payouts, based on the data released by issuing companies. So that you could proactively manage your dividend income.
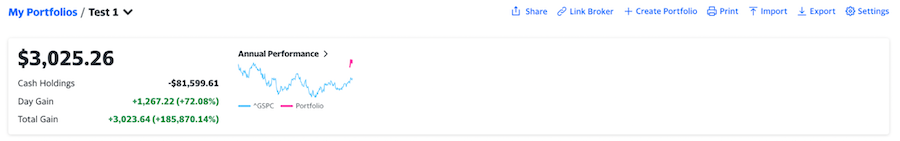
Compared to Navexa, Yahoo Finance’s reporting features are less robust. You get three key numbers: Cash holdings, Day Gain, and Total Gain. The tiny chart on the right also shows your annual portfolio performance against the S&P 500 index (^GSPC). But there’s no way to get a full-screen view of it.
You also get a day performance chart for each tracked asset (which can be enlarged). But…that’s all the portfolio performance reporting Yahoo Finance provides on a free plan. You can get access to extra technical charts with 100+ tracked metrics and the ability to overlay stocks on a Yahoo Finance Plus Plan only.
Stock Alerts
You can set up custom stock alerts with Yahoo Finance mobile app (Android & iOS). Alerts are useful if you want to quickly respond to price dips or increases. The setup process is easy and alerts arrive almost instantly.
Navexa doesn’t support real-time stock alerts yet. But we’re working on this feature!
Brokerage Account Integration
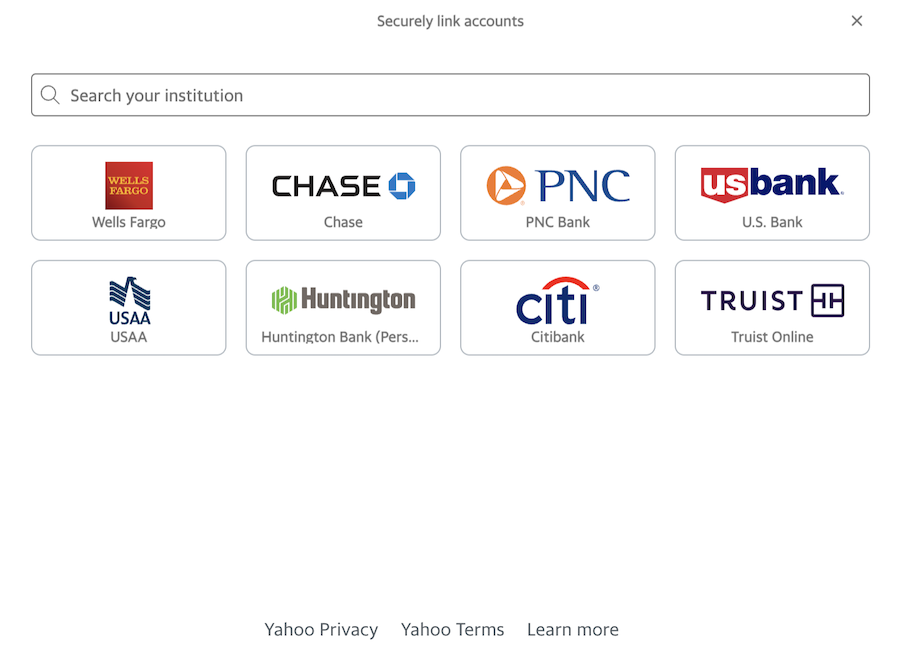
Yahoo Finance integrates with online brokerage accounts from US banks and several popular online trading platforms like eToro and Interactive Brokers.
But international and global investors would be more disappointed as their financial institution is likely not supported. No popular Australian brokers integrate with Yahoo Finance.
With Navexa you can auto-import data on historical trades from 10 brokers (CommSec, CMC Markets, ANZ Share Investing, etc). You can also auto-sync trading data from 14 brokers. Alternatively, you can upload a custom spreadsheet to add all your investments to a Navexa account. Yahoo Finance also allows data imports as CSV files.
Both portfolio trading wizards also allow manual data entries. Also, you can link up a cash account.
Tax Reporting
Yahoo Finance offers no help with tax reporting. You can export your portfolio dashboard as a CSV file and calculate capital gains yourself. Or share the numbers with your accountant.
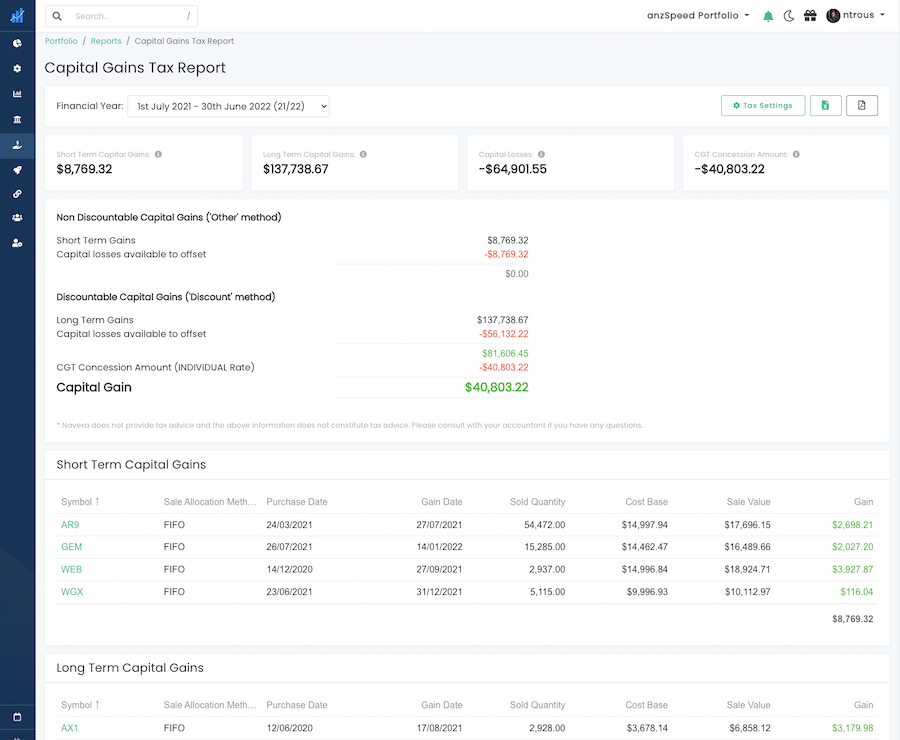
Navexa gets Australian investors all set for tax time. You can generate capital gains tax reports (CGRT) at any time or get a tax estimate on your portfolio’s income in a given financial year. To optimize your end-of-year bill, you can also model different tax scenarios using strategies like FIFO, LIFO, maximize/minimize gain, etc.
Our tax reports factor in trust income, franked distributions and foreign-sourced income (e.g. dividend payouts from a US company). In just a few clicks, you get a full breakdown of your tax obligations per each held asset. By modelling your numbers in advance, you can better divvy up your sales to avoid getting pressed with a humongous bill.
Overall User Experience
Yahoo Finance stock portfolio tracker errs on the side of simplicity. You have a no-frills spreadsheet-like dashboard, a couple of simple graphs, and custom indicators for creating technical reports.
Navexa offers a more comprehensive portfolio management system with extra reporting dimensions and financial calculations. Our reports factor in currency fluctuations, dividend payouts, and all incurred trading fees. Yahoo Finance allows listing brokerage fees manually but doesn’t account for currency volatility.
Manually reporting stock transactions is also easier with Navexa. The app auto-suggests the closing price of the share for the selected date, so you don’t have to look that up and suggests the current USD to AUD exchange rate. Yahoo Finance selectively suggests closing prices for some assets (e.g. it pitched a BTC rate, but didn’t suggest anything for a VOO trade).
Overall, Yahoo Finance portfolio tracker appears more cluttered. You see (not always relevant) news headlines and ads plastered everywhere. Sure, it’s a free portfolio management tool, but Yahoo could have toned down the message madness just a bit.
Navexa has clean, intuitive interfaces. All the essential data is presented upfront. Whether you’re on desktop or mobile, all charts are viewable and you can easily navigate between different report types.
Data and Analytics
Yahoo Finance offers real-time access to fundamental market data, which makes it a great tool for researching stocks and assets for alternative investment portfolios. All data is updated in real-time.
But Yahoo Finance has a lot of indicators passive or casual investors mostly don’t need. It’s more trader-focused and can feel overwhelming for some users.
Navexa’s focus is on portfolio performance analysis. Our portfolio tracker shows you how much money you’re making from individual assets and from your portfolio in total. Beginners and large portfolio Australian investors find Navexa analytics equally useful because of our investment performance insights.
Portfolio Performance Analysis
A free Yahoo Finance account doesn’t offer many details on client investments. You only get numbers on day gain/loss and total gain/loss over the account lifespan.
If you upgrade to Yahoo Finance Plus, then you get extra tools for figuring out the optimal asset allocation in your financial portfolio. For example, you can benchmark all your investments against popular indices. Navexa also supports benchmarking on a Basic account plan, which is 2.5X times cheaper than Yahoo’s.
A paid Yahoo Finance plan also gives you a new risk analysis dashboard, showing a percentage-based volatility score for holdings. Also, you get a valuation dashboard, suggesting which of your assets may be over- or undervalued. If you want to further optimize your risk radar, you can play with other risk analysis measures like Alpha, R-squared, Beta Trend, Correlation, and Sharpe Ratio. All of these reports help create a less risky investment management strategy.
Finally, a paid account also unlocks extra investment research, including personalized investment recommendations. Yahoo’s asset management technology will send you new stock ideas, based on held assets, fundamental, and technical analysis.
Navexa supplies you with more portfolio and tax reports than Yahoo Finance Plus does. As mentioned earlier, our general portfolio performance analytics is based on the Modified Dietz Method: ROR = (EMV-BMV-C) / (BMV + W*C)
ROR – for rate of return.
EMV – ending market value.
BMV – beginning market value.
W – weight of each cash flow.
C – cash flow.
Our portfolio tracker also annualizes all the calculated returns to give you a more accurate picture of your asset performance.
The above methodology also powers other competitive analytics features:
Portfolio diversification report shows how many holdings you have within one industry. This comes in handy for risk minimisation when you select target allocation.
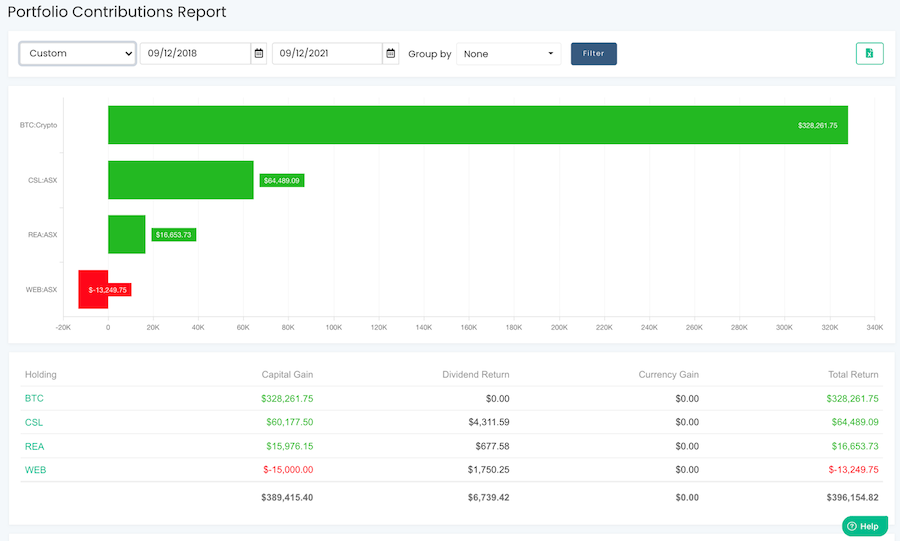
Portfolio contributions report highlights underperforming assets in your portfolio within a selected date range. This way you can avoid sinking money into low-performing assets.
Finally, we also keep tabs on all your dividends. These are pulled automatically from a connected brokerage account. Or you can create manual entries for each holding. Our app auto-calculates the total income return for dividend payouts and keeps you posted on the average dividend yield and upcoming dividend payouts.
Real-Time Stock Analytics
The definite advantage of Yahoo is its daily asset performance graphs. You can access market data in real-time and track price fluctuations all throughout the trading day. Prices are updated based on a mix of real-time/15/20/30 mins schedules.
Separately, global investors can zoom in on each asset to get fresh data on trade volumes,
daily/weekly range, historical performance, and all included holdings (for EFTs/mutual funds).
Navexa doesn’t provide real-time data on stock trades. We pitch list average buy price for all assets and suggest current or closing prices when you list trades manually. The market data you see in Navexa comes with a standard 20-minute delay from the exchanges.
That said, we provide another type of reporting: Analytics on performance. You can track capital gain, currency gain, income, and dividends for each holding in your portfolio in real time.
Historical Stock Data
Yahoo Finance lets you look up to 5 years backward on asset performance. You can track performance across custom ranges too. That’s handy when you’re researching new assets for your portfolio.
Navexa only provides backward data on your portfolio performance, but not the markets at large.
Pricing and Support
Yahoo Finance is one of the free investor tools. But the tracker has tons of ads and lacks essential portfolio monitoring features. If you want the extras, Yahoo offers Finance Plus (+), priced at $20.83 per month.
Premium accounts include 24/7 support via email and live chat on desktop. A free Yahoo Finance plan only includes email support, which is hard to access. So your best helper is an extensive FAQ section.
Navexa portfolio management software has a free tier, which allows you to have 1 portfolio with up to 10 holdings. Paid plans start at US $8 per month for tracking one portfolio and US $15/mo for up to three portfolios.
Our free and Basic plan includes access to a self-help portal and a community forum. Standard and Premium plans include fast email support.
Yahoo Finance vs Navexa: Full Comparison Table
Navexa
Yahoo Finance
Desktop version
✔️
✔️
Mobile app
✔️
✔️
All major stocks, EFTs, mutual funds tracked
✔️
✔️
Cryptocurrency tracking
✔️
✔️
Integration with broker accounts
All popular Australian platforms
Mostly US brokerage platforms
Investment portfolio reporting
Comprehensive
Total portfolio value, capital gains, income returns, currency gains, and total return (which factor in currency gains, dividends, trading fees, and annualization)
Basic
Total cash holdings, day gain, and total gain (which excludes currency fluctuations and dividends).
Portfolio benchmarking
Customizable
Select any popular index as your benchmark.
Limited
S&P 500 is set as a default option for free accounts.
Lot trades
✔️
✔️
Dividend reports
✔️
❌
Tax reports
✔️
For Aussie investors: CGTR, taxable income, Unrealised capital gains.
❌
Stock alerts
❌
✔️
In-depth portfolio performance analytics over time
✔️
❌
At-risk / underperforming assets analysis
✔️
✔️
On Premium Plans only
Portfolio diversification suggestions
✔️
❌
Upcoming dividend payouts
✔️
❌
Real-time market analytics
❌
✔️
Historical stock data
❌
✔️
Pricing
Freemium
Free for 10 holdings
Then starting from US $8/mo
Freemium
Free basic plan
Plus plan from US $20,83
TL: DRs
Yahoo Finance and Navexa both offer portfolio trackers. But each platform has a different focus.
Yahoo Finance offers ample real-time data for investment research and technical analysis, with tracking added as an afterthought. Navexa focuses primarily on portfolio analysis aka showing you real-time data on your portfolio value, capital gains, and income returns. Unlike Yahoo Finance, we provide daily and historical portfolio tracking data for your entire portfolio and individual assets. Plus, hook you up with tools to generate tax reports.
Overall, Yahoo Finance is best suited for active traders, rather than passive investors or people new to wealth management. If technical analysis is your jam, you’ll love Yahoo Finance for ample, real-time data and custom market indicator overlays.
But if you’re more interested in progressively building out your wealth for the future (and profiting from some trades today), Navexa offers you better tools for portfolio evaluation, optimization, and growth. Open a free account with Navexa to sample all our features.
Dividend yield is what drives income investors to buy shares. It’s what companies pay their shareholders as both reward and incentive. We explain dividend yield and how to easily calculate it.
Dividend-paying stocks form part of many portfolios for a good reason; they pay investors to hold shares. Owning dividend stocks means investors need to be able to easily determine their dividend yield — and the impact this income has on their broader portfolio performance.
Dividend yields are important for investors. By analyzing dividend yields, they can gain insight into how profitable and generous to shareholders a company may be. Being able to accurately calculate dividend yields can help investors predict how much a particular investment might pay annually.
Receiving dividend yield from companies can help portfolios grow and balance the risks of a volatile share market.
However, calculating dividend yield might seem tricky. Luckily, we’re here to help you figure out how to calculate dividend yield. Keep reading to learn more about the value of dividends, how share price affects the yields, and what to look out for.
Dividend yield is simple to calculate, yet quite a complex metric when you dive into the details.
What Are Dividends?
Dividends are defined as the distribution of a company’s earnings to its shareholders. Once they invest in a company that pays out dividends, investors can earn money for holding that stock.
The board of directors usually decides whether the company pays dividends or not. Dividends can be paid in cash, or in additional shares.
What About Dividend Yields?
Yield is defined as the amount of money an investment generates over the period of time while an investor holds it. Yield is usually expressed as a percentage based on:
The invested amount
The current market value of the security
The face value of the security
Yields might be classified as known or anticipated, depending on the valuation of the security.
How and Why Do Dividends Generate Yield?
When a company decides to pay out dividends, it’s rewarding its investors for buying the company’s shares. By paying a dividend, it creats a yield for investors in the form of cash or additional shares. The company may also incentivize investors to keep holding the stock.
Dividends might also make the company attractive to other investors. When new investors buy into the stock, the stock price could rise.
Dividend income contributes to overall investment performance.
Dividend Yield Stocks to Consider
Some common dividend yield stocks traditionally include companies in the following industries:
Electricity, water, natural gas supply
Consumer staples
Telecommunications
Real estate
A well-established business may be more likely to pay dividends than a smaller company. Larger companies tend to have more income, and be more financially stable, so they can pay part of their income to investors.
Still, companies may decide to stop paying dividends in the future. There are a variety of reasons why dividends may decrease or stop altogether.
Are There Different Types of Dividends?
There are many types of dividends. For example:
Cash dividend
Bonus share
Property dividend
Scrip dividend
Liquidating dividend
A cash dividend is paid in cash per share terms. It’s the most common type of dividend paid to investors.
Bonus shares are additional shares awarded to investors.
A property dividend is a payment in the form of an asset.
A scrip dividend is a promise that an investor will be paid later.
Finally, liquidating dividends are paid when the company shuts down, and represent the return of the original investment to the shareholders.
Dividends can come in many different forms.
Other Dividend Types
There are other dividend forms you might see when exploring how to generate dividend yield. For example:
Ordinary dividend
Qualified dividend
The main difference between ordinary and qualified dividend is the tax investors have to pay. Ordinary dividends are generally taxable as income. Qualified dividends may be taxed at lower capital gains rates.
Different Types of Dividend Yield
A high dividend yield isn’t always the best single reason for investing, especially long-term. When companies pay high dividend yields, it can sometimes be unsustainable.
A good dividend yield is generally considered to be between 2% and 4%. This range is considered safe and strong. On the other hand, a dividend yield above 4% may appear like an attractive opportunity — but it may carry more risk.
Low dividend yield may be a sign of poor company health. Generally, income investors want to avoid low dividend yield stocks.
They should, however, consider other stock attributes besides the dividend yield alone. For example:
Stock price
Earnings per share
Price to earnings ratio
Frequency of dividend yield
How Often Is Dividend Yield Paid to Investors?
Dividends are usually paid out quarterly or annually. Shareholders know ahead of time exactly when to expect their payment. Some dividend payouts can be paid monthly, but those tend to be rare.
Advantages of Dividend Yield
There are several advantages of dividend yield for shareholders, including higher ROI (than simply profiting through capital appreciation alone).
High Return on Investment
Dividends can grow steadily over time — larger companies, especially, may increase their dividend payout annually. For example, some companies have increased their dividend payout for 25 years. This generates a higher compound annual growth rate, which benefits long-term shareholders.
Of course, stocks’ values rise and fall. One stock our founder held, for example, went nowhere for many years. This is where dividend yield can be so vital to investment performance. In his case, he nearly earned back in dividend yield what he bought his shares for, despite the lack of capital appreciation.
High dividend yields can prove attractive for those seeking income as a priority.
Dividend Yield Is Useful for Equity Evaluation
Dividend yield can be a good signal of how stable a business is. Investors may see high dividend yield as a sign of strong earnings.
Disadvantages of Dividend Yield
One of the main disadvantages of annual dividends for individuals is that they are observed as taxable earnings.
For companies, the pressure to pay or maintain a high dividend yield may put pressure on the business’s finances, or even inhibit reinvestment and growth.
Does a Stock Price Affect Dividend Yields?
There’s a direct correlation between dividend yield and stock price. Dividends can change as a company’s stock price changes. Plus, companies can change the size of the dividend yield, regardless of stock price.
A company that’s committed to paying dividends will generally be expected to increase the payout if its stock price rises. This both benefits the investors and can make the company more appealing to potential investors.
How to Calculate Dividend Yield
Dividend yield = annual dividends divided by current share price.
Calculating dividend yield is not that difficult. All you need to do is use the dividend yield formula. Divide the annual dividend by the current share price and you’ll get the dividend yield.
Keep in mind that dividend yield is not calculated by using quarterly, semi-annual, or monthly payments.
If you get stuck, find the company’s annual report which lists the annual dividend per share.
Calculating Dividend Yield From Quarterly/Monthly Dividends
If you find a company that pays dividends quarterly, you’ll have to convert the quarterly payments into annual payments to calculate the dividend yield. Meaning, you’ll have to multiply the most recent dividend by four to get the annual dividend.
If your dividend yield is inconsistent, you’ll have to add the last four quarterly dividend yields to get the annual dividend yield. Then you can use the yearly dividend yield formula.
The same goes for calculating monthly dividends — you’ll have to find the annual dividend per share to be able to calculate your dividend yield.
Of course, you don’t need to worry about calculating your dividend yield manually. When you use Navexa to track your portfolio, the platform automatically records your dividend payments and calculates their impact on your portfolio performance.
The Importance of Dividend Payout Ratio
Besides the annual dividend payment, you’ll also want to take a look at the dividend payout ratio. It’s defined as the total amount of dividends that’s paid to shareholders, relative to the net income of the company.
Payout ratio = dividends paid/net income.
You can also calculate it based on the retention ratio, which is equal to earnings per share divided by dividends per share.
This number tells you more about the company’s maturity and whether it can continue to pay out dividends. For example, a company might reinvest all its earnings, which results in a 0% payout ratio.
On the other hand, the payout ratio would be 100% for organizations that pay all of their income as dividends each year.
Potential Dangers of High Dividend Yield
Here are some things to consider about high dividend yields.
A yield trap is a stock offering a high yield despite problems with the underlying business.
The Yield Trap
Just because a stock’s dividend yield is high, that doesn’t guarantee the business is stable or growing. A yield trap, or dividend trap, is when investors fail to do their due diligence and invest purely for an attractive dividend yield.
In an extreme scenario, an investor might buy shares of a stock based on its attractive dividend yield, only to find the value of their investment plummeting, negating any gain they might have hoped to realize from the dividend income.
This is why it’s always important to look at both long-term performance for any potential investment, and to research the company’s underlying financials, rather than just skim headline numbers like dividend yield.
Track Your Dividend Yield Automatically
Understanding how dividends work, and how they’re tied to share price is just a small piece of the investing puzzle. By understanding dividends, you’ll understand part of what to look for when you dig deeper into a company’s financials.
It’s generally best to analyze the whole company, the current market conditions, the stock’s value and long-term performance, and many other factors. Plus, in some cases, you can earn dividends you can reinvest for greater compounding returns over the long term.
The Navexa portfolio tracker — free to try for 14 days
The Navexa portfolio tracker tracks every trade and transaction for your portfolio. It automatically records and calculates an investments dividend or staking income, and shows the total yield at both the individual holding and portfolio level.
It’s simple and free to start using. Once you join Navexa, you can add your portfolio in minutes and begin tracking your performance.
In this post, we profile 16 of the best investing, personal finance blogs and podcasts (and YouTube channels) you’ll find on the web in 2022. Whether you’re new to personal finance and investing, or you’re looking for advanced economic analysis and trading content, these podcasts, blogs and channels will build your knowledge and financial literacy.
There’s never been more content about investing, personal finance, money management and financial independence than there is today.
As you’re reading this, thousands of content creators and journalists around the world are producing and publishing content aimed at helping you better understand personal finance, the markets and the deeper economic forces that drive them.
I’ve been in the financial research and publishing world for more than a decade. I’ve read, watched and listened to a lot of posts, videos and podcast episodes on investing, trading, personal finance and financial independence.
There are plenty of fantastic finance podcasts and blogs out there for those learning about everything from how to get started investing, or saving money, through to more advanced areas like options trading, portfolio management and macroeconomic theory.
But, as with most topics in this content-saturated era we’re living in, there’s also a lot of junk — clickbait content that promises fascination but turns out to not really say much at all.
That’s why I’ve put this post together. The 16 podcasts, blogs and channels I profile here are, in my and the Navexa team’s experience, some of the best investing and personal finance blogs and podcasts out there today. From deep economic analysis to business news, interviews with the world’s wealthiest investors and model portfolios designed to uncover once-in-a-lifetime investment ideas, these shows and websites span the spectrum of expertise.
Presented in no particular order.
#1: Chat With Traders — Pro Traders Share Their Stories
Professional trader Aaron Fifield launched the Chat With Traders podcast in 2015. Each podcast episode takes the form of a long conversation between the host and the guest — a billionaire fund manager, legendary options trader, a strategy specialist, or other industry expert.
These interviews are deep explorations that dive into what drives and motivates pro traders, what they’ve learned in their journey, and how they apply their knowledge to making money.
The CWT podcast is definitely not for beginners. While some of the ideas and principles you’ll learn in these episodes are universal and useful to investors of every level, you probably want to have a high degree of prior knowledge of trading (as opposed to investing) to get the most out of it.
I recommend podcast episode 214 with professional trader, James King, who shares four principles that drive elite performance.
Chat With Traders has some great free resources available.
#2 Equity Mates — An Aussie Investing Podcast Ecosystem
You can’t find an investing or finance podcast in Australia without stumbling upon Equity Mates. Founded in 2017, university mates Alec and Bryce created Equity Mates as a means to share their journey into investing and wealth building. They felt that ‘financial markets were seen as complex and inaccessible and financial media catered to the industry but not everyday Australians’.
The content you’ll find on the Equity Mates podcast and blog today is very much the opposite of industry-centric. Now spanning nine podcasts, online courses and even the FinFest live event, Equity Mates has expanded to cover a huge range of personal finance and investing content.
From the original Equity Mates Investing Podcast to Crypto Curious, Get Started Investing and more, there’s pretty much something for investors of almost every level to learn here. Thanks to their rise to prominence in Australia’s investing podcast world, Equity Mates now pulls some high-profile guests on its shows, too.
Check out this podcast episode, in which the Head of Research & Portfolio Management at InvestSmart, Nathan Bell, shares his 2, 4, 6 rule of portfolio construction.
EquityMates offers an ecosystem of podcasts, blog content & investing resources.
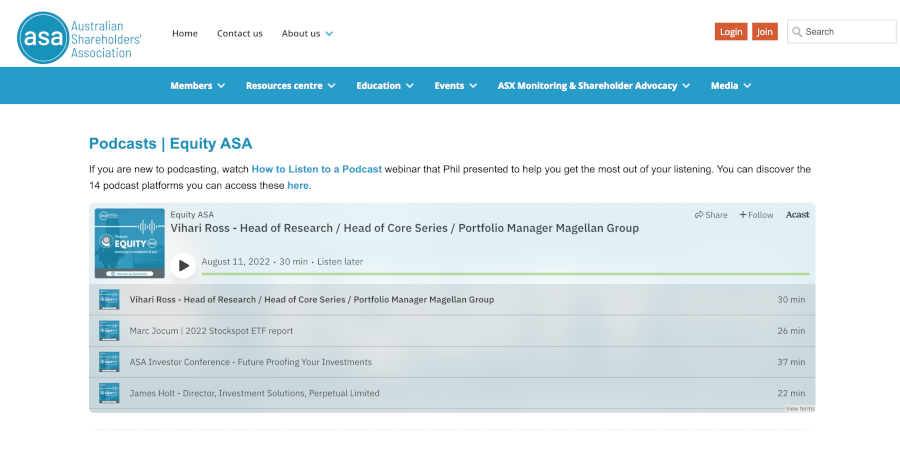
#3 Equity ASA: Short & Sharp Podcast Episodes For Australian Investors
The Australian Shareholders Association has been around since 1960. It’s a membership-based association that represents retail shareholders. The ASA ‘safeguards shareholder interests in Australian equity capital markets, helps its members to improve investment knowledge and fosters a connected retail investor community’.
Navexa has worked with the ASA several times, presenting webinars on portfolio performance tracking and delivering a live presentation on financial democratization at the 2022 ASA conference in Melbourne.
A more recent part of the ASA’s offering is its podcast series presented by the brilliant Phil Muscatello. Phil has his own podcasts, which I’ll get to shortly, but he still finds the time to front the ASA’s Equity Podcast.
The podcast takes the form of brief, varied interviews with guests ranging from portfolio managers and financial research houses to algorithmic traders and precious metals experts.
Each podcast episode seeks to inform the listener about a different aspect of the financial industry, and grant access to some of the most influential and experienced people on behalf of ASA members.
Equity ASA is the Australian Shareholders’ Association’s official podcast.
#4: Shares For Beginners — The Jargon-Free Investing Podcast
Our podcast episode discusses the pros and cons of the modern, app-first investment world and, of course, goes into the reasons why we’ve developed a portfolio tracking platform that allows investors to track all their investment performance in a single account.
But more broadly, the Shares For Beginners podcast is what is says it is — a great place to get into the ideas and concepts around investing without a huge amount of prior knowledge.
Phil’s effortless, casual podcast presentation and interview style does away with jargon and industry-speak in favour of easy-to-digest conversations with guests from fintech startups (us) to hedge fund managers, private investors, psychologists, even the editor-in-chief of Investopedia.
The episodes and topics are wide ranging, and you can be sure to learn something from pretty much any of the short, sharp episodes you dive into.
#5: QAV Podcast — Dedicated Value Investing Content
While I’m on the subject of finance podcasts we’ve appeared on, I should mention the small, but growing (and loved by its audience) Quality At Value Podcast.
Started by investors and friends Cameron Reilly and Tony Kynaston, QAV is a podcast, blog and membership club for value investors. The episodes and content centre on Tony’s impressive history as a long-term value investor.
Tony has achieved an annualized return of around 19.5% for the 30 years he’s been investing in the markets. That’s a seriously strong performance.
In the QAV podcast episodes and content, Tony and Cameron dive into all thing value investing. Specifically, they share Tony’s wealth of experience and the specific rules he’s created to spot winning stocks over his impressive 30-year run in the markets.
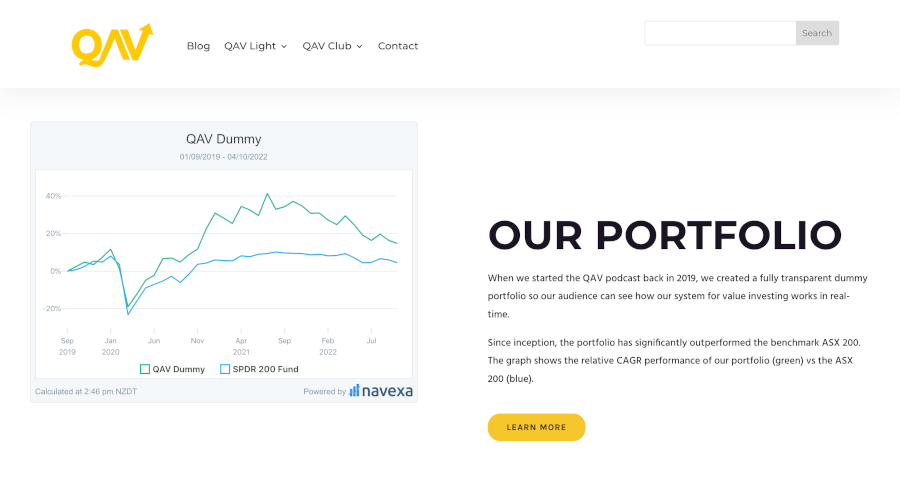
Navexa provides the QAV team with performance tracking for their model portfolio — which at the time of writing is outperforming the SPDR 200 benchmark by more than 10%.
The QAV podcast features Tony Kynaston, who has made a 19.5% annualized return over a 30-year value investing career.
#6: New Money — Top Quality Investing YouTube Channel
You shouldn’t, in my opinion, restrict your personal finance and financial education content consumption purely to podcasts. In the past few years, YouTube has produced a new generation of content creators spanning personal finance, investing, financial freedom, financial independence and so on.
Search ‘invest like the best’ or ‘financial freedom’ on YouTube and you’ll find hundreds of videos on everything from opening a crypto exchange account, to real estate investing, personal finance and beyond.
Of course, not all of it is great personal finance content. There’s no shortage of clickbait videos by blinged-out teenagers promising to reveal the secret to owning three Teslas before you have a driver’s license.
But dig a little deeper, and you will find some truly top-notch channels, like New Money, an investing and markets-focused show led by Australian Brandon Van Der Kolk. Brandon’s videos are about 10-20 minutes long.
They focus on topics like what stocks Warren Buffet and Berkshire Hathaway are buying and selling, how to understand key economic indicators and predictions, and — my personal favourite — deep dives into Dr. Michael Burry’s enigmatic tweets.
There’s a lot to learn here. The content is entertaining, easy to understand, and useful for investors whether they’re new to the markets or already years into their investing journey.
#7: We Study Billionaires — Wealth Hacking The World’s Best
So far I’ve kept the list local to Australia. But of course, you can’t dive into the world of investing — or investing and personal finance podcasts — without looking to the biggest market in the world, the US.
We Study Billionaires is a podcast on The Investor’s Podcast Network. Hosted by Danish investor, author and former professor Stig Brodersen and veteran CEO Trey Lockerbie, this show does what it says in the title.
The duo study, discuss and interview some of the wealthiest and most influential investors and businesspeople on the planet to learn the key factors and lessons in their success.
We Study Billionaires podcast features Warren Buffett, Howard Marks, Bill Gates and plenty of other high-calibre guests. There’s fresh episodes every week, plus the brilliant starter packs you can use to get up to speed on key topics fast.
We Study Billionaires is a podcast that seeks to unlock key strategic lessons from the world’s most successful investors.
While you’re looking at US-based podcasts, you’ll likely find financial research publisher The Motley Fool’s show, Motley Fool Money. These short and sweet daily episodes don’t necessarily follow a strict theme, like We Study Billionaires or QAV.
Host Chris Hill and a revolving cast of the firm’s analysts cover daily business and market headlines and break down implications for stocks and investors.
On the weekends, they run investing class-style episodes that teach financial and investing literacy from ‘special guests helping to shape the future’.
One notable feature of Motley Fool Money is the show’s episode notes, which break down key talking points with timestamps, and list the ticker symbols of any stocks discussed in that episode. Great for browsing and finding episodes on companies you hold or want to know more about!
#9: WSJ Your Money Briefing — Financial Literacy With Wall Street’s Leading Journalists
While we’re talking big American personal finance podcast players, I should mention the Wall Street Journal‘s Your Money Briefing. Billed as a ‘personal finance and career checklist’, Your Money Briefing is another show that seeks to interpret mainstream financial and economic news and translate that into actionable personal finance ideas for the listener.
Whether it’s spending and saving habits, predictions on energy prices or trends in the corporate workforce, the show is broader than just stock market commentary.
The Wall Street Journal is one of the premier business publications on the planet, and their reporters and analysts are among the best in the business.
One interesting piece of trivia about Your Money Briefing is that the host, J.R. Whalen, was in a past role responsible for assigning dollar values to each question on the show Who Wants To Be A Millionaire. If that’s not a sign that this show’s host understands the value of information, I don’t know what is.
Your Money Briefing runs daily Monday to Friday, and joins nine other high quality podcasts in the WSJ stable — one of which I cover below.
The WSJ runs the Your Money Briefing podcast.
#10: WSJ The Future Of Everything — Covering Big, World-Shaping Trends
The WSJ’s future focused podcast aims to answer a big question — what will the future look like? By projecting the trends we’re seeing in the world today into the decades ahead, The Future Of Everything brings a unique macro view to any investor’s podcast library.
You can expect plenty of science and tech — obviously — and you’ll find a nice balance between both challenges facing civilization and the breakthroughs that could overcome them.
Episodes tackle big topics like how best to decide which species to save and whether genetically modified crops are the future of food.
Hosted by Danny Lewis and Alex Ossola, The Future Of Everything comes out about every fortnight. Each episode runs for around 20 minutes.
#11: Money For The Rest Of Us — Former Pro Investor Helps Everyday People Build Wealth
Former financial advisor and money management expert Bret Stein quit his professional investing career after 20 years and started the Money For The Rest Of Us Podcast.
The big idea is that Bret now shows listeners how to apply the principles and investment philosophies he developed at $15 billion asset management firm FED Investment Advisors in their retail investing and personal finance journeys.
Money For The Rest Of Us is less about financial news and economic coverage than is is about how those things impact personal finance, investment strategy and retirement planning for everyday investors.
According to Bret, ‘Money For the Rest of Us is for people like you and me who aren’t relying on someone else to make sure we have enough to retire. We’ve taken control of our financial future’.
With close to 20 million downloads, this personal finance podcast is among the most popular of its kind. And it goes beyond just the weekly personal finance podcast episodes, which run for around 30 minutes.
Money For The Rest Of Us also offers free reports, an email newsletter, a members-only education platform (which teaches students to manage their personal finance like a professional) and Bret’s book, Money for the Rest of Us – 10 Questions to Master Successful Investing.
Money For The Rest Of Us is one of the most popular personal finance and investing podcasts.
#12: Contrarian Edge — Great Content On Investing & Life
Vitaliy Katsenelson is a deep thinker whose curiosity about the world of finance extends beyond just the markets and investing. A professional investor, educator and writer, Vitaly’s Contrarian Edge blog is packed with deeply researched and brilliantly-written content.
The prolific Vitaliy shares opinions and analysis on a wide range of subjects related to investing. From macroeconomic and geopolitical coverage through to single stock analysis, personal finance and more philosophical pieces on the qualities and principles one need cultivate for a fulfilling investment journey, Contrarian Edge is as informative as it is entertaining.
Vitaly has published two books to date, Active Value Investing and The Little Book of Sideways Markets, with a third title on the way at the time of writing.
While Contrarian Edge is a blog, you’ll also find podcast episodes on the site — a mix between Vitaliy’s guest appearances on podcasts and audio versions of his blog posts.
#13: Value Investing with Sven Carlin, Ph.D. — The Dedicated Value Investing YouTube Channel
You won’t find many people with a doctorate in investing. But Dr, Sven Carlin is one such man. Having developed a Real Value Risk Model for emerging market stocks during his studies, Sven has worked for Bloomberg in London and taught finance and account at The Amsterdam School of International Business.
Today, he runs the 200k-plus subscriber YouTube channel, Value Investing with Sven Carlin, Ph.D. The channel is packed with video content on everything from individual stock analysis and commentary, commodities, tips for beginner investors, investing book reviews, and Sven’s YouTube model portfolio, which he launched in 2022.
The model portfolio is an interesting differentiator here. Not many other YouTube investing content creators go beyond the tried and true (and, once you’ve watched a few of them, tedious) ‘how to open a brokerage account’ and ‘3 most popular ETFs’ formats.
Sven’s plan with his YouTube portfolio is to build a $1 million paper portfolio and run it for several decades, with regular videos explaining trades, trends, and the reasoning behind investing decisions.
Sven’s inspiration for his YouTube portfolio is one of the all-time value investing greats.
Munger’s 50-Year Journey To Find a Single Worthwhile Investing Idea
Berkshire Hathaway’s Charlie Munger is infamous for his contributions to the firm’s world-beating investment performance.
One of his stories illustrates how discerning the man is with investment ideas. Barron’s, a sister publication to the Wall Street Journal, has been around more than a century. Munger read the magazine for half a century before he found an investment idea in it that he thought worth following.
According to Munger: ‘In 50 years I found one investment opportunity in Barron’s out of which I made about $80 million with almost no risk. I took the $80 million and gave it to Li Lu who turned it into $400 or $500 million. So I have made $400 or $500 million reading Barron’s for 50 years and following one idea.’
This is what Sven Carlin is trying to emulate with his YouTube portfolio; a long-term investment idea generator which perhaps uncovers one big winner, and which teaches much along the way.
Charlie Munger claims to have made $500 million by reading Barron’s for 50 years.
#14: The Acquirer’s Podcast — Making Complex Financial Analysis Casual & Entertaining
Here’s another podcast that’s also a blog and, in this case, an investment fund. Tobias Carlisle is a professional investor, author, and lawyer. He runs The Acquirer’s Multiple, where he shares his wisdom from a career spent managing merger and acquisition transactions, and his own deep value investing.
Tobias has published four value investing books. Most recently, The Acquirer’s Multiple: How The Billionaire Contrarians of Deep Value Beat The Market was the #1 new business and finance book on Amazon. Over on his website, The Acquirer’s Multiple, you’ll find The Acquirer’s Podcast, along with the ‘absurdly simple, ridiculously powerful’ stock screener which is available on a subscription basis.
The podcast itself is super high quality. It leans more towards to expert end of the finance podcast spectrum. It’s long-format and doesn’t dumb anything down. The episodes I’ve listened to are packed with interesting information, but they don’t put you to sleep like some of the other expert-level shows you might stumble upon.
If you’ve seen The Big Short (which I list below, for reasons I’ll explain), you’ll have enjoyed that rare balance of dense finance topics with light, accessible explanation. Or, you will have become dizzy with all the Wall Street jargon, slam zooms and quick cuts.
I mention this, because tuning into The Acquirer’s Podcast feels sort of similar to watching this film. You’re in the room with veteran professional investors whose careers and lives have been shaped by the markets. They speak the language of Wall Street, but they let you in on what it means.
This recent episode features Tobias and his two regular guests discussing the complexities of defining a bear market. It’s a great example of the sort of content you’ll get from the podcast — market and economics analysis discussed by professional traders as though they’re enjoying a post-work debrief at a bar.
#15: The Big Short — The Feature-Length Adaptation Of The 2008 Subprime Crisis
I know. It’s not a personal finance podcast or YouTube channel. But hear me out. Because while there’s plenty of shows and channels out there for market and economics commentary and education, there are relatively few that take you behind the scenes of the upper echelons of the financial markets.
Adam McKay’s The Big Short is, in my opinion, a must-watch for anyone investing in the markets. Why? Because in just over two hours, the film explains the 2008 global credit crisis with both massive scope and detailed depth.
The cast of characters includes Christian Bale’s memorable performance as Dr. Michael Burry, the hedge fund manager who predicted and led the betting against the crash. It pulls together top-tier dramatic talent like Ryan Gosling, Steve Carrell and Jeremy Strong with celebrity cameos from Margot Robbie and the late Anthony Bourdain, all in service of explaining and illustrating the economic, market and cultural circumstances that set up the biggest crash (so far) of the 21st century.
The film goes deep into the psychology of the people who contributed to, predicted and profited from the ’08 subprime crash. More than any other film about the financial markets — which tend to get lost in portraying the luxury lives of the ultra-wealthy — The Big Short illustrates the disconnect between Wall Street and Main Street in early-2000s America.
To go even deeper into this fascinating episode of financial history, check out the Michael Lewis book, The Big Short: Inside The Doomsday Machine, on which McKay based his film.
The Big Short is perhaps the best investing film ever made.
#16: A Wealth Of Common Sense — Pro Institutional Investor Making the Complex Simple
While we’re looking at content that helps you navigate the complex world of finance and economics, I should mention A Wealth Of Common Sense. This blog, written by Ben Carlson (Director of Institutional Asset Management at Ritholz Wealth Management) is another example of a professional investor breaking down market news and analysis for everyday readers.
Huge institutions turn to Ben for investment advice and portfolio guidance. Having managed people’s money his whole career, he has broad and deep knowledge of the markets, money and financial advice. But his ethos on the blog — and the accompanying podcast, Animal Spirits — is to keep it simple.
According to Ben: ‘Both the economy and the financial markets are complex adaptive systems, but I’ve never found complex problems require complex solutions. Common sense and self-awareness are extremely underrated attributes in the world of finance.’
This post on surviving bear markets at different stages of life is a brilliant example of the quality and readability of Ben’s writing. And this episode of Animal Spirits shows you the type of in-depth analysis and commentary you’ll find on the show’s weekly, roughly hour-long episodes.
How To Make The Most Of Financial Independence & Personal Finance Podcasts
So there you have it. My 16 best personal finance and investing podcasts and blogs from across the web. From advanced, pro trader-level podcasts to more everyday content aimed at helping ‘normal’ people invest, save money and build their financial independence.
The shows and sites (and the feature film) I’ve featured here give, IMHO, a wide range of content that I hope result in you discovering at least one new resource on your own financial journey.
Of course, I have included two finance podcasts that we’ve appeared on ourselves here at Navexa. That’s because we’ve created a platform to help investors make the best possible financial decisions for their investment portfolio.
The Navexa Portfolio Tracker: Optimize Your Investment Journey
Whatever your financial goals, or which industry experts you might listen to for tips on money matters and financial topics, one thing we all need on our personal financial journey is a reliable tool for tracking our performance and returns.
As you’ll hear on our episode of the QAV Podcast with Cameron and Tony, our founder Navarre is a long-term, buy-and-hold investor to whom strong, annualized returns matter more than eye-grabbing one-off gains.
He’s been learning about investing for a long time. Everything he’s learned has proved it’s far better to work with hard data than skewed or incomplete information about a portfolio.
This is why the Navexa Portfolio Tracker, today, is one of the leading portfolio tracking platforms. It allows you to add portfolio data from stock brokers, crypto exchanges, cash accounts and even unlisted investments like property.
This means you can track all your investments in one place. Which, in turn, means you can look at your overall portfolio performance, measured together using the same industry-standard performance calculation.
Once you load your portfolio into Navexa, you can see true performance over the long term. You can see at a glance your capital gains, currency gains, investment income — all net of your trading fees.
You can run comprehensive tax reports with a couple of clicks. You can track & analyze more than 8,000 ASX & US-listed stocks and ETFs, plus cryptos, cash accounts and unlisted investments (like property).
And, you can go even deeper, running reports like Portfolio Contributions, which shows you in chart form which of your investments are boosting (and which are dragging down) your overall performance.
Invest In Knowledge While You Invest in The Markets
We’ve developed Navexa so that you can spend more time learning about the financial and economic forces driving the markets, the strategies that some of the world’s best investors use to outperform the rest of the market, and the investing and personal financial principles that underpin strong long-term investment strategies.
How? Because once you start tracking your portfolio performance in Navexa, you’ll no longer need to spend time manually tracking, calculating and reporting your investment performance — especially at tax time, when the government requires you provide accurate, comprehensive records of every trade and transaction you’ve made in a given financial year.
Not that podcasts or blogs were around in his time, but Benjamin Franklin famously (among many other things) said, ‘an investment in knowledge pays the best interest’. By which he meant that taking the time to learn about how money and the markets work can be more valuable than buying and selling investments themselves.
Between the 16 investing and personal finance podcasts and blogs I’ve detailed here, and the powerful portfolio performance tracking tool we provide here at Navexa, I hope you’re now better equipped to learn about investing and to build your financial literacy!
Different market sectors offer unique opportunities and risk for investors, as well as ways to diversify a portfolio. These are the 11 key market sectors, and the pros and cons of each.
The US stock market is packed with different types of companies, focused on a massive range of products and services. This market is broken down into 11 sectors. This creates a lot of different options for investors in terms of which sectors and industries they want to get exposure to by buying shares.
Each sector has its own advantages and disadvantages. We’ll introduce each and then examine the pros and cons.
Why Invest in Different Sectors?
Investing in different sectors allows for portfolio diversification and can be a key element of wealth management. A diversified portfolio, with a variety of stocks, dividends, and ETFs, offers exposure to different parts of the market. This, in turn, exposes the portfolio to both the potential risks and returns of each sector. The key idea of diversification is that the risks associated with one sector are balanced by the returns of the other.
If you own or plan to own a diversified portfolio, Navexa can help you track it. Our platform helps you map your financial goals and automates tax reporting. You can start using it today for free, and upload your holdings in minutes.
The US stock market is broken into 11 key sectors.
What Is the GICS System and Why Is It Important?
The Global Industry Classification Standard (GICS) divides the investment market into 11 sectors further comprising24 industry groups, 69 industries, and 158 sub-industries. This is a common system that investors use to learn how companies are classified, and what ETFs and mutual funds consist of.
The GICS was created in 1999 by MSCI and Standard & Poor’s. This classification system includes the following groups:
Sectors
Industry groups
Industries
Sub-industries
It’s occasionally revised, following the growth and developments of certain industries. For example, the latest addition was the real estate sector. This sector was included in 2016, due to the increasing growth and importance of real estate and equity REITs.
This change had a powerful effect on the real estate sector. For example, it drove more money to real estate companies. Additionally, large fund companies had to purchase more real estate stocks to offer them in index funds. Adding the real estate sector to the GICS opened doors for other changes and introduced investors to new options.
However, the GICS is not the only method of classifying industries and sectors. The Industry Classification Benchmark (ICB) is one alternative. The ICB schema was developed in 2005 by Dow Jones and FTSE. It divides the market into 11 industries and 20 supersectors, which are further divided into sectors/sub-sectors. The ICB standard is used in many international markets, including NASDAQ and NYSE.
Today, we’ll focus on the Global Industry Classification Standard and its 11 stock market sectors.
The GICS was created by Standard & Poor’s in 1999.
Key Information on the 11 Sectors Plus Pros and Cons
These 11 stock market sectors represent 11 groups of public companies that share similar business activities, products, services, or features.
1. Energy: Exposure to Different Stocks
The energy sector includes companies that focus on the exploration and production of energy products. However, with COVID-19, there has been a change in how energy resources are seen and utilized. The pandemic increased interest in renewable energy sources due to the energy pressures it exacerbated. Renewable energy infrastructure has shown potential to address some of those pressures. Still, investments in the clean energy sector are generally not as stable as investments in oil and gas.
Some of the top categories in this sector are:
Oil and natural gas stocks
Pipeline and refining stocks
Mining stocks
Renewable energy stocks
Companies in the energy sector aren’t limited to just one category. Instead, they’re often focused on several operations around one energy product.
Additionally, the energy sector is vast. It accounts for trillions of dollars annually, and will always be in demand. Companies that increase the prices of their services tend to have more money to set aside for dividend payments. This sector also offers a variety of investment opportunities, from ‘traditional’ like oil and gas, to solar and wind energy stocks.
However, there are certain risks involved in investing in this sector:
Can be a highly volatile market
Companies involved in this sector often need to make huge investments into research and development and might lose money
There’s a chance of regulatory risk regarding limitations on the production of some energy sources
New technology may reduce long-term demand
2. Materials: Performs Well When the Economy Grows
The materials sector refers to companies that take raw materials or natural resources and turn those into useful products. Companies that produce chemicals, paper, glass, metals, packaging, construction materials, and so on.
This sector usually does well when the economy is growing and there’s a high demand for certain products. However, many things affect this sector, such as:
The companies operating in these sectors are often related to aerospace, construction, transportation, waste management, and similar.
As with any other investment, recognizing the best company in the market is challenging. Investors often check whether the company has diversified operations, low operating costs, and solid credit ratings.
The industrial sector has a cyclical nature. Thus, it’s more suited for risk-tolerant investors. The sector is strong during economic growth. However, economic downturns directly reduce the demand for industrial goods and services, which may cause stock prices to drop.
The industrial sector includes construction, transportation and waste management.
4. Consumer Discretionary: Another Cyclical Sector
This sector deals with goods and services that aren’t considered essential for people. Usually, these include items and offers people can purchase if they have enough income. For example:
Cars
Durable goods
Leisure equipment
Household items
Media production
Apparel
Services like hotels and restaurants
This sector is the most sensitive to economic cycles. The companies that offer consumer discretionary products will grow quickly in a good economy, but slow down when the economy contracts.
Gross domestic product (GDP) is one metric to consider when investing in this sector. If GDP is on the rise, people are more likely to afford these items and services and the demand will increase.
5. Consumer Staples: Low Stock Decline During Bear Markets
In contrast to the consumer discretionary sector, the consumer staples sector includes companies involved in the production of foods, drinks, tobacco, and non-durable household items. The consumer staples sector tends to generate consistent revenue even during recession periods. Companies involved in the consumer staples sector may face lower stock declines during bear markets.
What’s more, it might happen that the demand for consumer staples increases during economic downturns. Those who invest in this sector usually benefit from dividend income, depending on their investment decisions.
The volatility in consumer staples is generally lower. This industry matures with modest growth.
The healthcare sector is one to watch right now, with record numbers of people reaching old age.
6. Healthcare: Essential for Aging Demographics
This sector includes companies that provide healthcare services and manufacture healthcare equipment and technology. These companies are present at all stages of pharmaceutical and biotech research, including development and production.
This is a highly interesting sector, with quickly growing companies and overall above-trend growth. Companies in the healthcare sector are often considered a hedge against market downturn.
These are the common healthcare stocks:
Drug stocks
Medical device stocks
Payer stocks (like insurers)
Healthcare provider stocks
There are several things to consider when looking into healthcare sector companies:
The company’s growth data
Growth strategies
Potential mergers and acquisitions
Financial statements
Valuation
Dividends
When it comes to risks, the primary issue is competition. A competitor discovering better products and services may drive another company down. The healthcare sector is also highly regulated, but any new regulation and/or FDA decision can drastically affect the company and its stock.
Additionally, drug companies are exposed to litigation risks.
Still, aging demographics and technological advancements should, generally speaking, positively affect the healthcare sector long-term.
7. Financials: Banking, Insurance, Finance
The financial sector includes companies involved in providing products and services around mortgages, banking, consumer finance, insurance and similar. This is one of the most important market sectors for the economy.
Types of financial sector stocks include:
Bank stocks
Insurance
Stocks from companies involved in other financial services
Mortgage REITs
Blockchain and cryptocurrencies
SPACs
The financial sector dictates how the economy functions, since it ensures the free flow of capital and liquidity in the marketplace. When the financial sector is strong, many other market sectors follow suit. Generally, this sector has shown robust growth and profitability. Still, it can be affected by changes in interest rates and other economic factors.
The financials sector includes banks, brokers and blockchain companies.
8. Information Technology: Offers Four Mega Sectors
The information technology sector involves companies that produce software and IT products and services. This includes the manufacturing of hardware, mobile phones, computers, and similar. Therefore, some experts divide this sector further, into four ‘mega sectors’:
Semiconductors
Software
Networking and internet
Hardware
The information technology sector is also widely used by many other industries. It’s one of the fastest growing stock market sectors in the last decade and contains some of the largest companies in the market (think Microsoft, Adobe, Oracle Corp, and so on).
Still, many new companies in this sector don’t produce cash flow right away. Competition is fierce in the space, and investors often use guesswork instead of calculated valuation to invest in a company.
9. Communication Services: New vs. Old
The communication services sector includes companies involved in everything from traditional media to the internet. This also includes entertainment-oriented companies, products like interactive games, communications services and so on.
The usual methods of analyzing communications stocks are:
Comparing companies that operate in the same industries
Comparing companies that are at similar stages of growth
Analyzing user base size and engagement trends
Paying attention to the company’s expenses
The communications sector offers growth opportunities for companies that focus on online services. On the other hand, companies that work with traditional communication services and products may face challenges as the industry evolves rapidly.
10. Utilities: Attractive Even in a Bad Economy
This is one of the stock market sectors that’s also essential for the economy. Companies in this sector provide electricity, gas, and water to commercial and retail users. Generally, this sector offers steady performance.
The utilities sector usually offers dividends to the company’s shareholders. Additionally, economic downturns can make utilities attractive for long-term investing. This sector generally has lower volatility.
On the other hand, the utilities sector is intensely regulated. Regulatory change can negatively impact these businesses. Organizations in this sector may also have to invest in expensive infrastructure to provide their services. This can place them in debt, which in turn can be sensitive to interest rate changes.
Real estate goes far beyond physical property, with REITs, development companies and other property-adjacent market opportunities.
11. Real Estate: Great for Portfolio Diversification
The real estate sector includes several indirect investment opportunities:
Companies that work in real estate services
Real estate developers
Equity REITs
Besides purchasing stocks from companies involved in this sector, investors also make money by renting and flipping properties (direct investing). This sector generally has steady growth. Depending on the type of investment, it can offer quick returns (flipping) or steady income (renting).
Investing in the real estate sector is a popular way to diversify one’s portfolio. This sector is not closely correlated to stocks, bonds, or commodities. Still, there are some limitations of directly investing in this sector:
Managing tenants
Potential property damage
Reduced income from vacancies
Requires deep market knowledge
When purchasing real estate stocks, investors should be careful about:
Management costs
REIT’s low growth
Interest rate changes
Possible market downturns
The 11 Stock Market Sectors and Ways to Invest
There are many different ways to invest in each of these market sectors. Some of the most common ones include ETFs, investment trusts, and index funds. Here’s how investors usually get in:
Energy sector: The easiest way to get into the energy sector is via mutual or index funds. There are many funds to choose from, and each is managed according to a strategy or energy index.
Materials, industrials, consumer discretionary, and consumer staples sectors: These sectors usually offers dividends, so buying individual stocks is one way to go. Some ETFs invest in companies in this sector as well.
Healthcare sector: Utilizing ETFs and healthcare mutual funds is the popular way to enter this market.
Financials, communication services sector and information technology and utilities: The most common way to get involved with these is through individual stocks.
The real estate sector: This market comes with several investment opportunities beyond property itself, such as REITs, real estate stocks (via a brokerage account or a tax-qualified retirement account), ETFs, index funds, and Real Estate Investment Groups (REIGs).
The Navexa portfolio tracker helps you track & analyze investments across every sector, asset class and multiple trading accounts.
These 11 Sectors Offer Unique Market Exposure And Diversification Opportunities
These market sectors are key to portfolio diversification. From products and services essential to everyday life, through to more speculative technology projects, diversifying across these sectors can expose a portfolio to a variety of potential risks and rewards..
For example, the materials sector, utilities sector, and services sector are key components of the economy, regardless of whether it’s growing fast or slow. Still, companies in these stock market sectors are often affected by market downturns, interest rates, and economic changes — some more than others.
However you invest or diversify, whether you’re into high-growth tech stocks, or slower, steadier opportunities like consumer staples and real estate, you must always track your trades, transactions and investment performance.
Why? Because it’s essential to both optimizing your investment journey through data-driven decision making, and meeting reporting requirements at tax time.
Navexa helps you do all of this in an easy-to-use, accurate portfolio tracker currently being used by thousands of investors around the world. With detailed performance analytics and reporting on diversification, portfolio contributions, income and more, Navexa gives investors actionable insights on their portfolio.
Foreign investment taxes can be complex. Generally, investors will pay capital gains tax or income tax, depending on the conditions. Here’s how to deal with Australian taxation on foreign investments.
Many Australians want to know how and where to invest in foreign stocks, property, bonds and other investments. This means they need to understand the tax implications of doing so. Australian taxation rules might seem complex when it comes to investing in foreign stocks.
The Australian government has signed many tax treaties. These provide benefits to Australian residents who invest in foreign stocks in countries that have tax treaties with Australia. Such treaties sometimes mean Australian residents may be exempt from paying tax. However, they may have to pay it in the foreign country.
If there’s no tax treaty, Australian residents may have to pay tax on every type of investment gain. Some might be eligible for a discount, depending on how long they have held the investment.
Generally speaking, foreign investments are taxable, be it in the source country or Australia. If you’re an investor, you’ll most likely pay capital gains tax or income tax. Keep reading to learn about Australian tax on foreign investments and how easy it is to track them using the Navexa portfolio tracker.
Overseas Investing From Australia
Australian residents are free to invest in foreign assets. They can own overseas property, offshore bank accounts, businesses, and stocks. Owning foreign investments requires that Australians comply with the latest rules and regulations regarding tax.
Australians can invest overseas, but need to understand their domestic and foreign tax obligations.
Interacting with the Australian Tax System
Every Australian resident is subject to tax on their income. This includes investment income such as dividends as well as capital gains from foreign investments. However, the Australian government has signed more than 40 tax treaties with other countries, including the US.
The US-Australia tax treaty gives Australian investors certain benefits. For example, there’s a reduced tax rate for US-sourced income (dividend payments) if certain conditions occur. Investors can also fill out specific forms that drop the rate of withheld tax from 30% to 15%. But, they may have to pay taxes in the US.
Australian investors might be able to claim US withholding tax from their dividends as a Foreign Income Tax Offset (FITO). FITO helps reduce taxes on foreign earnings.
But FITO rules are complex. It may be useful to seek professional guidance around this. Both the Inland Revenue Service (IRS) and US tax advisors can provide in-depth information for individual situations.
W-8BEN-E: A Key Form For Foreign Investors
The US government requires Australian investors fill out certain forms when investing in the country. A W-8BEN-E is a common form. It determines which investors are subject to paying 30% of their gross income earned in the US to the IRS. This form defines:
Interest
Royalties
Annuities
Rent
Premiums
Compensation for services
Substitute payments, if applicable
It’s required for all US holdings and remains valid for three years. If your information changes, you’ll be required to submit an update.
Australian residents for tax purposes have to declare all worldwide income.
Do Australian Residents Pay Tax on Gains and Income from Foreign Investments?
Australian residents for tax purposes have to declare the income they earn regardless of where that income came from. This is called the ‘worldwide income’ and it includes:
Pensions
Annuities
Business activities
Employment
Assets
Investments
Dividends from shares
Capital gains on overseas assets
Interest from bank deposits or bonds
Rental income from real estates
Royalties from intellectual property
If you have a temporary resident visa, you won’t pay tax on income. In case you receive income from a country that hasn’t signed a tax treaty with Australia, you’ll likely pay taxes in both countries. However, the tax you pay in a foreign country may make you eligible for FITO.
Australia also receives and exchanges information on all financial accounts with many foreign tax authorities.
How Is Foreign Investment Taxed?
Australian investors who have foreign assets and receive income from overseas will usually have to pay capital gains tax once they sell that asset. However, there could be other forms of taxes they are required to file (such as income from dividends). This is why it’s important to keep all the records on transactions, regardless of the country in which you invest.
Here’s where Navexa makes life easier. Our smart portfolio tracker lets you track foreign investments in both their local currency, and your tax residency’s currency, too.
This makes it super simple to monitor the performance of your foreign shares and keep records of all transactions for tax and compliance purposes.
The way dividends are taxed depends on the tax treaty between Australia and the source country.
Types of Investments and Their Taxation
Australian investors have access to several investment opportunities abroad. These are the most common ones.
Buying & Selling Stocks
Australians can own foreign stocks. Any individual who holds shares for more than 12 months may be eligible for the CGT discount. If they make a gain when they sell, Australian investors are required to notify the Australian Taxation Office. Investors are also advised to consult with the foreign tax authority to check the taxation process on capital gains.
Receiving Dividends From Foreign Investments
The way dividends are taxed depends on the tax treaty between Australia and the source country. In many cases, the source-country dividend tax is limited to 15%. Receiving dividends from companies that satisfy certain public listing requirements may result in tax exemption.
Depending on the conditions, some investors may be eligible for ‘franking credits’. That’s a form of tax credit that can offset against tax on dividends. Generally speaking, those who hold shares for a certain holding period (45 or 90 days) may be eligible.
Cryptocurrencies
In recent years, cryptocurrencies have become a major investment theme for Australian residents. When it comes to paying tax, Australian investors have to pay capital gains tax on crypto. On the other hand, professional traders pay income tax.
P2P Lending
Peer-to-peer (P2P) lending is a form of investment that’s accessible globally. Australians can access P2P lending platforms and lend money to borrowers without an intermediary. Peer-to-peer lending income listed in an investor’s loan portfolio will be included in the tax return form. For most people, this income is taxed like income from other investments. Australians who earn via P2P lending in foreign countries should consult their accountant.
Property Income
Australians who realize a gain when they sell foreign property are required to pay capital gains tax. However, if they held the property for 12 months or longer, they might be eligible for a 50% capital gains tax discount.
Additionally, investors who are subject to an overseas tax after selling their property will receive tax credits in the form of a foreign tax offset. Rental income may also be taxable in Australia or a foreign country, depending on the location of the property and current tax treaties.
Purchasing Bonds
Bonds can be highly tax efficient, since there are some benefits for those who hold them for 10 years. Otherwise, bonds are subject to the corporate tax rate of 30%. Investing in bonds means investors might not be eligible for tax credits and some other benefits.
Foreign Investment Capital Losses
Investors may sell a foreign investment for a lower price, and end up with a capital loss. In some cases, investors can use capital losses to reduce capital gains tax. Capital losses must be used at the first opportunity, unless there are restrictions. Capital losses can’t be used to reduce income, and should be reported to ATO just like capital gains.
Navexa lets you track foreign investments in both your tax residency’s currency and the local currency of the asset.
Foreign Investments: Track Everything Correctly
If you’re an Australian resident for tax purposes, you’ll be required to pay some form of Australian tax on foreign investments.
In general, all your worldwide income will be subject to tax, it’s just a matter of where you pay that tax. It’s always a smart idea to get familiar with the laws around this, and to consult professionals regarding your personal financial situation.
Further to this, serious investors should always track their transactions and portfolio performance for the purposes of both compliance and optimizing their investment strategy.
The Navexa portfolio tracker does exactly this. Track Australian and overseas investments, access detailed performance analytics on income, currency, trading fees and more.
And, most importantly, ensure your foreign investment gains and income are reported accurately at tax time.
Sign up to Navexa now for a free 14-day trial to see how easy tracking and reporting on foreign investments can be!
Total Stock Return is an investment performance metric that measures capital gains & income together. Here’s how to calculate it, use it, pros & cons, and more.
It’s vital to understand how your investments are performing. This is especially true for stocks that provide a dividend, which can have a significant impact on value and performance.
This is why it’s useful to know how to calculate total stock return. Knowing this allows investors to determine the real value they receive from their stocks, and better plan their investment strategy.
The Total Return, or Total Shareholder Return (TSR), also called the Total Stock Return, is the number that shows the amount of value gained for an investment. TSR includes dividends, and capital gains.
Total Stock Return shows the amount of value gained for an investment.
What Are Total Returns?
Stocks can give returns in a couple of ways:
Through the increase of the stock price.
Through dividends.
Total stock return reflects all returns from capital gains, dividends paid, plus any other gains.
It’s measured for a specific time period, and helps the investor see performance over that period. The metric can be expressed as a percentage, or a dollar amount.
The Importance of Total Return
There are several reasons investors should keep track of their total returns. Primarily, this number shows how well the investment performs. It’s also handy for comparing stock performance to each other, or the wider stock market.
Some investors tend to ignore the total returns of their holdings, and only focus on how the individual stocks move day to day, or week to week. This can create confusion about investment performance and strategy.
Since TSR accounts for the initial and ending stock price, plus dividends, it gives clarity over total investment performance.
Finally, knowing the total return helps with dealing with taxes and authorities, and possibly minimizing tax on investments.
It’s important to understand total stock return, not just capital gains alone.
Terms Investors Should Know
When dealing with the total stock return, investors should understand key investment terms, and concepts. Understanding the following ideas can help shareholders improve their financial literacy.
Annualized return: Return on investment over a 12-month period.
Simple returns: Returns that are based on the initial investment only.
Compound return: Return that’s paid for the initial investment plus accumulated income.
Compounding frequency: The rate at which an investment compounds — it could be annually, quarterly etc.
Dividend reinvestment: Receiving dividends as additional shares instead of cash.
Internal rate of return (IRR): Similar to total returns, only includes a future profitability metrics.
Expected total return: Same as total return, but using future assumptions instead of actual earnings.
Unrealized capital gains: Gains that are yet to be converted into cash by selling out of an investment.
Realized capital gains: Financial gains after an investment is sold.
Risk-adjusted return: Metric that includes investment risk levels while calculating returns.
How to Calculate the Total Return for a Stock?
There are several ways of calculating total stock return. The shareholder may use the formula below, an online calculator, or a next-generation tool like the Navexa portfolio tracker.
TSR Formula
There are a few steps to take before working with the TSR formula.
First, investors should calculate the capital gain on their investment since they purchased it.
For example, if the initial investment was at $100 a share, and the share is now trading at $150, capital gains are $50 per share.
Then, add all the dividends, and other earnings that the investment has paid during the entire holding period. This will show the total stock return, expressed in dollars.
The simple formula goes like this:
TSR = (capital gains + dividends) / purchase price
The purchase price is the amount of money the shareholder invested in the stock.
To get the TSR as a percentage, use the dollar amount of the total returns, divide it by the price paid for the investment, and multiply the result by 100.
TSR Annualized Formula
To annualize their total return, investors should:
Take the percentage calculated in the previous step and add 1.
Then raise that number to the power of 1 divided by the number of years they held the investment.
And finally subtract 1.
This is a more complex formula, and it looks like this:
Furthermore, this formula assumes annual compounding. Some shareholders may use monthly or continuous compounding, but this calculation should be enough.
TSR Calculated in Excel Sheet
Besides using the total return formula, some investors use Excel to get their numbers. The “Rate” formula can help out, but the shareholder still has to manually enter the details of their overall performance to get the correct data.
There are many ways to track total stock return, from manual to automated.
TSR Calculator
Those who want to calculate their total return can also use online TSR calculator forms. They can select their currency, fill in the starting and ending stock price, enter the total amount of dividends, and run the calculation.
TSR Calculated in Navexa Portfolio Tracker
Investors can use Navexa to get deeper insights into their holding and portfolio performance.
The method behind Navexa’s calculation is called the Modified Dietz Method. It provides a dollar-weighted analysis of the returns. It’s known as one of the most accurate methods to calculate investment performance, and gives investors a detailed view of their total stock returns.
Plus, our tracker accounts for the frequency, and size of cash flows, providing a complete picture of performance.
Total Shareholder Return Example
Here’s a simple example of TSR:
Let’s say an investor purchased 100 shares, each of them for a price of $10. This makes their total investment $1,000.
The shareholder decided to hold this number of shares for a certain period of time. During this time, the company paid a $2 per share dividend, while the share price hit $12.
The TSR for the time period equals ($12 – $10) +$2 / $10 = 0.4
To get the percentage, the investor should multiply this number by 100, which equals 40%.
Advantages and Disadvantages of Total Shareholder Return
There are many benefits of using Total Shareholder Return:
It’s a solid tool for performance analysis.
TSR is highly valued as a performance metric because of its simplicity.
The calculation offers a clear idea of an investment’s overall performance.
On the other hand, TSR is not a perfect methodology. Some of its disadvantages include:
It’s limited to the past performance of the stock and dividends paid per share.
Any market volatility, and market fluctuations will affect TSR numbers.
It only evaluates performance for a single period.
The total stock return formula has advantages and disadvantages.
Total Return With Reinvested Dividends
For shareholders who reinvest their dividends, calculating total return is a bit more complicated. This is because each of the reinvestments, including the capital gains, can easily become its own TSR calculation.
The formula we mentioned won’t work with this type of investment, as the new shares accumulate at the current trading price. This causes investors to end up with more shares than when they received the dividend. Plus, those shares will also start paying dividends on their own, and the numbers will start piling up.
The best solution to this issue is to simplify the approach — observe the overall investment, instead of looking at it on a per-dividend basis.
Using Navexa is an ideal way of keeping tabs on real returns and investment performance. The platform supports tracking for cryptocurrency ROI, so investors can view all their investments’ performance in a single account.
How to Use the TSR Formula in Investing?
There are many uses of TSR in investing. As we stated above, it’s a great way of comparing the total performance of different investments over time.
This is especially true for shareholders who would like to know which of their stocks (that pay dividends) are performing the best. With TSR, investors get a metric that tells them the past performance of an investment.
When it comes to stocks and investments, knowing the total and expected returns is crucial for making the right decisions.
The total return formula helps people who want to understand how their investments are performing. The calculation accounts for all gains, dividends, and other earnings This gives investors a clear picture of how their investment strategy has been performing.
The Navexa portfolio tracker is a powerful way of keeping track of total stock return.
A Useful — But Not Perfect — Investment Performance Metric
Being actively invested in the stock market means one should be keeping track of every share and dividend in one’s portfolio.
One of the easiest ways to do this is with the Total Stock Return formula. The TSR calculation includes all gains, and dividends earned per share received over a given period.
However, this calculation is limited to the past value of the dividend, and stocks. Plus, it can be affected by market volatility.
Still, it’s a great way of evaluating investment performance.
For a fuller, clearer picture of investment and portfolio performance, try Navexa. We’ve developed an all-in-one portfolio tracking platform that shows the true performance of stocks, crypto and unlisted investments.
Navexa’s advanced performance calculation accounts for capital gains, dividend income (including reinvested dividends), currency gain and other key factors that impact true performance.
Measuring portfolio performance can seem like a complex, dark art. We introduce eight powerful portfolio performance metrics for better understanding investments.
When it comes to investing, you want to make sure that you are keeping track of your portfolio’s performance.
This will help you stay on track and achieve your investment goals.
In this blog post, we will discuss the top eight portfolio performance metrics.
By tracking these metrics, you can make informed decisions about your portfolio performance and ensure your money is working hard.
What Are Portfolio Metrics?
A portfolio metric measures how well or poorly an investment or portfolio is performing. There are a variety of different portfolio metrics, each of which measures a particular aspect of investment performance. Tracking these metrics ensures that your portfolio is on track to reach your investment goals.
There are many different ways to measure different aspects of investment performance.
The 8 Best Portfolio Performance Metrics
We’ve compiled this short guide to eight of the most popular and respected investment performance metrics investors and analysts use to measure and judge stocks, funds, sectors and markets. From overall returns to different ‘delta’ measurements, all these metrics are useful and unique. Let’s dive in.
1.Compound Annual Return
The compound annual return, sometimes called compound annual growth rate, or CAGR, is the most common and most important metric for most investors.
Compound annual return is one of the most crucial portfolio performance metrics. It measures the percentage increase in your investment’s value each year, considering the reinvestment of dividends and capital gains.
This metric is essential for long-term investors as it can help measure the effectiveness of an investment strategy over time. By tracking compound annual returns, you track and analyze not just capital appreciation, but the impact of letting reinvested gains progressively fuel that growth.
2.Compound Annual Return vs. Benchmark
Comparing a compound annual return to a benchmark is a great way to measure a portfolio’s performance. A benchmark is a standard against which you can compare aninvestment’s performance. There are many different benchmarks you can use, depending on your investment goals.
For example, if you are trying to beat the US stock market, you can use the S&P 500 as your benchmark. If you are trying to achieve a specific rate of return, you can use your own benchmark based on that goal.
Compound return is one of the key measurements of long-term performance.
3. Sharpe Ratio
The challenge with the compound annual return is that it only focuses on return and says nothing about risk.
The Sharpe ratio is a measure of risk-adjusted return. This takes into account the volatility of your investment’s returns. This metric is vital for investors who are looking for a higher return potential but still want to keep their eye on risk.
The Sharpe ratio compares an investment’s potential return to its volatility. By tracking the Sharpe ratio, investors can make better informed decisions on a portfolio’s path, combine multiple diversified asset classes to smooth returns, or even lever investments to target a certain level or tolerance of risk.
4. Beta
But what about if your portfolio’s volatility is greater or less than the market as a whole? You would expect that investors taking on additional volatility must be compensated for the extra volatility risk.
Beta is a measure of how risky the overall stock market is. It’s like taking every stock in the market and combining it into one and calculating its volatility.
A beta of 1 means that the investment is just as volatile as the market, while a beta of 0.5 and 2 means that the investment is less and more volatile than the market, respectively.
Here’s an example of beta in action.
Say Walmart’s beta is roughly 0.5. This means that when the market goes up 2%, Walmart should go up 1%. The reverse is also true. If the market goes down 5%, you expect Walmart to only go down by 2.5%.
One important thing to understand is that stocks and other asset classes can have a negative beta. This means that when stocks go up, the negatively correlated asset will go down. And when stocks go down, this asset would go up.
This critical understanding enabled Ray Dalio to turn Bridgewater into a behemoth and is an asset allocation strategy shared by almost all of the best proprietary trading firms.
5. Jensen’s Alpha
If your performance beats beta, you get alpha.
Jensen’s alpha, also known as just alpha, is a measure of how much an investment outperforms or underperforms its expected return. If Walmart, with a beta of 0.5, matched the return of the market (beta of 1), you achieved alpha. You took less volatility risk than the market but matched the market’s return.
By tracking Jensen’s alpha, you can analyze which investments are outperforming or underperforming their benchmarks.
6. Treynor Ratio
While Jensen’s alpha focuses on excess return, the Treynor Ratio focuses on total risk-adjusted return.
This metric is helpful for investors who are looking to minimize their risk while still achieving a high return relative to the market.
The Treynor ratio can help determine whether an investment is worth the risk by comparing its potential return to its beta.
The Treynor Ratio focuses on total risk-adjusted return.
7. Sortino Ratio
How many investors would complain their portfolios are too risky after an 11% gain?
Likely not many.
The Sortino ratio is similar to the Sharpe ratio but only looks at downside volatility instead of total volatility.
This metric is essential for investors who are looking to minimize their losses and protect their principal investment.
The Sortino ratio can help determine whether an investment is worth the risk by comparing its potential return to its downside volatility.
By tracking the Sortino ratio, you can make judgments around downside risk. Combined with the Sharpe ratio, investors can use it to smooth their portfolio risk and expected returns.
8. Calmar Ratio
And while volatility to the downside is an essential proxy for risk, I think far more investors are concerned with the total permanent loss of capital.
The Calmar ratio is another measure of risk-adjusted return, which takes into account not the downside volatility but the maximum drawdown of your investment’s returns.
This metric is vital for investors who are looking to minimize their losses and understand the worst-case scenario for their investment.
The challenge with the Calmar ratio is that there are not as many data points to make it as statistically significant as the other methods.
It pays to understand the different portfolio performance metrics.
What Is the Best Portfolio Metric?
You’ve probably surmised that this is a trick question. While if I had to pick only one, I would crown the Calmar Ratio as king, you can get a much better view by understanding the above.
It’s worthwhile to understand multiple different portfolio performance metrics. Knowledge, as Benjamin Graham said, pays the best dividends.
By being familiar with compound annual growth, benchmarking, beta, alpha and the various ratios that measure risk and performance, investors give themselves more tools to understand and manage their investments.
The Best Way to Track Your Portfolio Performance Metrics
Renowned management expert, Peter Drucker, famously said ‘what can’t be measured, can’t be managed’. In other words, if you don’t know how an investment or portfolio is performing, you’re going to have a difficult time managing and improving its performance.
This is why it pays to understand eight performance metrics explained here. And, why we recommend investors use a portfolio tracking platform to help them measure, analyze and optimize their own performance.
Navexa is designed to help investors do exactly that. By bringing all stock, crypto, ETF, cash and other investments into a single unified tracking account, we help you measure every aspect and factor of portfolio performance so you can focus on making data-driven investment decisions.
The Navexa portfolio tracking platform
Portfolio Performance Metrics FAQs
What is a good ROI?
A good ROI, or return on investment, is a measure of how much money you make on your investment compared to how much money you put in. This metric is important for investors who are looking to make a profit on their investment. While this varies for each investment class, it’s usually asked in the context of the stock market.
We also know that volatility is a critical component of understanding return. However, if you’re still interested, you can check out Professor Damodaran’s Equity Risk Premium for the month and multiply by your portfolio or stock’s beta.
What Is a good Sharpe ratio?
A good Sharpe ratio is between 1 and 2, and above 3 is considered excellent.
What is a good Jensen’s alpha?
Any positive value for Jensen’s alpha is excellent. It means the portfolio has beat the market with a superior selection of assets.
What is a good Treynor ratio?
A good treynor return is anything greater than the S&P500 minus the current risk-free rate.
What is a good Calmar ratio?
A Calmar ratio between 0.5 and 3.0 is considered Great. Anything above 3.0 is excellent.
How is annual compound return calculated?
The Navexa portfolio tracker uses an advanced portfolio performance calculation based on the Modified Dietz method to measure annualized, money-weighted performance. Navexa also calculates and displays CAGR performance.
How is the Sharpe ratio calculated?
The Sharpe ratio subtracts the risk-free rate from the investment’s return, then divides the result by the standard deviation of it’s excess return.
How is the Treynor ratio calculated?
The Treynor ratio divides the difference between average return and the average risk-free rate of return by the investment’s beta.
How is the Sortino ratio calculated?
The Sortino ratio divides the difference between an investment’s aggregated earnings and the risk-free rate of return by the standard deviation of negative earnings.
The discounted cash flow (DCF) method can help you calculate the current value of an investment. DCF can be used to value companies, stocks, and bonds. Keep reading to learn how to use it.
Determining the current value of a stock is a key part of investment research. One method for doing this is the discounted cash flow (DCF) method, which values a stock — or any other investment — based on predicted future cash flows.
The DCF model involves several steps, each calculating different data, to estimate the present value of stocks, bonds, or businesses.
The DCF model relies on the weighted average cost of capital as the hurdle rate. However, you’ll also likely have to calculate a terminal value, intrinsic value, free cash flow (FCF), and a few other metrics before employing the DCF formula. Here’s what you need to know.
How do Investors Determine the Value of a Business?
The discounted cash flow method is one of the best ways of valuing a business.
Investors generally evaluate a business before they invest in it. Luckily, there are several methods to determine whether an investment’s current price represents fair value or not.
They may use comparable financials to identify similar companies in an industry or sector. They may access databases which provide financial information and a value range for companies.
The discounted cash flow method is one of the best ways of evaluating established companies with a good track record of revenue and costs.
However, the discounted cash flow model is quite complex to work with. It involves multiple calculations related to cash flows, rate of return (RoR), equity, and so forth. The discounted cash flow calculation can be used for stocks, businesses, bonds, and other business projects.
Navexa provides a powerful discounted cash flow calculator. You can use this to estimate a stock’s value by inputting key financial metrics — a handy addition to Navexa’s automated portfolio tracking and tax reporting tools for stock and crypto investors.
Introduction to the Discounted Cash Flow Model
Anyone who understands the basics of DCF can use it to evaluate a business.
The discounted cash flow model is helpful in determining a company’s ‘intrinsic’ value. It’s used to determine the value of an investment based on estimated future cash flows. The DCF method is the standard in evaluating privately-held companies, although it could be used for publicly-traded stocks, too.
For many, DCF is a complex mathematical and financial equation, most commonly used by Wall Street experts. However, anyone who understands the basics of DCF can use it to evaluate a business.
The first thing to look into is the weighted average cost of capital (WACC). The WACC represents the hurdle rate for this model, and it’s the minimum RoR required for the project or the investment. Riskier projects have a higher hurdle rate, and vice versa.
Related Terms
These are some of the related terms you should know about if for DCF:
Time value of money — a core principle in finance. This refers to the fact that a sum of money is worth more now than in the future due to its earning potential.
Discount rate — in terms of DCF, discount rate refers to the interest rate used to showcase the current value.
The risk-free rate of return — a theoretical term that refers to interest received from a risk-free investment.
Terminal value — the value of the asset/business/project that goes beyond the forecast period. It assumes the business will have a set growth rate forever. It’s used as an indicator of future cash flows.
Earnings per share — shows the amount of money a company earns for each share. It’s often used for determining the value of a business.
The intrinsic value of a business — observes the value of a business on its own. Represents the present value of all expected future cash flows with an appropriate discount rate.
Internal rate of return (IRR) — a discount rate used to estimate the profitability of an investment.
Net present value of a company — a method of calculating your ROI.
EBIDTA — earnings before interest, taxes, depreciation, and amortization; represents a measure of a company’s overall financial performance.
Formulas You Might Need
Calculating discounted cashflow relies on multiple other formulas.
There are several formulas you might need to perform a DCF calculation.
Time value of money
PV = FV / (1 + r)
Where:
PV is the present value
FV is the future value
r is the rate of interest
Besides the formula, you can use an online calculator to get these numbers if necessary.
Terminal value
(FCF x (1 + g)) / (d – g)
Where:
FCF represents free cash flow for the last forecast period
g is the terminal growth rate
d is the discount rate (usually the weighted average cost of capital)
Earnings per shares outstanding
EPS = net income of company – preferred dividends / common shares outstanding
If the results are above the current cost of the investment, the opportunity will likely result in a positive ROI.
What Can Discounted Cash Flow Tell You?
DCF helps calculate how much money one could receive from the investment if they invested in it today. It’s adjusted for the time value of money, which further helps determine whether future cash flows will be equal to or higher than the value of your investment.
Furthermore, DCF can be used for calculating:
The cost of purchasing an investment
Rental income
Expenses like mortgage, utility bills, cost of debt
Estimated sales proceeds
Where to Find the Necessary Data?
The DCF calculation is highly sensitive to the data used in it.
In order to successfully do the DCF valuation, you’ll need to find specific rates. These are:
The growth rate of the cash flows.
The discount rate that you’ll use to discount future cash flows.
Terminal rate to determine the final value of the DCF.
Growth Rate for Cash Flows
Since the DCF calculation is highly sensitive to the data you enter, it’s best to start within a reasonable range. Check the company’s balance sheet for past growth rates and use those to predict future cash flows. Remember that any number you choose is an estimate, and will affect your final result.
To calculate the growth rate, subtract year 1 cash flows from year 2 cash flows. Then divide the result by year 1 cash flows.
Discount Rate of Return
Next, you should find the discount rate of return for cash flows. To do this, use the WACC method. As we said before, the WACC is fundamental for discounted cash flow calculation.
To get WACC numbers, you should find the cost of debt and cost of equity first. Then, you should calculate the weights of both.
The formula for the weight of debt is:
WD = Total debt / (Market cap + total debt)
The formula for the weight of the equity is:
WE = Market cap / (Market cap + total debt)
Then, you calculate the WACC. The formula goes as follows:
WACC = (E / V x Re) + [D/V x Rd x (1 – Tc)].
Where:
E is the market value of the firm’s equity
D is the market value of the firm’s debt
V is E + D
Re is the cost of equity
Rd is the cost of debt and
Tc is the corporate tax rate.
Lower WACC is considered better than higher WACC.
Terminal Rate
The terminal rate is also one of the key inputs of the DCF calculation. It influences the value you’ll calculate for the future.
If you’re hoping to stay consistent in calculations, you should use the same rate you used for calculating the discount rate, WACC, or the rate at which the company grows.
Now that you have these numbers, it’s time to move on to the DCF calculations.
Value Investments Using the DCF Method: Companies, Stocks, and Bonds
The DCF model is great for evaluating different kinds of investments, including bonds and stocks. Here’s how you can use it to see whether a certain investment is worth its current price.
How to Use DCF to Value a Company?
There are two common methods for working out a company’s future cash flow.
There are certain steps to make to successfully calculate discounted cash flow for companies:
Analyze the income
Determine terminal value
Calculate enterprise value
Include additional assets
Subtract all debt and non-equity claims
Since the DCF model reflects the value of a company’s future cash flows, the first step is to understand and analyze the income of the organization. There are two common methods for this:
Unlevered DCF approach — forecast and discount entire operating cash flows, then add non-operating assets and subtract liabilities.
Levered DCF approach — forecast and discount cash flows that remain available to shareholders after non-equity claims have been deducted.
At a certain point, you’ll stop calculating unlevered free cash flows and move to determine the lump sum or terminal value. The terminal value represents the value of a company beyond the final explicit forecast period. For this, you’ll usually use the estimate numbers.
The next step is to determine the enterprise value. This number represents the value of a company’s operations to all stakeholders.
If a company has any money sitting around, you should include that money into the present value of unlevered free cash flow.
The final step is to subtract all debt and non-equity claims to calculate what’s left for the equity owners.
How to Use DCF to Value Stocks
The DCF method is useful for evaluating stocks.
The DCF method is also handy for evaluating stocks. Here’s how:
Take the average last three years of the company’s cash flow.
Multiply the FCF with the expected growth rate to get the FCF for the future.
Calculate the value of that cash flow by dividing it by the discount factor.
Repeat the process for the next X amount of years to get the net present value (NPV) of the FCF.
Calculate the terminal value of the stock by multiplying the final year FCF with a terminal multiple factor.
Add the values from steps 4 and 5 and adjust the total cash and debt (find these in the company’s balance sheet) — this gives you the market value of a company.
Divide the market value of a company by the shares outstanding to find the intrinsic value per share.
How to Price Bonds with DCF?
Determining the fair value of the bond involves calculating the bond’s cash flow.
Finally, you can use DCF to value bonds, as their price is based on a model close to the DCF one. Typically, determining the fair value of the bond will involve calculating the bond’s cash flow (current value of a bond’s future interest payments) and its face value (the value of a mature bond).
Both these values are fixed, which helps you determine the bond’s RoR.
Here’s what to look at:
Maturity date: Short or long-term, when reached, the bond’s issuer must repay the bondholder the full bond value.
Discount rate: Interest payments that go to the bondholder, usually a fixed percentage of the face value.
Current price: Bond’s current value, dependent on several factors such as market condition.
Pricing a bond is relatively simple, and can be done in the following way:
Calculate face value, annual discount rate, and maturity date
Collect the basic information about the bond; face value, on-par value, and the bond’s annual coupon rate. Also, note the maturity date. You’ll need these numbers to continue the DCF valuation method.
Calculate expected cash flows with the formula:
Cash Flow = annual coupon rate x face value
Discount the expected cash flows to the present
Cash Flow ÷ (1+r)^t
Where:
r is the interest rate
t the number of years for each cash flow
Value individual cash flows
To calculate the cash flows, use the following formula for each year:
Includes all major assumptions about the company/project
Determines the intrinsic value of a business
Includes all future expectations about the business
Suitable for analyzing mergers and acquisition
Can be used to calculate IRR
Limitations of the DCF Model
The main cons of this model:
Involves a large number of assumptions
Prone to errors
Too complex for novice investors
Sensitive to changes in assumptions
Isolates the company’s value
Doesn’t include competitor’s value
Terminal value TV is hard to estimate
WACC is hard to estimate
Is DCF the Same as Net Present Value?
Even though these two methods are related, the DCF is not the same as net present value (NPV). NPV is actually the fourth step in calculating the DCF. It’s used to deduct the upfront costs of the investment from the investment’s DCF.
Final Word On The Discounted Cash Flow Model
The Navexa portfolio tracker provides an automated discounted cash flow valuation calculator.
The discounted cash flow valuation method projects a series of future cash flows and earnings, which it discounts with the time value of money. It’s one of the best ways to assess the present value of stocks, bonds, or businesses.
The DCF method is most suitable for experienced investors since it’s complex.
So, now you know how to analyze a potential investment’s value using the discounted cash flow method. And, since you’ve landed here on the Navexa blog, we have good news:
You can skip the complex calculations by using the automated discounted cash flow valuation calculator we’ve built into Navexa.
Navexa is a portfolio performance tracking and tax reporting platform that allows you to track your stocks and cryptos together.
Discover the twelve key metrics investors use to assess dividend-paying stocks and the companies behind them.
Investing in dividend stocks is one of the proven, long term methods of building wealth and passive income. Investors can enjoy compounding investment income for many years, and even build enough income that they can live on dividend yields alone.
Researching dividends can be a complex process. So in this post, we’re going to walk through 12 of the key metrics investors can use when analyzing a dividend paying stock or company.
Dividends: The Basics
Dividends are a company’s payments to its shareholders. Many investors prefer to hold dividend stocks, since they can collect cash dividend payments, or collect additional shares through dividend reinvestment programs.
There are different types of dividends available to shareholders:
Cash dividend — the company shares a portion of its net income with shareholders.
Stock dividend — instead of paying cash, the company issues more shares.
Property dividend — the organization offers its assets to shareholders.
Liquidating dividend — not taxable, the company pays it from liquidating its assets.
Special dividend — contains additional cash profit, and is higher than regular dividends.
Interim dividend — paid before issuing the actual dividend.
Dividend stocks are sometimes less volatile than growth stocks. This can make them preferable for investors with lower risk tolerances.
Dividends are often paid quarterly, but some companies pay them out annually. A consistent dividend payout might be a sign of a healthy company, but that’s not always the case.
Companies might sometimes offer high dividend yield to entice further investment, when in reality, the business is failing. This is called the dividend trap.
This is why it’s crucial to learn how dividends work, and understand how to analyze the key metrics of dividend-paying stocks.
How do Dividend Stocks Work?
Income investors look for stocks that pay a portion of their profits in dividends.
These types of stocks can deliver returns in two ways:
Dividend income from dividend payments
Growth of the stock price
Additionally, the dividend payouts can compound when they’re reinvested into shares. Stocks can pay dividends despite the share price fluctuating.
Investors can use the money to:
Reinvest in the shares of the same company
Buy stocks of different organizations and diversify the portfolio
Save the money
Spend the money
Dividend Investing: How to Start
Dividend investing means buying stocks because they pay out regular dividends. Investors seek these stocks by looking for companies that offer stocks with a stable, regular dividend payout.
The usual steps of investing in dividend stocks include:
Opening a brokerage account — best and fastest option is opening the account online.
Funding the account — verifying the identity, and connecting the bank account usually lasts a few days.
Buying the right stock — this decision should be based on knowing the investment goals and proper research.
Collecting the dividend yield — once someone holds the stocks for a certain time, they’ll receive the first dividend payment.
Top 12 Key Metrics for Dividend Stock Analysis
Researching dividend stocks involves different layers of company and share price analysis.
There are many metrics to follow in dividend investing. These help to build an understanding of how well the company operates, how stable its earnings are, and possible future growth.
Dividend Payout Ratio
The dividend payout ratio is one of the most common financial ratios investors check. It measures how much of a company’s earnings (after tax) is paid out in dividends. It also shows how stable the dividends are and how much the business is growing. High dividend payout ratios tend to be regarded as riskier — since most of the company’s earnings go into dividends, they might not be sustainable.
Dividend payout ratio is calculated by dividing dividends paid by earnings after tax, and multiplying the result by 100.
Free Cash Flow
Investors can see the business’s cash flow from the company statements. Free cash flow shows how much expenditure a company has and how much free cash remains to be given to shareholders through dividends. The better the free cash flow, the more cash is available for dividend payouts.
Free cash flow is calculated using three factors:
Operating cash flow
Sales revenue
Net operating profits
Return on Invested Capital
Shareholders will usually invest in companies that can grow their capital quickly. Return on invested capital is a similar measurement to return on equity, only it shows a company’s return on both equity and debt.
It’s calculated by dividing the net operating profit after tax by the amount of invested capital.
Operating Profit Margin
The company’s operating profits show the earnings before interest and taxes. The operating profit margin is a ratio of income to profits from sales. The higher the ratio, the stronger the dividend income prospects (in theory).
The operating profit margin is calculated by dividing the operating income (earnings) by sales (revenues).
Asset Turnover
This is a less known financial ratio, but still equally important as others. It measures how many dollars of sales were generated by each dollar of assets. Organizations that have more sales usually generally offer stronger returns.
This metric is calculated by dividing net sales (revenue) by the average total assets.
Sales Growth
Using a dividend reinvestment plan, investors can compound their holdings by accumulating additional shares.
Sales growth is one of the best metrics to see whether the company has a good business model driving higher revenue. Good sales growth trends show potential for growth.
It’s calculated by first subtracting net sales of the previous period from the current period. Then, the result should be divided by the net sales of the previous period and multiplied by 100 for a percentage.
Net Debt-to-Capital
Businesses also go into debt. This is why net debt-to-capital is crucial for understanding how the organization deals with its finances. Overall, a net debt-to-capital ratio below 50% is considered good.
This metric is calculated by dividing the company’s net debt by its capital.
Net Debt / Earnings before interest, taxes, depreciation, and amortization (EBITDA)
EBITDA compares a company’s debt to its earnings. It’s often used to compare different businesses. Net debt divided by EBITDA shows how many years the business will take to eliminate debts with cash on hand and annual cash flows.
Price-to-Earnings Ratio
P/E is another popular calculation to know. It divides a company’s stock price by the earnings per share, revealing to the market how much the company is worth. In general, the P/E ratio of less than 20 is considered good.
Total Shareholder Return
TSR helps investors observe both the stock price and dividend yields. It accounts for both the price and the dividends paid. It’s a way to see where a stock sits relative to the wider market.The formula is:
If you want to see how your investments are really performing, you must factor in portfolio income. Navexa makes it easy to see your complete returns for all your stocks and crypto.
Dividend yield
Dividend yield represents the percentage of annual dividend payments to shareholders. This number shows what the investor can expect to get in the future from the stocks they hold, if the dividends remain the same. However, the dividend yield can change over time, depending on the market conditions and company developments.
This metric is calculated by dividing cash dividend per share by the current price per share. To get the percentage, multiply the result by 100.
Dividend Growth Rate
Besides looking into dividend yield, investors also observe the dividend growth rate. This metric shows how much a dividend has increased each year. Those businesses that offer an annual dividend increase could be more appealing.
A steady, long-term increase in dividends shows that the company is (in theory) generating enough cash flow to fund that growth. The formula for dividend growth rate is:
Dividend Growth Rate = (D2/D1) – 1
What Is Considered a Good Dividend Payout Ratio?
Dividend payout ratios between 30% and 50% are generally considered healthy.
Investors often look for the best possible dividend payout ratio. Overall, a ratio of 30% to 50% is considered healthy. Payout ratio numbers above 50% may appear unsustainable.
Additionally, the dividend payout ratio varies from industry to industry. For example, you might notice different dividend yields in the tech sector versus among utility companies.
How Are Dividends Taxed?
In Australia, investors must pay taxes on both capital gains and dividends.
However, companies pay out dividends that have already been subject to taxation. Australian laws recognize that shareholders shouldn’t be taxed again on the same profits, so investors receive a rebate for the tax that companies have paid. These dividends are known as “franked”. They also have a tax credit.
On the other hand, ‘unfranked’ dividends don’t have a tax credit, as the company didn’t pay taxes for them, so investors will have to.
The financial year in Australia goes from July 1 to June 30. This is the period when shareholders should collect all the financial information and go through an assessment.
In Australia, dividend reinvestments are treated the same as cash dividends. This means that if you receive shares instead of cash, you’ll still need to pay taxes.
If you struggle to calculate portfolio gains for the fiscal year, Navexa is here to help. Once you upload your portfolio, Navexa’s taxable income reporting tool automatically calculates your obligations and provides a detailed breakdown for reporting purposes.
What’s more, you can download this data in XLS or PDF and easily report your capital and other gains.
What Is a Good Dividend Strategy?
Some investors time their buying and selling based on a stock’s dividend activity.
Dividend strategy refers to planning around when to buy and sell shares in a dividend-paying stock. The dividend capture strategy is one of the common ways investors get into dividend stocks.
To do this, investors keep track of the dividend timeline:
Declaration date — when the company announces dividends.
Ex-dividend date — when the stock starts trading without the value of the dividend.
Date of record — when current shareholders receive dividends per share.
Pay date — when dividends are paid.
In this strategy, the best moment to purchase the stock is right before the ex-dividend date. Then, investors would receive the dividends, and sell the shares right after they’re paid. The main purpose of buying and selling is to get the dividend, then exit the position.
This is the opposite of long-term investing, where the investor keeps the stocks and allows for compound growth.
What Is Dividend Analysis?
Dividend analysis is when investors to analyze dividend-paying stocks over a long period. The data is presented in graphs and shareholders can easily see if the company pays regular dividends per share, and if it increases them. Dividend analysis also shows how sustainable dividend payouts are for the company based on current earnings.
Pros and Cons of Dividend Investing
Many investors get into dividend stocks to boost their passive income through dividend yield. Still, there are some pros and cons to consider when it comes to investing in dividends.
Pros:
Great source for passive income.
Dividend stocks may be less risky than smaller, speculative companies.
Long-term dividend stocks may be relatively stable.
Many ways to utilize the annual dividend per share.
Cons:
Investors need a lot of capital to create significant income.
The business may change the dividend policy.
Dividend taxation may confuse new investors.
Requires careful research.
Navexa’s portfolio tracking platform automatically tracks all dividend income, reinvested dividends, and breaks down how it impacts a portfolio’s performance.
Final Word On Key Dividend Metrics
Investing in dividend stocks can be a solid strategy — or part of a strategy — for building long-term wealth in the stock market. However, experienced dividend investors know there’s more to it than just picking out the first company they come across.
The dividend payout ratio is one of the most important metrics to consider. The other 11 metrics we’ve detailed here are also important in analyzing a dividend stock. These key metrics can help to analyze not just the stock price, dividend yield, or payout ratios.
They also tell a story about how the company operates and whether purchasing a specific stock could provide a long-term dividend yield or perhaps indicate a dividend trap.
Keep in mind that dividend investing carries both risk and tax obligations. This is where Navexa can help.
We’ve built a powerful automated tracking tool that allows you to track all your stock and crypto performance in one place. Navexa tracks and records all dividend income and calculates its impact on your total performance.
At tax time, our Australian customers can run automatic reports to calculate and optimize both their CGT and taxable income activity.
Sign up for free today and test out Navexa’s powerful automated investment performance tracking and tax reporting tools.