Categories
The Benchmark

The easy money has been made (or has it…)

April 22, 2024


The S&P 500 in 2034?

Dear Reader,

Senior journalist and MIT Technology Review contributor Richard Fisher has been studying how humans perceive time.

Just as a child grows from only being able to imagine tomorrow, or next week, to eventually grasping the idea of not only their own life, but the distant past and distant future either side of it…

The whole human species’ sense of time has evolved with our civilization.

And yet, Fisher writes:

While we may have this ability, it is rarely deployed in daily life. If our descendants were to diagnose the ills of 21st-century civilization, they would observe a dangerous short-termism: a collective failure to escape the present moment and look further ahead.

So often it’s a struggle to see beyond the next news cycle, political term, or business quarter.’

The ‘short-termism’ Fisher notes is, of course, very much present in the investment world.

With their capital at risk, investors easily fall prey to a market’s daily, or weekly, or monthly volatility.

You don’t have to look far to find someone who sold early — or didn’t buy in the first place — because they fell into ‘dangerous short-termism’ instead of stepping back and trying to see the big picture.

Meanwhile, the big picture, long-term thinkers position themselves on the other side of such decision making.

As the king of long-term benchmark outperformance, Warren Buffett, says:

The stock market is a device for transferring money from the impatient to the patient.’

The market’s next year decade

In the spirit of highly-evolved, long-term thinking, let’s consider the idea of the ‘secular bull market’.

According to Investopedia:

A secular bull market is a market that is driven by forces that could be in place for many years, causing the price of a particular investment or ​asset class​ to rise or fall over a long period. In a secular bull market, positive conditions such as low interest rates and strong corporate earnings push stock prices higher.

In a secular bear market, where flagging corporate earnings or ​stagnation​ in the economy leads to weak investor sentiment, stocks experience selling pressure over an extended period of time.

The idea here, is that there are short and long-term cycles in markets.

And if, as Buffett says, the stock market transfers money from the impatient to the patient, surely it pays to know about these long term ‘secular’ markets, right?

Take a look at this:


On the chart above, you can see the S&P all the way back to the 1920s.

Zoomed out that far, you can see the argument for ‘long-term secular trends’ in the stock market.

The argument basically goes that over the long term, the US stock market moves through periods of expansion and contraction that last about 16 to 18 years.

Viewed through this lens, you can make two observations:

First, there have only been two secular bull markets since the 1920s — one in the 1950s and 1960s, and another in the 1980s and 1990s.

Second, those ‘expansionary’ periods preceded periods of contraction, which you can see marked by red text.

These are inflationary or deflationary periods where stocks basically grind sideways over the long term.

The last two contraction periods for the market occurred from the mid 1960s until the early 1980s and from the late 1990s to about 2014.

So going by the chart, we’re in a secular bull market right now.

Could stocks rise for the next 10 years?

Some of the most experienced investors and fund managers on the planet right now certainly think so.

Robert Sluymer has been analyzing and forecasting financial markets for some of the largest institutions in the world for more than 30 years.

Late last year, he went on record with his prediction for where the S&P500 — the biggest in the world — is headed in the next decade.

The long-term secular trend for US equity markets remains positive with an underlying 16 to 18 year cycle supportive of further upside into the mid 2030s, potentially to S&P 14,000.

The S&P could move toward 14,000 by 2034 which is when we expect the current 16 to 18 year secular bull cycle to peak.’

Bank of America technical strategist, Stephen Suttmeier, has a similar take:

The secular bull market breakouts from 1950, 1980 and 2013 suggests that the S&P 500 can spend much of 2024 north of 5,000. This corroborates bullish pattern counts for the S&P 500 near 5,200 and 5,600, respectively.’

This chart shows the 1950 and 1980 secular bull markets with the 2013 (current) one overlaid:


Patience is bitter…’

Patience is bitter, but its fruit is sweet.’ So said Swiss political philosopher Jean-Jacques Rousseau.

This email is not arguing for or against the view that the stock market is going to rise for roughly the next 10 years.

The point is that, either way, taking a step — or a few steps — back from the day-to-day behaviour of the stock market can give you a fresh perspective and appreciation for time.

Take a look at this chart, showing the number of times the media called the top of the market between 2009 and 2017:


Nine times, these publications claimed ‘the easy money has already been made‘. And all nine times, stocks kept climbing.

As Richard Fisher observes, it’s the more highly developed and evolved among us who can grasp the bigger picture and appreciate timescales beyond ‘dangerous short-termism‘.

And if, as Buffet says, the market merely moves wealth from the impatient to the patient…

Then perhaps it’s useful to make sure we’re among the latter, rather than the former.

Now…

You’re still reading, so I’m going to presume you found this email useful, or interesting, or maybe even both.

If that is the case, it would make our day if you’d help us make someone else’s — forward this email on so we can share The Benchmark with more great readers.

Subscribe.

Invest in knowledge,

Thom
Editor, The Benchmark

Unsubscribe · Preferences

All information contained in The Benchmark and on navexa.io is for education and informational purposes only. It is not intended as a substitute for professional financial or tax advice. The Benchmark and any contributors to The Benchmark are not financial professionals, and are not aware of your personal financial circumstances.
Categories
The Benchmark

Welcome to The Benchmark

April 15, 2024


Investing, Fast & Slow

Dear Reader,

Welcome to The Benchmark!

You’re reading this because you joined the Navexa mailing list.

Which means you have, at the very least, a passing interest in investing, the markets, and building wealth.

Which means that — we hope — you’ll find this email informative and entertaining.

Here’s why:

Mission statement

An investment in knowledge pays the best interest,‘ as Benjamin Franklin said.

That statement sums up why we’ve launched this email.

Each week, we’ll write to you with stories, ideas and content that offers some insight and/or perspective to what’s happening in the markets and the wider investing world.

These will include (but not be limited to):

  • Stories about the history of money, wealth and economics.
  • Notes on current events moving markets.
  • Interviews with our global network of HNW investors, traders, analysts and digital asset pioneers.
  • Analysis & comparisons of investment strategies
  • Answers to your questions

The Benchmark will not be making investment recommendations, nor providing financial advice.

Our aim is to provide investing knowledge that ‘pays interest’.

While this isn’t an investing email for beginners, necessarily, we should start with some basics.

And it doesn’t get much more basic than why we invest in the first place.

Check out this post:


The case for investing, in starkly simple terms.

If the idea that investing is essential to building real wealth, as Willy Woo so clearly shows, resonates, then this email is for you.

But, hang on a second.

Why The Benchmark?

This is why:

From 1965 to 2023, Warren Buffett has achieved an annualized return of 19.8%.

Compare that to the S&P 500 index, which has returned 10.2% a year.

Buffett has ‘beaten the benchmark’ by 9.6% for nearly six decades.

That might not sound like much to the average, short-term thinking, investor.

But let’s take a look at what that delta means in dollar terms.

The S&P 500’s 10.2% annualized return turns a $100,000 investment into just shy of $28 million.

Not bad right?

Most of us wouldn’t turn our noses up at that prospect.

But what about the Oracle of Omaha?

Well, the result of his 9.6% outperformance over those 58 years probably have something to do with the look on his face in this photo:


Warren ‘The Benchmark Beater’ Buffett

Because 19.8% a year, for 58 years, turns $100,000 into more than $3.5 billion.

Even with six decades of inflation accounted for, that’s still an exponentially larger sum than $28 million.

That 9.6% outperformance, over that timeframe, amounts to the $3.2 billion difference.

In other words, consistent long-term outperformance has exponential, real-money, consequences.

That’s why we invest in the first place.

It’s why we built the Navexa portfolio tracker.

And it’s why we’ve launched The Benchmark — to deliver ideas, stories and perspectives that will help you become a more effective and complete investor.

Quote of the week

Money does not buy you happiness, but lack of money certainly buys you misery.’ — Daniel Kahneman

The headline for this email comes from the late Daniel Kahneman, who died earlier this year. Daniel’s book, Thinking, Fast and Slow, released in 2011, was the culmination of a life spent exploring human decision making.

He won the Nobel memorial prize in economics in 2002 ‘for having integrated insights from psychological research into economic science, especially concerning human judgment and decision-making under uncertainty‘.

What now?

Next week, we’ll dive into the stock markets, exploring where they’ve been, where they’re at, and where they’re (possibly) going.

If you enjoyed this email and you’re looking forward to the next one, then be sure to whitelist us in your inbox, and, if you have a spare five seconds, send us a quick reply with any questions or comments you have for The Benchmark.

Invest in knowledge,

Thom
Editor, The Benchmark

Unsubscribe · Preferences

All information contained in The Benchmark and on navexa.io is for education and informational purposes only. It is not intended as a substitute for professional financial or tax advice. The Benchmark and any contributors to The Benchmark are not financial professionals, and are not aware of your personal financial circumstances.

Built with ConvertKit

Categories
Financial Literacy Financial Technology Investing

Navexa 3.0: A New Breed Of Portfolio Tracker

In October 2023, we unveiled a major new update to the Navexa Portfolio Tracker. Here’s an explainer on the key changes.

Navexa started life as a basic portfolio tracking tool. Today, it’s developed into a multi-asset, multi-market platform that gives investors professional-level portfolio tracking and analysis on a level no other tool can match.

In October 2023, we launched the most advanced iteration of Navexa to date. In this post, we explain the changes and walk you through a few of the powerful new tools we’ve created to make understanding and optimizing your investments easier than ever before.

Watch our Navexa 3.0 Webinar

We revealed and explained the latest iteration live on a webinar for our customers. Watch the replay free — just click the player:

Navexa 3.0: The Philosophy Behind The Redesign

Navexa started life in 2018 as a basic portfolio tracking tool. It quickly evolved, supporting more markets and offering more solutions to the all-too-common problems investors encounter trying to accurately track and analyze their long-term investment performance.

Today, we’re shedding our reputation as ‘another portfolio tracker’ and revealing four big new changes and additions to our platform.

Here, we introduce and explain the key new tools and updates, and show you why Navexa now offers performance tracking and portfolio analysis tools distinctly different from other platforms.

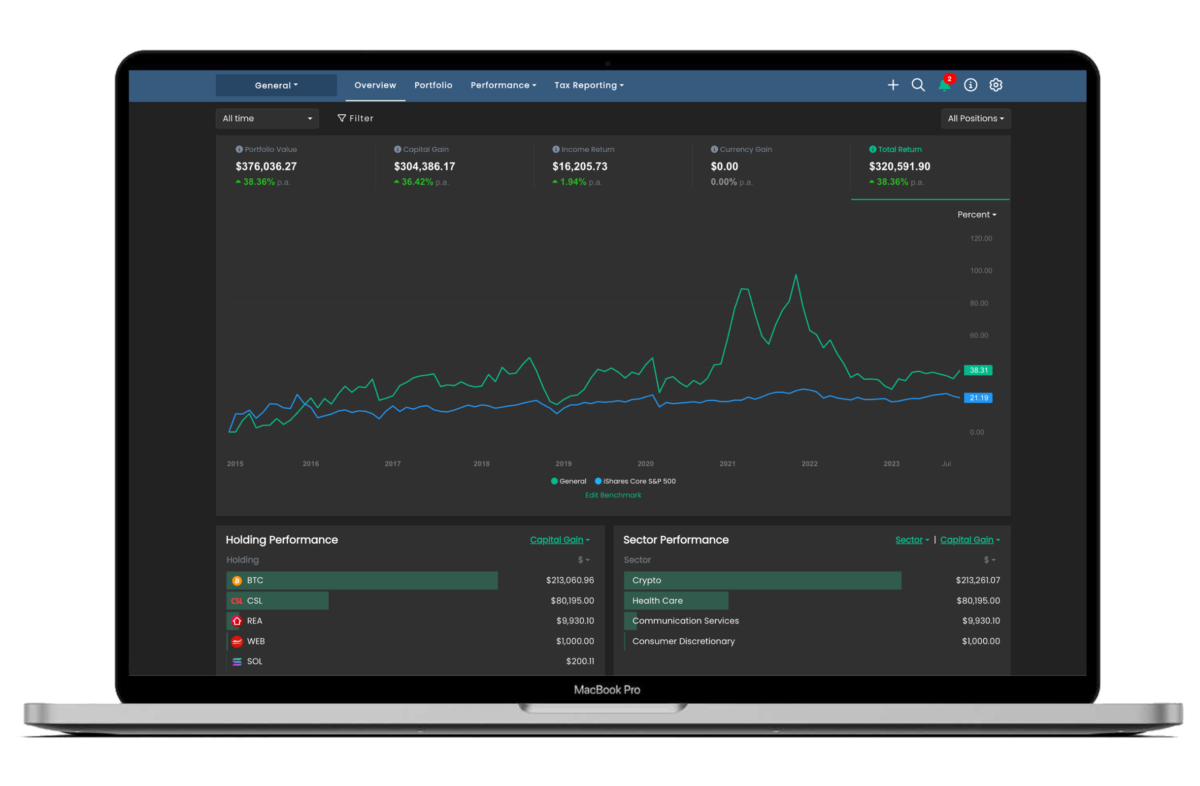
New: Portfolio Overview Screen

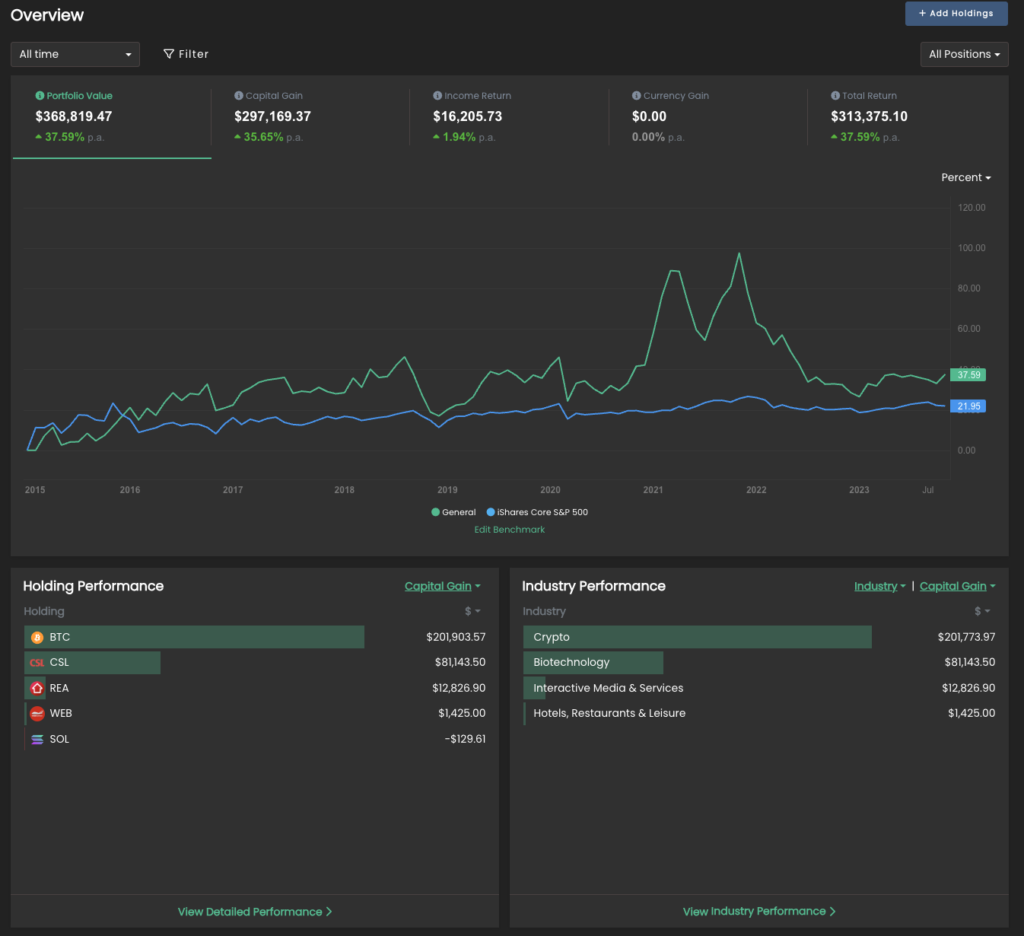
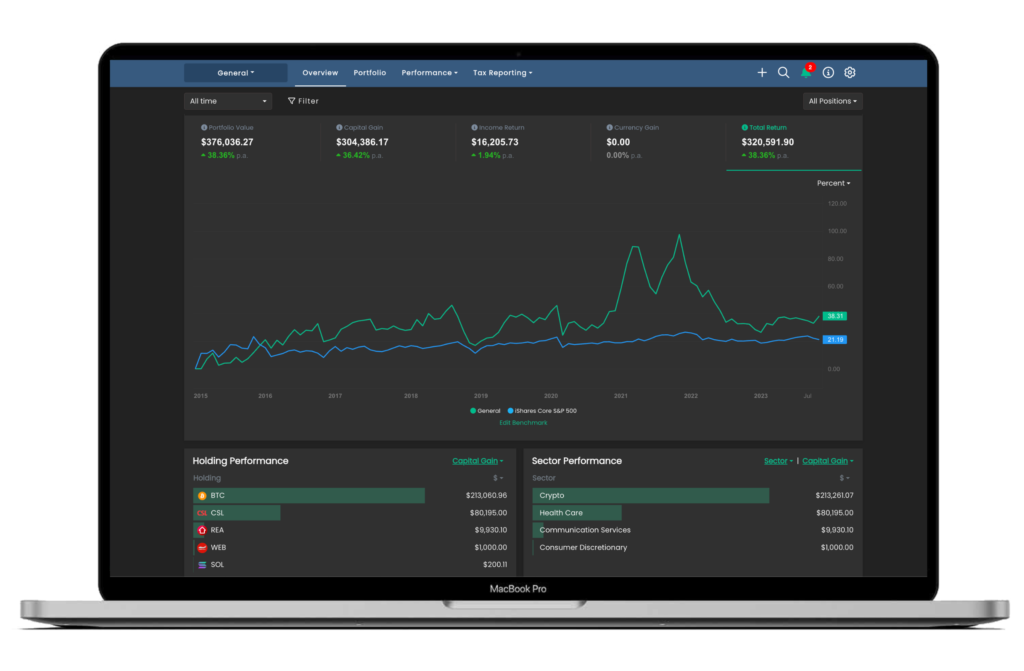
The most visible update we’ve made to Navexa is the new Overview screen:

The idea behind this screen is that investors can see all their key portfolio performance metrics at a glance in one place.

While previously (and on other platforms) you needed to visit different parts of your account to find everything you might need to know, the new overview is effectively a one-stop shop for checking your portfolio’s vitals.

The five key metrics at the top of the chart (value, gain, income return, currency gain and total return) are now clickable — clicking each will display a chart for that specific metric.

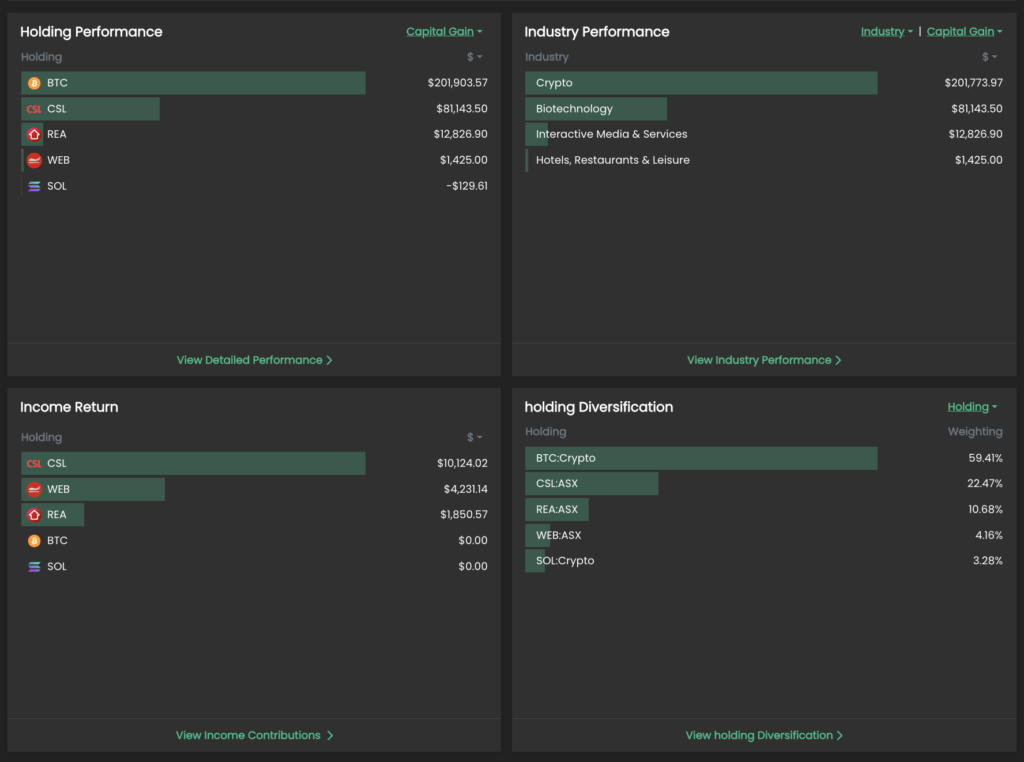
Below the chart, you’ll find four bar chart panels.

Clockwise from top left:

Holding Performance: A list of the top performing holdings in the portfolio.

Category Performance: A list of the top performing sectors in the portfolio.

Diversification: Select from holding, exchange, sector, industry and currency to view the portfolio’s diversification.

Income Return: A list of the highest income-earning holdings in the portfolio.

The first three panels all have clickable dropdown menus. You can customize what they show, like return, value, dollar or percentage.

This screen lets you both understand your portfolio performance at a glance, and allows you to drill down into greater detail. Just click the bottom of each panel to access the corresponding report based on your settings.

New: Filtering System

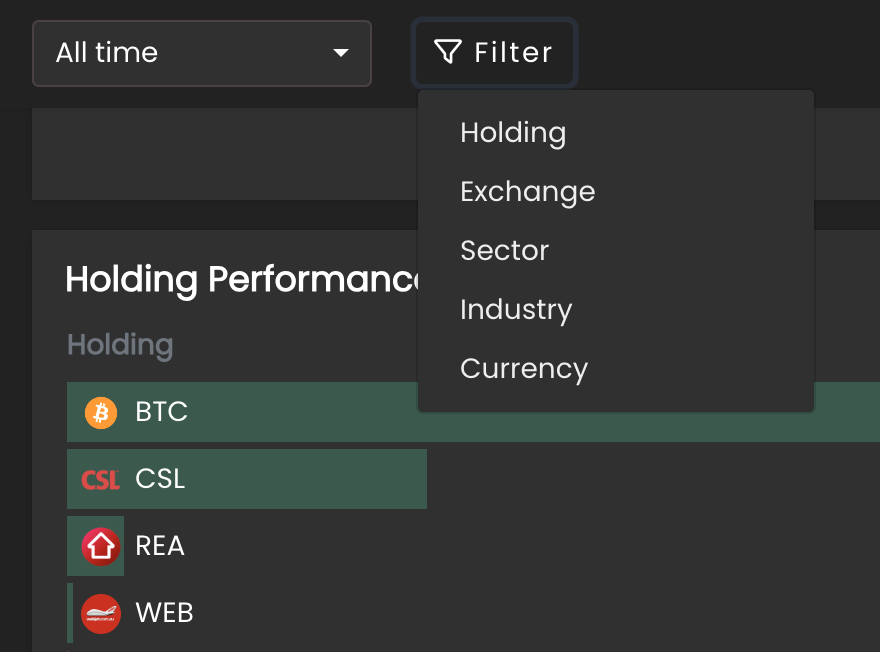
A key tool in Navexa 3.0 is the filter system.

This small, but powerful, tool allows you to ‘filter’ what you view throughout your account.

Click it and select from the dropdown (holding, exchange, sector, industry, currency). This will prompt you to make a selection.

Once you choose your filter, your account will reload, and all the charts, metrics and reports will apply only to your selection.

Note: Your filter selection remains as you move throughout your account — you’ll see it above the chart, and can click the ‘X’ to remove it and revert to an unfiltered view.

New: Benchmark Analysis

You’ve long since been able to choose your portfolio performance benchmark in Navexa.

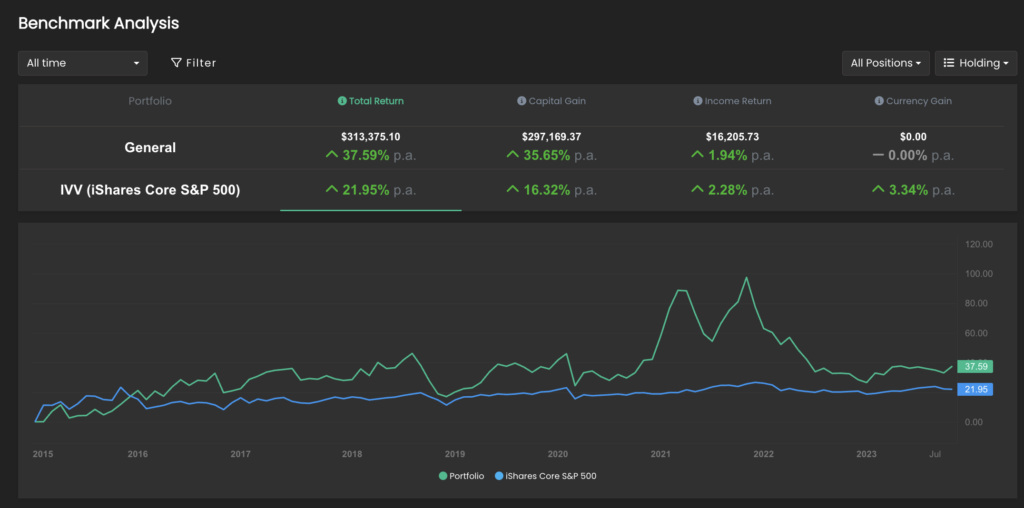
But whereas previously, this was a simple addition to the main portfolio performance chart, we’ve now created a new Benchmark Analysis page:

Like the Overview screen, the Benchmark Analysis chart features clickable metrics along the top. Click each to view the corresponding performance chart and benchmark chart together.

You can edit the benchmark both on this page and on both the Overview and Portfolio screens.

Below the chart, you’ll find two panels with bar charts:

These display which holdings (or sectors, exchanges, currencies, or industries) are overperforming and underperforming relative to your selected benchmark.

New: Income Calendar

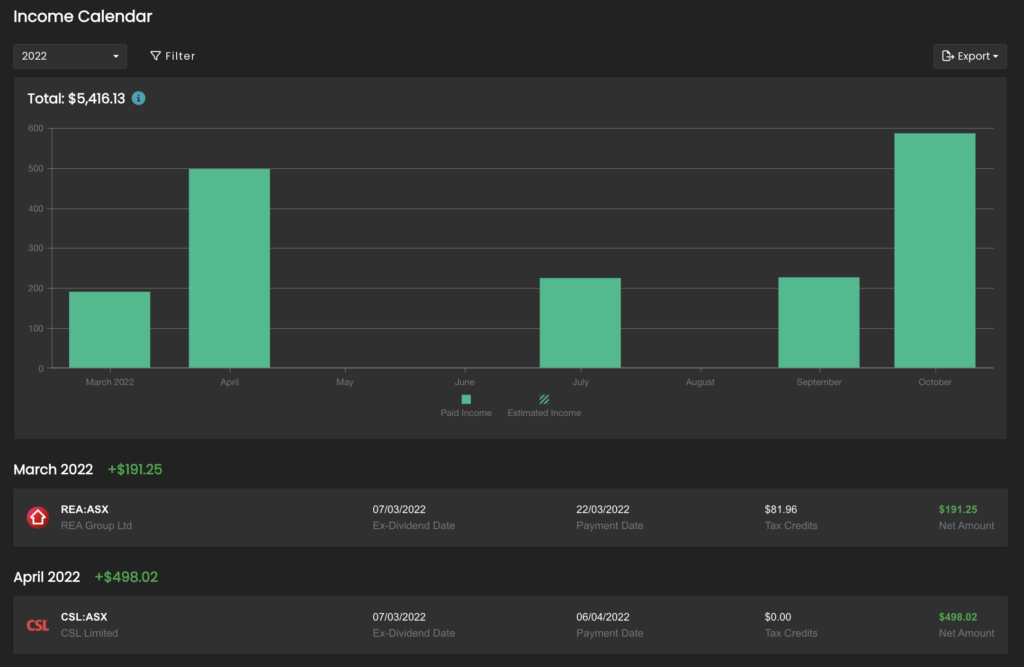
We have another cool new tool for you — the Income Calendar.

Where previously Navexa could only forecast confirmed upcoming dividends, the new Income Calendar lets you estimate portfolio income 12 months in advance.

The solid coloured bars represent confirmed income, and the shaded bars represent predicted, or forecast, income.

Navexa calculated the predicted income based on the previous year’s earnings.

Below the chart, you’ll see a list of holdings and income ordered by date.

More New Stuff: Charts, cash account options & more!

We have left no stone unturned in this latest big upgrade.

You’ll also now find a Sankey chart for analyzing your portfolio income, the option to rename cash accounts, a slew of UX improvements (like labelling, and switching between showing open or closed positions).

Navexa 3.0 is live now — start tracking today!

Ready to start tracking and analyzing your portfolio?

Start tracking with Navexa today.

Go here to get started!

Categories
The Data-Driven Investor

TDDI #008: I was overexposed and didn’t even know it

As a 24-year-old, who’d just started investing, I was excited.

I wanted to put my hard-earned money to work.

I wanted to make money while I slept.

I wanted to invest as much as I could.

But…

I didn’t really know what I was doing.

I was jumping between individual stocks.

Buying ETFs.

And trying to build a ‘diversified’ portfolio.

But without knowing it, I was concentrating my risk.

I was not as nearly as diversified as I thought.

How could this be?

I owned several different stocks.

A few different ETFs.

But, my naive 24-year-old brain was missing something about my investments .

I had a big overlap problem

I bought some blue chip stocks.

Then I bought a financial sector ETF.

Then an index tracking ETF.

But what I didn’t realize is that some of the same stocks were in all three of these.

The index tracker was top heavy with banks.

The financial sector ETF had those same banks in it.

And I had also bought those banks again individually.

Did I really want to be so exposed to the banking sector?

Absolutely not!

But this is a common situation I have found when talking with passive investors.

Often, they don’t actually know what is inside the ETF they have bought.

By the time you buy a bunch of them thinking you are diversifying…

You end up like I did.

So how does an investor avoid this?

Know your ETF

When buying an ETF, do your research and find the list of stocks that are inside it.

From here it becomes pretty obvious if you are going to have an overlap problem or not.

For example, if you own a lot of Apple shares and the ETF you want to buy has a position in Apple as well, you need to decide if that is what you want.

And depending on your strategy, you may be perfectly happy with that.

But the point is, you need to know that this overlap exists.

Build your knowledge, build your portfolio

Back when I started investing I clearly didn’t have enough knowledge.

And look what happened.

I ended up concentrating my risk into a few stocks by mistake.

Losing money because that particular sector didn’t move much.

All the while, thinking I was diversified across the market.

Even though I harp on about strategies a lot…

This issue can still crop up even with the best of strategies.

The key here is building your investment knowledge.

Be aware of what you are buying.

Things on the surface can look great.

But diversifying is not always as easy as just buying ETFs.

Knowledge pays the best dividends,

Navarre

The Data-Driven Investor

Categories
The Data-Driven Investor

TDDI #007: Love It Or Hate It (Just Don’t Overpay It)

There is an element to investing that people try to ignore.

It’s not fun.

It’s not sexy.

And it involves you losing a chunk of your hard earned investment gains.

Of course, I’m talking about tax.

I’m yet to meet a person who loves this aspect of investing.

Except maybe my accountant.

Yet, this is an area that you can not ignore.

I personally have ended up paying the government much more than was legally required.

Why? Because I didn’t like thinking about tax.

I didn’t want to know.

I didn’t optimize my investments for tax outcomes.

And, I paid for my wilful ignorance. 

If you’re investing, here’s what you must understand about taxation. 

Play a game of pass the parcel

In many countries, you have to pay capital gains tax when selling a stock.

This is a portion of the profit you make from the sale.

This is calculated by using the cost base of the holding and subtracting the gain by the cost base.

E.g. You buy some shares for $1000 (cost base) and sell them for $1500, you have made a $500 gain.

But what happens when you have bought the same stock multiple times (parcels), then sell some of it?

You get to choose a CGT strategy for calculating the gain/loss.

This can have a significant effect on what the end gain works out to be.

Let’s look at an example:

  • I buy 100 shares of Stock ABC for $3 = $300
  • I buy 100 shares of Stock ABC for $5 = $500
  • I buy 100 shares of Stock ABC for $6 = $600

So all up I own 300 shares of stock ABC.

What happens if I sell 100 shares for $5 a share for a total of $500?

I could use the FIFO (first in, first out) strategy — I  sell the first shares I bought.

So that makes the cost base $300 and the sale $500 — a $200 gain.

I could use the LIFO (last in, first out) strategy — I sell the last shares I bought. 

This makes a cost base of $600 and the sale of $500— a $-100 loss.

There are other strategies, too. 

But you can see from this simple example how you can go from owing tax, to owning nothing.

And if all the CGT strategy options still result in a gain, there’s still moves you can make to mitigate. 

Turn a loss into a tax gain

When you pay capital gains tax, you pay it as a total of your entire portfolio.

Which means if you make a gain on one stock, you can cancel it out with a loss from another.

This is  tax loss harvesting.

Tax loss harvesting is a strategy that involves selling stocks at a loss to offset a capital gains tax liability, thereby optimizing your after-tax returns.

This concept is powerful enough to potentially kill an investment tax obligation. 

Tax Knowledge Pays Dividends

Even with just this basic investment tax knowledge, you can potentially save a lot of money.

There’s no excuse for not knowing how investment taxes work.

If I had known these tax basics when I started, I might have kept a lot more of my gains.

So before you do your next tax return, have a think about which CGT strategy you are using.

If you are an Australian tax resident and it starts getting hectic calculating cost bases and keeping track of parcels, remember we help with that.

Check out Navexa now.

As always, knowledge pays the best dividends.

Navarre

Categories
The Data-Driven Investor

TDDI #6: My Controversial Opinion On Diversity (In Index Funds)TDDI #6:

A lot of people talk about buying index tracking ETFs.

Finfluencers.

Gurus.

Friends.

Even Warren Buffett has promoted index tracking ETFs.

The idea behind this is that you get decent diversification relatively easily.

As we learn early in our investing careers, diversification is a good thing, right?

Right?

Well, it depends on how you define diversification.

Is it owning multiple stocks?

Is it owning multiple stocks across different industries?

Do these stocks need to be of equal value in your portfolio?

Do these stocks need to be from different countries?

There are many different ways to diversify.

Note: Absolutely none of what follows should be considered financial advice — merely a personal investigation into the numbers behind diversification. 

Don’t Underestimate Big Companies’ Dominance 

The ASX200 index covers the top 200 companies listed on the ASX.

And there are many ETFs out there that track this index.

Buying into one of these would give you broad diversification in terms of number of companies.

But how diverse is the ASX200 really?

With a little bit of digging, you will find that the top 10 stocks in the ASX200 makeup more than 50% of the index’s total market capitalization.

In other words, the ASX200 is very top heavy.

BHP is the number one stock in the index, with a market cap of ~$200 billion.

Compare that to the 200th stock in the index, with a market cap of $1 billion.

This means if BHP has a bad year, it can significantly impact the whole index.

So what does this look like in a real portfolio?

Meet The ASX10 Big Heavyweights

Let’s take a look at a theoretical portfolio made up of the top 10 ASX stocks in 2018.

Let’s call it the ASX10.

In the past five years, the ASX10 has outperformed the ASX200 index.

With capital gains and dividends included, the ASX10 achieved a return of 12.45% p.a. — outperforming the ASX200’s return of 9.81% p.a.

You can see from the chart that the movements were almost identical the whole way through.

But the ASX200 had 190 other companies influencing its overall performance.

So while you get diversification from an ASX200 index fund, is it the kind of diversification you want?

It Pays To Know What Comprises Index ETFs

To be clear, I’m not saying investors shouldn’t buy index funds. 

If it’s between doing nothing with their money or investing at all, then index funds might be a great idea.

They do, after all, track the performance of an index — most of which, over the long term, tend to go up. 

But for those of us who pay closer attention to what we’re investing our money in…

And those — like me — who unashamedly ‘nerd out’ on every detail of our investments…

It’s worth noting that there can sometimes be hidden costs — or rather opportunity costs — to simply buying an index fund versus investing in a particular cohort of companies. 

Diversity has become one of those pieces of financial jargon people perhaps automatically presume to be admirable. 

But, as I like to say, the numbers never lie. 

Always do your own research — this is not advice and always remember that past returns are never a guide for future performance.

Knowledge pays the best interest,

Navarre

The Data-Driven Investor

Categories
The Data-Driven Investor

TDDI #005: Dead Investors are doing better than you!

What makes you a good investor?

Is it because you make great decisions?

You have the most knowledge?

A killer strategy?

What if I told you that, even if you had all three of these, you may not be doing as well as investors who are…

Dead.

Dead investors can’t make any decisions.

They know nothing.

Strategy? Unlikely, six feet under. 

Let me explain. 

According to a mythical study by Fidelity widely referenced in the investing world, but never confirmed, the broker’s best performing client accounts belonged to people who had either died, or had forgotten they had an account.

So, what can we learn from the dead?

Trading is hazardous to your wealth

For those of us with a heartbeat, we tend to be less than perfect in our investing.

We:

  • Are impatient
  • Make emotional decisions
  • Let ego dictate our moves

This means we trade more. 

100% more than the dead. 

With each trade, we lose money to trading fees.

We pay taxes on gains.

We realize losses.

Increased trading activity often contributes to poor investment performance.

Become an expert at feigning lifelessness

If the dead are good at one thing, it’s being patient.

You could say they are the ultimate passive investors.

When Warren Buffett says his ideal holding period is forever, then the dead are *cough* living that ideal. 

When you buy into an entire market, or sector of the market through ETFs — and then do nothing — you’re emulating a dead investor.

You sit back and get rich slowly.

This mythical Fidelity study proves — on a long enough timeline, at least — this strategy is highly effective.

Inaction can be a super power

Society has always praised people for taking action.

It’s also one of the things I pride myself on.

But when it comes to investing, inaction is often more powerful.

Not making emotional decisions.

Not FOMOing in and out of positions because of the news.

These things sound simple to avoid.

But they’re easy to fall for.

Don’t get me wrong, complete inaction, is not good.

Afterall, you have to take action at some point to invest in anything.

But, making calm and calculated decisions is usually best.

We can learn a lot from Fidelity’s mythical dead (or just inactive) investors.

Reducing trading activity saves on fees, taxes and realized losses.

Time in the market, as the saying goes, generates more value than timing the market.

Knowledge pays the best interest,

Navarre

The Data-Driven Investor

Categories
The Data-Driven Investor

TDDI #004: Rome Wasn’t Destroyed In A Day

My name is Maximus Decimus Meridius, commander of the Armies of the North, General of the Felix Legions and loyal servant to the true emperor, Marcus Aurelius

Citizen of a failing currency, Victim of a collapsing economy’.

That’s not how the protagonist in Ridley Scott’s 2001 blockbuster Gladiator announces himself to his arch-enemy. 

But, it could have been.

Allow me to give you a quick lesson in ancient history.

This puts the present-day ‘war on inflation’ that’s dominating the markets and financial newscycle into perspective. 

Then, I’ll show you how misquoting Russel Crowe connects with my personal investment philosophy. 

Inflation: We’ve Been Here Before

When it first entered circulation, the Roman Denarius coin contained about 4.5 grams of pure silver.

This enabled the vast empire’s citizens and organizations to do business, receive payment for goods and services, and store wealth for the future.

The coins had value because the silver in them was scarce.

So scarce, in fact, that as the years went by, Rome started to run out of silver with which to make its coins.

So they started minting more coins with less silver in them.

Over a century, the Denarius went from containing 75% pure silver to just 5%.

The government printed more and more of them with the same face value, but less and less of the precious metal that gave them value in the first place.

This created the illusion of more money in the system. But the reality was that Rome’s debasement of its currency transferred wealth away from citizens and resulted in them having to use more and more coins.

The other word for this is inflation.

Rome effectively robbed its citizens of their power to exchange and store wealth.

This drove hyperinflation, produced soaring tax rates, and created worthless money, plunging the empire towards its demise. 

The Dollar’s Diminishing Power

If ancient Rome was a lesson, it appears as though civilization hasn’t taken it on board. 

In the first decade of the 20th Century, the total amount of money in circulation in the U.S. was about $7 billion.

One dollar could buy you a pair of brand new patent leather shoes.

By the 1950s, there was $151 billion circulating.

A dollar couldn’t buy you a pair of patent leather shoes. It could buy a Mr. Potato Head toy.

Fast-forward to the 1980s and there were nearly $1.6 trillion dollars in the financial system.

The dollar could now get you just a single bottle of Heinz ketchup.

In the first decade of the new millennium, the money supply ballooned up to nearly $5 trillion.

Now, the dollar could only buy a Wendy’s hamburger.

By 2017, the money supply had grown to more than $13 trillion — almost five times what it was at the turn of the millennium.

And that single dollar that could buy you a brand new pair of patent leather shoes more than a century ago?

It now buys only a single song on iTunes.

See the pattern? More money does not equal more wealth. 

Why We Invest

I talk to friends and family about wealth as often as I can. 

(And yes, I watch Gladiator on a regular basis. Are you not entertained?!)

I believe open and frank conversations are key to building financial literacy. 

And I believe financial literacy is crucial for creating financial freedom. 

Historical facts like those above are central to why I invest — rather than simply leave my money in the bank. 

Yes, you could argue there’s more risk associated with owning things other than cash.

But, when you consider inflation’s long history of insidious wealth destruction, I’d argue it’s wise to understand the difference between money and actual wealth. 

Knowledge pays the best interest,

Navarre

The Data-Driven Investor

Categories
The Data-Driven Investor

TDDI #003: Is The Market Efficient, Or Random?

There are people who believe the earth is flat. 

There are others who believe we’re living in a computer simulation. 

Or that a hidden race of Lizard People are running society from the shadows. 

There’s a whole lot of different ways to make sense of the world we live in. 

The same goes for the financial markets. 

There are those who believe in the so-called ‘50% Principle’ — that any uptrend must correct by 50% before resuming its rise.

Others prefer ‘Odd Lot Theory’. 

This is the idea that when smaller investors sell out of something, it’s because they’re wrong, and it’s therefore a good time to buy.

I know of one allegedly very wealthy investor who believes every financial market on the planet — property, stocks, commodities, you name it — moves in a repeating cycle, in which prices rise for a certain number of years, then fall for a certain number of years.

In today’s newsletter, though, I want to introduce and compare two of the less far out — and more influential — theories about the market. 

100% Efficient? 100% Of The Time? 

Efficient Market Hypothesis (EMH) claims that the price of any investment reflects everything the market knows about it at any given time. 

In other words, the market ‘prices in’ all available information about an asset.

Because of this, it’s impossible to ‘beat the market’, as the market already knows everything you could know.

The market is, in this theory, all seeing and all knowing. 

EMH is more than a century old and is most often attached to American economist Eugene Fama.

It’s crucial to understand that in Fama’s EMH, he’s talking about whether one can beat the market without taking on any extra risk

Anyone who beats the market’s returns can only do so by taking on additional risk.

Many investors, of course, aren’t keen to do this — which is possibly why there’s been such an appetite for passive ETF investing in the past few years.

EMH believers believe in keeping investment costs low and not bothering trying to outperform the perfectly priced market. 

Opponents, on the other hand, believe you can. Even without taking on additional risk.

Why?

Because the market is NOT perfectly efficient. Prices do deviate from their fair, or intrinsic, values. 

Enter the next theory of how the markets work. 

The Market Is A Drunk Man. 

In 1828, Scottish botanist Robert Brown dropped grains of pollen in water.

He observed that, suspended in the water, the pollen moved in a rapid, and random, oscillatory motion. 

About 70 years later, French mathematician Jules Regnault found that the longer you held a stock, the more it deviated from the price you paid for it. 

These two experiments form the bases of Random Walk Theory. 

This theory posits that asset prices change at random. Past prices are of little use in predicting future ones. 

And, to make our lives even tougher as investors, the market being the efficient (in theory) animal that it is, prices in all available information to these ‘random walks’. 

Economist Burton Malkiel popularized this theory in 1973 with his book A Random Walk Down Wall Street.

He called stock price movements the ‘steps of a drunk man’.

Random, unpredictable, unreliable. 

Random Walk Theory is another view of the market that leads followers to believe that it is impossible to predict or outperform the market. 

At least, not without taking on any extra risk. 

What Do I Think?

I personally believe the market is not 100% efficient. 

I believe it is quite efficient, but there is always room for improvement.

As a value investor, I believe at any given time there are stocks that are over and under their ‘true’ value. 

As the legend Warren Buffett says, ‘in the short run, the market is a voting machine but in the long run it is a weighing machine’.

And as John Maynard Keynes said — the market doesn’t reward investors for being smarter than it…

It rewards them for taking risk. 

More on that in a future edition. 

Knowledge pays the best interest,

Navarre

The Data-Driven Investor

Categories
The Data-Driven Investor

TDDI #002: Investing Stops Being Scary When You Have This

Are you freaking out about your investments right now?

Compulsively checking your phone…

Pacing the room…

Doom-scrolling endless headlines about bank collapses and inflation rates…

Even — God forbid — considering selling all your investments and waiting for things to calm down?

If that’s you, chances are you don’t have something that separates the great investors from the vast swathes of the mediocre (and worse). 

This thing is free and widely available. 

And yet, too few of us understand its importance and value. 

While the panicked and fearful don’t choose it, use it and benefit from it…

The calm and confident are reaping its rewards right now. 

I’m talking about strategy

Investment strategy helps you eliminate emotional decisions and gives you freedom from stress.

Well, relative freedom, shall we say — compared with those who buy and sell based on emotion, for example. 

Here are three problems you’ll solve by employing a clear investment strategy.

1. Emotional decisions = emotional reactions

Back when I started investing, I had no idea what I was doing.

I remember buying into investments, only to sell out of them within a couple of weeks.

(And paying trading fees both ways…)

I’d get ‘tips’ from colleagues at work, or ‘ideas’ from online forums.

Ultimately, I couldn’t hold on to anything long term. Because I would freak out and sell. Because I didn’t know why I’d bought in the first place, basically. Because I had no strategy guiding my decision making. 

But once I had a strategy, this completely changed.

Because now it wasn’t up to my emotions whether I should sell a stock or not. 

It was up to the strategy I had selected — and the criteria for decision-making that commits me to.

Did it meet the criteria for selling? Then I sell.

Otherwise, I’m holding on for the ride.

With my strategy, I don’t worry about such decisions.

I chose my strategy so it can guide my shorter-term decisions.

Choosing a strategy is another subject which I’ll dive into in a later newsletter.

2. Bad Moves, Made For Bad Reasons

The next thing that a strategy helps with is helping you choose the right investments.

It doesn’t matter when you buy or sell if the company you bought into is no good.

Think about these two questions.

Buy the stock because a friend told you it was a good idea?

Or…

Buy because you have a set process that you filter any investment through?

Which do you think will lead to the better outcome?

Having a strategy that helps determine what you buy is crucial.

That way, you can constantly improve your strategy, based on set criteria, rather than making it up as you go along.

3. To Be Underprepared Is To Risk Underperformance

Ultimately we all want good performance from our investments.

We want our money working hard for us while we sleep.

As with anything in life, not having a plan, is planning to fail.

Having a strategy helps keep you on the right path.

Even if that path turns out to be the wrong one, having a consistent strategy helps you figure that out fast.

Which means you can then pivot to one that works better for you.

This means you can achieve optimal performance as quickly as possible.

If you have no strategy, you may never figure this out.

To sum up…

Strategy & Success Go Hand In Hand

Choosing and committing to a clear investment strategy will:

  • Reduce/remove stress
  • Help eliminate emotional decision making
  • Help you choose better investments
  • Help improve your investment performance

Find a strategy that works for you.

There’s quite a few out there. You’ll know the one for you when you find it (and especially when you start seeing the results).

From there, you can rest easier about your investments, knowing you’re investing according to a plan.

Knowledge pays the best interest,

Navarre

The Data-Driven Investor