July 22, 2024
‘Cynical bastard’ exposes Wall St. excesses
Dear Reader,
Shortly after his book Liar’s Poker came out in 1989, Michael Lewis took his seat on a flight to the US.
He was travelling to begin the book tour, and he intended to spend the flight re-reading his part-biographical, part-journalistic, dive into the wild world of Wall Street bond trading in the 1980s.
Within seconds of pulling the book out of his carry-on, the passenger next to him turned and spoke:
‘I’ve read that book,’ he said.
Lewis went to answer, but before he could:
‘Cynical bastard!’
This was a seven-hour flight. A long seven-hour flight.
This would not be the first time Michael Lewis published something that exposed aspects of the investing world which provoked reaction.
From the history of art to the mystery of money
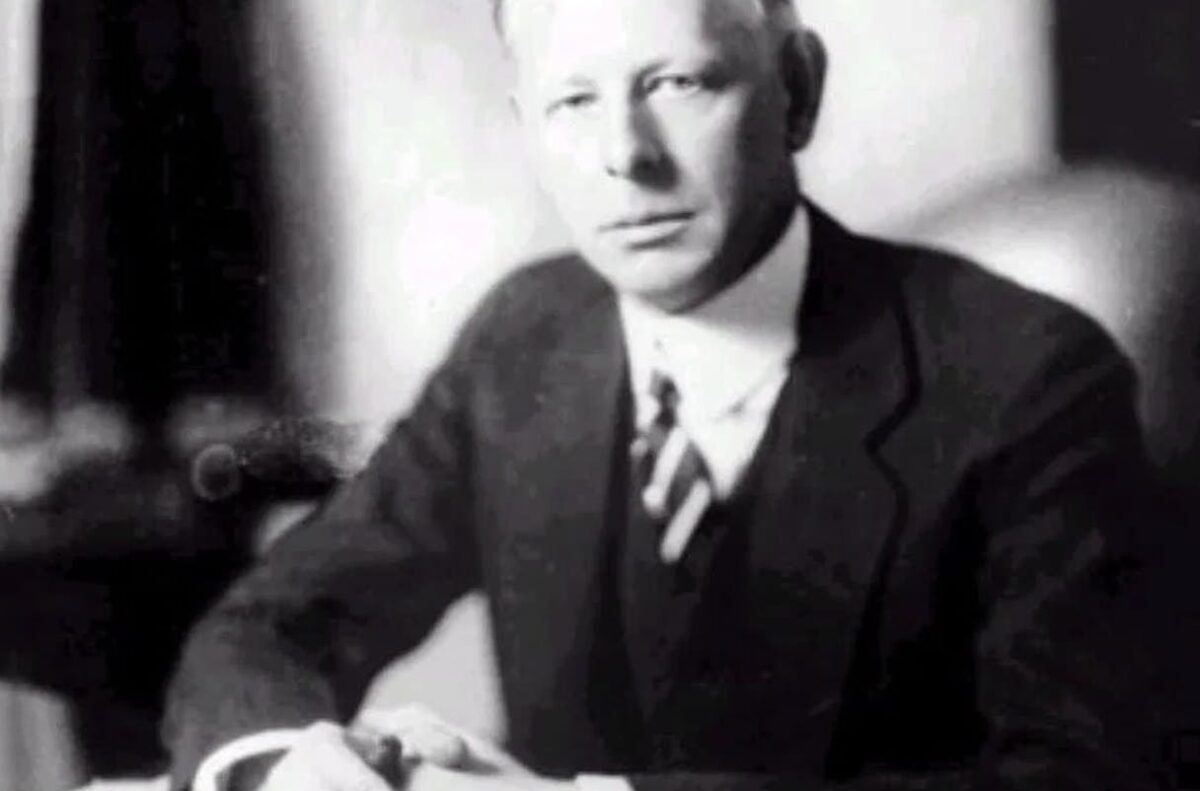
Michael Lewis in his office (source)
Michael Lewis wanted to be an art historian.
He graduated from Princeton University having written a 166-page thesis on Italian Renaissance sculptor Donatello, and promptly realized that not only where there few jobs for art historians, but that the few available paid poorly.
He did a 180.
He enrolled at the London School of Economics and earned an MA in economics, then landeda role at the legendary Salomon Brothers investment bank in New York, and then in London.
It was this experience, on the cutthroat trading floors of the 1980s, that led Lewis back to the arts.
As he learned the trading game and navigated the ruthless, opaque hierarchy of what was at that time one of the world’s most influential investment banks, Lewis read The Economist and the Wall Street Journal.
He began to write. But rather than copy the somewhat dry, professional style of the writers he admired…
Lewis chose to explore Wall Street economics and culture through people.
‘If you can attach the reader to a person,’ Lewis says, ‘they’ll follow that person anywhere‘.
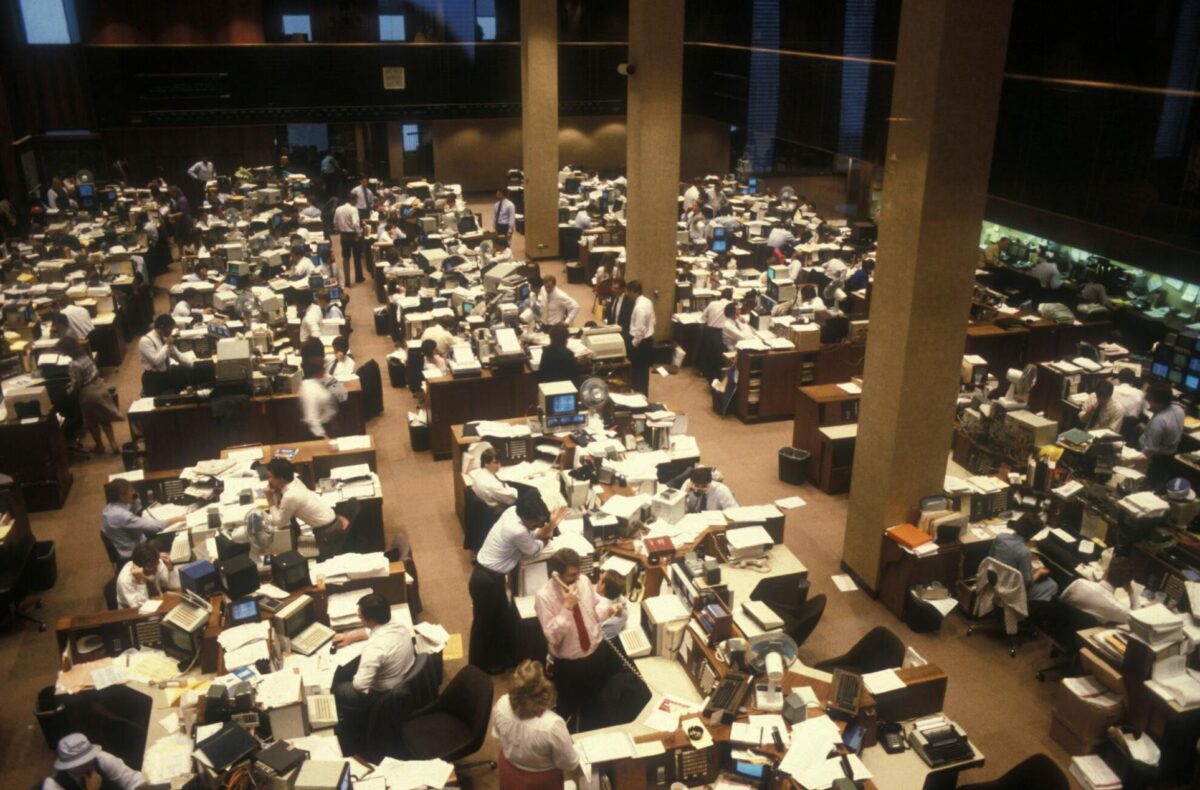
Liar’s Poker: Rising Through
the Wreckage on Wall Street
Salomon Brothers trading floor in 1986 (source)
Full disclosure here — I’ve not finished reading Liar’s Poker yet. I’m a few chapters in. But I can tell you now I will 100% finish it. It’s that good.
This book is to investment banking what Anthony Bourdain’s Kitchen Confidential is to the restaurant and fine dining industry; a gritty insight more concerned with truth than protecting people’s reputations.
Here’s a selection of revelations Lewis makes from his time rising at Salomon Brothers.
On the ‘zero sum game’ of trading:
‘If there was a single lesson I took away from Salomon Brothers, it is that rarely do all parties win. The nature of the game is zero sum. A dollar out of my customer’s pocket was a dollar in ours, and vice versa.’
On how traders see themselves as kings of the financial jungle:
‘Corporate finance, which services the corporations and governments that borrow money, and that are known as clients, is, by comparison, a refined and unworldly place. Because they don’t risk money, corporate financiers are considered wimps by traders.’
On the lack of correlation between skill and earnings:
‘That was somewhere near the middle of a modern gold rush. Never before have so many unskilled twenty-four-year-olds made so much money in so little time as we did this decade in New York and London.’
You get a sense, even from these few excerpts, of the hubris and arrogance to which Lewis was exposed (and, as he admits, participated in and profited from).
Salomon Brothers no longer exists.
CEO John Gutfreund left in 1991 facing a $100,000 fine from the SEC and being barred from holding a CEO role of a brokerage firm.
Why?
Ryan Gosling in the film adaptation of Lewis’ later Wall Street book, The Big Short. (source)
The bank became embroiled in a scandal involving illegal treasury bond auction manipulation.
Several of its traders had submitted false bids to the Treasury Department in order to gain an unfair advantage.
The scandal shattered the bank’s reputation.
Salomon Brothers was eventually acquired, then merged into Citicorp, and now no longer exists.
There was, believe it or not, a brief period post-Gutfreund in which Warren Buffett held the CEO position.
Michael Lewis called time on his bond trading career at the bank in 1988, and began writing about his experiences.
One wonders whether the man sitting next to him on the trans-Atlantic flight perhaps worked on Wall Street himself, or perhaps even had some connection to Gutfreund, who told Lewis later in life:
‘Your fucking book destroyed my career, and it made yours.’
Feedback: Appreciated
Over the past couple of weeks, I’ve received a stack of emails from readers letting me know how much they’re The Benchmark.
Thank you.
I try to write an investing email that I would enjoy reading.
So I’m stoked to hear you enjoy reading The Benchmark.
As I said to one Chief Investment Officer who wrote me last week; please feel free to send through any ideas or stories you’d like me to write about.
Quote of the week
‘A man who can tell a good story can make a good living as a broker.’
— Michael Lewis, Liar’s Poker
That’s it for this week’s The Benchmark email.
Forward this to anyone you know who enjoys growing their investing knowledge.
If someone forwarded this to you, subscribe here.
Invest in knowledge,
Thom
Editor, The Benchmark
Unsubscribe · Preferences
All information contained in The Benchmark and on navexa.io is for education and informational purposes only. It is not intended as a substitute for professional financial or tax advice. The Benchmark and any contributors to The Benchmark are not financial professionals, and are not aware of your personal financial circumstances.