Categories
Financial Literacy Investing

The Zig Zag Indicator Formula — What It Is And How To Calculate It

Understanding a stock’s trend is a vital part of trading, and a key focus for technical analysis. This post explains what the zig zag indicator formula is and shows you the basics of how to calculate and use it to identify price trends.

The zig zag indicator is a basic technical analysis tool you can use to determine whether a stock is trending up or down.

This indicator is one of the more simple tools used in technical analysis — the discipline of analyzing charts to make predictions on future price movements.

In this post, we’ll explain:

·     How the zig zag indicator works to identify price trends

·     How to calculate the formula

·     The potential benefits

·     Some potential limitations

Plus, we’ll share some examples of technical analysis using the zig zag formula, and other key data you should be looking at for both individual stocks you own and your portfolio as a whole.

This post will give you a good overview of the zig zag indicator and how you can use it to better understand and determine price movement.

It is not intended as financial advice, and we always recommend you do your own research and/or consult with a financial professional before risking your money on an investment. 

What Is The Zig Zag Indicator And How Does It Work

The zig zag indicator is part of the discipline of technical analysis.

Technical analysis involves interpreting historical data about a security from its price chart in an attempt to determine a pattern, which in turn might give you an idea of where the price is likely to go next.

Traders use the zig zag indicator specifically to eliminate the ‘noise’ of day-to-day market conditions and price movement, and get a clear picture of whether a security’s trend is reversing.

The zig zag indicator allows you to make points on a price chart wherever the price reverses by more than a given percentage. The most common percentage threshold for selecting these points is 5%.

So for every instance on a chart where the price shifts from either down to up, or up to down, by more than 5%, you make a point.

Once you’ve found all the points that qualify on the chart you’re looking at, you draw lines between each adjacent point.

Take a look at an example.
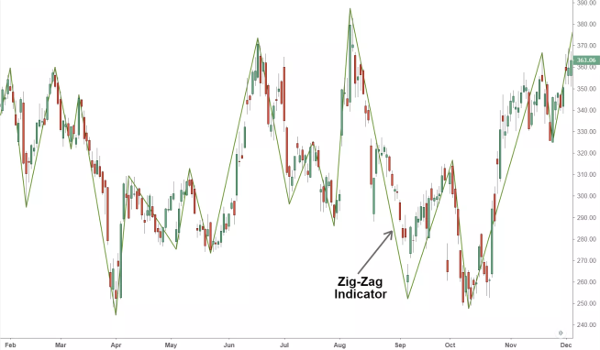
zig zag indicator formula
Source: TradingView

The zig zag pattern this creates shows you all the significant changes in trend on the price chart.

By showing you only the trend reversals greater than 5%, the indicator helps you to focus only on the significant ones (which may be useful to you in predicting the next likely trend change) and not on the smaller, less consequential fluctuations.

These significant turning points are known as swing highs and swing lows.

It’s important to know that the zig zag indicator cannot predict future price trends or price movement. Advanced traders use the indicator with both Elliot Waves and Fibonacci projections in predicting likely future price movement.

For the everyday investor, however, this indicator can still be a useful tool in getting a clearer picture of a stock’s past behaviour, volatility and support or resistance levels.

How To Calculate The Zig Zag Indicator For A Stock

Calculating your zig zag indicator is simple.

First, select a starting point. Looking at a historical price chart, you’ll need to determine how far back you want to analyze. Choose a swing high or swing low.

Then, decide which percentage of price movement you want to set as your threshold. Most zig zag analyses use 5%.

Once you’ve set the percentage, find the next swing high or swing low that qualifies by being over that amount relative to the starting point and mark it on the chart.

Draw a trend line (the zig zag line) between the two. Then repeat the process from this new point to the next one.

Remember to calculate the percentage change relative to the previous point.

Repeat this process until the last swing high or swing low on your chart.

Once you’ve completed the process, you’ll see something similar to this:
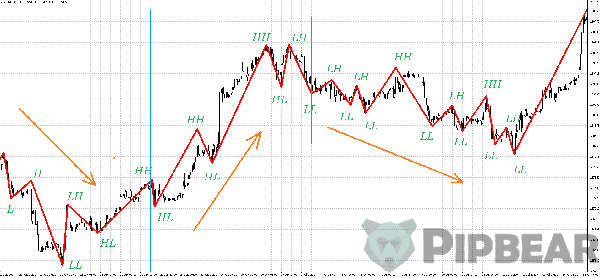
zig zag indicator formula

Now, you can see the significant swings in the stock’s price — not every single change.

At the right hand side of the chart above, you can see the trend line continues right to the Y axis.

If this chart were up to date, you’d be able to confidently say the stock was currently trending upwards.

You could continue analyzing it day to day — or hour to hour if you’re an active trader — until you identified the next swing high or swing low point, allowing you to potentially exit a trade before the price fell further.

Zig zag Indicator Main Points

  • Calculate the points at which the price reverses by more than a minimum percentage.
  • Rule straight lines between each adjacent point.
  • Add further trend lines and analyses overlays to augment the zig zag indicator with other technical trading tools.

More Examples Of Stocks Analyzed With The Zig Zag Indicator

Overlaying the zig zag indicator onto a price chart helps you to see more simple trends and patterns in what can be confusing collections of noisy information.

Finding the points and plotting the zig zag between them is only part of the process for many traders, though.

Take a look at this chart: 
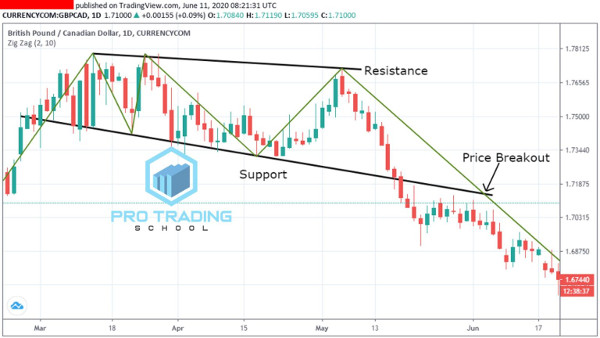
zig zag indicator formula

You can see the zig zag line in green. And you can see two more lines, in black.

The trader here has drawn these by ruling along the upper and lower points on the chart.

These black lines show resistance and support levels. Resistance and support are central ideas in technical analysis and trading.

Resistance is the price at which an uptrending stock is will likely pause before breaking through due to supply levels. Support, on the other hand is the opposite — the price at which a downtrending stock will likely pause due to demand levels.

In other words, a stock might struggle to get beyond a certain price because many investors will sell at or near that price. Conversely, it might struggle to fall below a certain price because investors will try to buy around that price.

Moving averages and trendlines — like the zig zag indicator — are key tools traders use to determine these levels, as you can see above.

Using The Zig Zag Indicator To Spot Trends & Breakouts

Now let’s look at another example of the indicator at play in a chart.
zig zag indicator formula

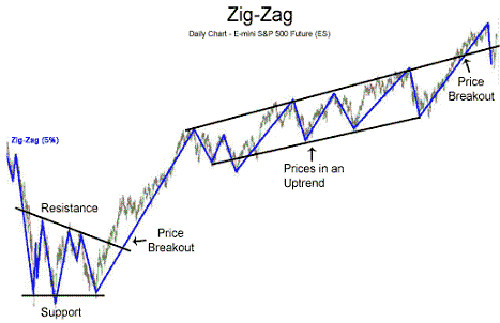
In this example, the trader has not only added support and resistance levels based on their zig zag trendline. They’ve also made notes of trends and breakouts.

When a stock price passes a support or resistance line, it can be said to be ‘breaking’ higher or lower.

You can see in the lower left part of the chart the note ‘price breakout’. This shows you where the trendline has passed the resistance line, indicating a new break higher.

After breaking higher, there’s a flurry of new swing highs and lows, which the trader has annotated with new resistance and support lines and the note ‘prices in an uptrend’.

These are just two examples of how the zig zag indicator can be useful in the technical analysis of a stock price chart.

The Benefits Of Using This Type Of Analysis In Your Investing Strategy 

The zig zag indicator has several potential benefits. But they only apply if you’re confident with using technical analysis in your investing or trading.

If you’re more of a passive investor (someone who’d rather put their money in an ETF and leave it alone for a long period), or, say, a value or fundamental investor, the zig zag indicator might not be useful to you.

Here are three potential benefits to using it:

1.   Block out noisy short-term price movements and see the significant ones: It can be easy to get caught up in every single price move a stock makes. But not every move demands you buy or sell. Even the best performing investments probably won’t go up every single day. By using the zig zag indicator, you can focus on the meaningful swing highs and lows — the points at which the price really changes direction, rather than just fluctuating as a result of regular trading.

2.   Pair it with other analyses: As you can see in the charts above, using other technical analyses tools allows you to leverage the indicator further. You can see resistance and support levels, and get an idea of the price a stock needs to move above or below in order to break higher or lower — or trade within to remain in a trend.

3.   Zoom out and see a bigger picture: In a week, a stock might have several swing highs and swing lows. But paired with resistance and support lines, plus other more advanced technical analysis tools like Fibonacci levels, you can use the indicator to get an idea of a stocks longer term patterns and trends.

There are many types of trading strategies that may benefit by employing the zig zag indicator — especially swing and momentum trading.

Why You Should Use Caution Before Deciding To Invest In A Company Based On Zig Zag Indicator Analysis

Like any trading strategy or stock analysis tool, the zig zag indicator is not going to give you any guarantees regarding the likely success of an investment.

It’s a trend following indicator. That means it works on historical data. And while it’s a very useful tool in analyzing past price action, it’s never going to predict what a stock might do next.

In this respect, it’s more of a confirmation tool — albeit a very illustrative and educational one.

If you’re using the indicator in your own investing, be sure to pair it with other forms of analysis and research. And, of course, always be aware that no matter what a trend following indicator — or historical price action — might suggest, you do always risk losing money when you invest it.

Additional Resources Available Online About The Zig Zag Indicator

There’s plenty of good resources about the indicator online to help you learn more.

Here’s a detailed breakdown that explains the basics, strategies for deploying it and several examples of the indicator in use.

This page explains the parameters of the zig zag indicator, and some of the things using it can tell you about a stock’s price action and trends.

Since the indicator is a part of technical analysis, you might want to read this introduction to technical analysis itself.

Level 2 Market Data: How Traders See Market Moves Before They Happen

Imagine knowing how many traders were placing orders in a stock before those orders were fulfilled.

That’s the power of level 2 market data, which, if you’re using the zigzag indicator, or looking for a swing high and swing low in a chart, may come in handy.

We explain how to read and apply level 2 market data here.

Pro Tip: Automate Your Portfolio Performance Tracking

Whatever investment or trading strategy you use, you should always correctly track and analyze your investments’ performance.

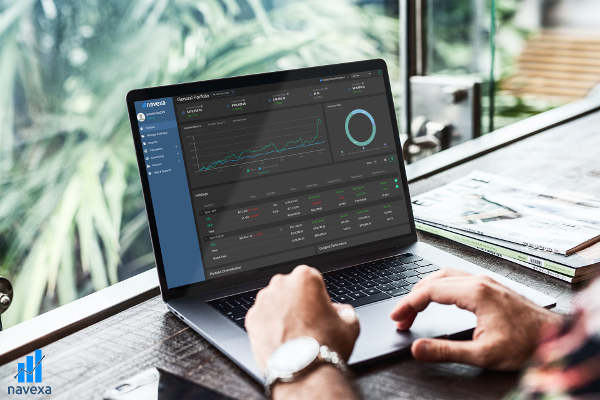
The Navexa portfolio tracker tracks stocks, ETFs, cryptocurrencies and unlisted investments together in one account.

Navexa lets you track everything together so that you can track, analyze and optimize your investment performance over time.

With a Navexa account, you’ll receive weekly and monthly email updates on how your portfolio is performing, plus powerful tax reporting tools that make recording and reporting your investment taxes quick and easy.

Plus, Navexa allows you to apply different tax strategies to your investments, meaning you can better control the amount of tax you’ll owe when you sell holdings.

You can access charts of your individual holdings and your portfolio as a whole. If you’re using the zig zag, you could apply it to your entire portfolio to identify historical trends and swings.

Plus, you can drill down on your portfolio diversification, contributions and more — giving you a greater depth of insight into how your investments are performing together and relative to each other.
Navexa portfolio tracker

Create Your Portfolio Performance Tracking Account Free Today

Whether you’re using the indicator as part of a trend following, swing trading or day trading strategy, having access to quality charting and data on your investment and portfolio performance is crucial.

You can try Navexa for free for up to 14 days when you create an account today.

Sign up, add your portfolio securely, and see your true portfolio performance using all our members-only reporting and analysis tools.

Open your Navexa account free today.

Categories
Financial Literacy Investing

Why You Must Understand Asset Allocation Models For Your Portfolio

Asset allocation is perhaps the most important concept at play in the world of portfolio management today. Learn what asset allocation is, how it applies to your portfolio, and what the best asset allocation models in the world are today.

Asset allocation is at the centre of Modern Portfolio Theory, which is the concept that any portfolio of investments can be optimized to most efficiently balance the level of risk those investments carry.

The concept underpins everything from private investment portfolios to multi-billion dollar hedge funds in the stock market.

Since Nobel Prize-winning economist, Harry Markowitz, introduced his theory of asset allocation in 1952, the idea has become synonymous with diversification.

This post explains the ideas behind asset allocation and the common wisdom on diversification.

We’ll introduce you to the biggest asset allocation models you’re likely to encounter, the different types of assets available in the markets, and the benefits of having a well-diversified portfolio.

Plus, we’ll explain how our portfolio tracker’s reporting tools can help you analyze your diversification. 

One important thing to know about asset allocation is that the ideal blend of assets depends significantly upon your age.

Generally speaking (and nothing in this post constitutes personal financial or investment advice), younger investors with a higher risk tolerance, moving towards a less risky asset allocation more in favour of fixed income as they become older.

While asset allocation is all about balancing and mitigating risks to your capital, you should always do your own research and seek professional advice before risking your capital.

What Is Asset Allocation?

Asset allocation, in its simplest form, is the composition of an investment portfolio. Specifically, it’s the relative percentages of stocks, bonds (or other fixed income investments), cash, and other assets you choose to invest in over the long term.

Most professional investors and financial advisors agree that choosing your asset classes is probably the most important decision you’ll make on your wealth building journey.

Now, that doesn’t mean choosing which stocks to invest in. Rather, asset allocation refers to the asset groups.

Modern Portfolio Theory holds that an efficiently diversified portfolio comprises a particular balance of stocks, fixed income instruments and cash.

For example, say you have a third of your portfolio in stocks, a third in bonds and a third in cash.

Low interest rates might drive stocks higher, while cash probably won’t perform so well.

But were interest rates to rise, causing the stock market to panic and stock prices to fall, the cash would start generating a better return.

Applying the strategy of your choice determines the relative extent to which you expose your capital to stocks, fixed income and cash.

Of course, within these groups, there are still many decisions to be made.

A $300,000 portfolio with equal thirds in stocks, bonds and cash could take many forms. For example, the stocks could be blue-chip, large cap companies with a strong track record of paying dividends.

Or, they could be speculative smaller or mid-cap stocks that have a chance of delivering a substantial capital gain.

Stocks have a large spectrum of risk and reward which you’ll need to consider relative to your objectives and the overall allocation.

Asset allocation

Why Do I Need To Diversify?

The reason for diversifying can be explained using the eggs & baskets analogy.

If, for example, your portfolio consists of 100% banking stocks, all your eggs are in one basket.

If there’s a financial crisis or crash, the banking sector could get hit hard, meaning your entire portfolio gets hit hard. The basket falls and breaks all the eggs in it.

But if you own a mix of stocks, for example, some technology and pharmaceutical companies alongside your financial ones (and a variety of large cap, mid-cap and small cap companies), then you’re spreading your eggs out and exposing different percentages to different markets.

Diversification is all about spreading risk between investments so that you’re not over exposed. Your risk tolerance is a function of many things, including your time horizon.

Asset allocation and diversification aim for the same objective, but they operate on different levels. Whereas diversification often refers to the mix of stocks you own, asset allocation encompasses stocks and other investment classes (like bonds and cash).

It can also extend to property, cryptocurrencies, and pretty much any other asset which you’d count as part of your overall financial position.

There are two particular types of risk to every investment; systematic and unsystematic.

Systematic risk is a broad, market-wide economic risk (think the 2008 global financial crisis).

You generally can’t protect yourself against big events like this — no matter your risk tolerance.

Unsystematic risk is specific to a country, market or individual company — this is what diversification aims to mitigate. 

How Can I Diversify?

So you know you need to spread your eggs out into different baskets, and consider your time horizon and risk appetite.

That’s the most basic principle of diversification (the two terms are commonly used interchangeably. 

The second principle to understand is negative correlation. This is the idea that a properly diversified portfolio (or sensible asset allocation) will include investments that not only don’t react the same way to economic and market events… but that react the opposite way.

The example we gave earlier about interest rates impacting equities and cash savings in different ways is an example of low or negative correlation.

In other words, a well-diversified portfolio will be more resilient and stable than a poorly-diversified one. This is the theory.

Check out this example:

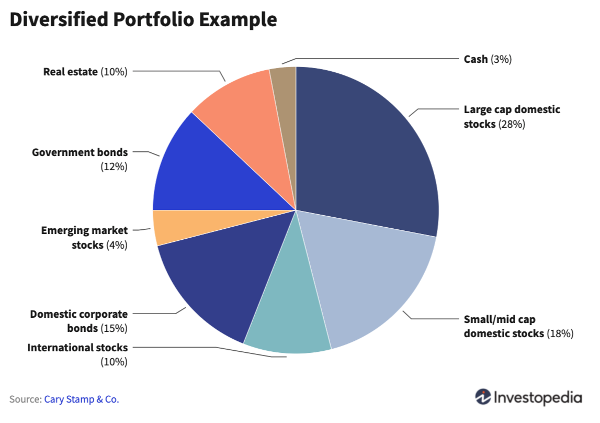
Asset allocation

You can see the portfolio comprises four assets: Stocks, bonds, real estate, cash.

So the allocation is 60% stocks, 27% bonds, 10% real estate and 3% cash.

Within the stock allocation especially, you can see diversification at play.

There’s large cap and small cap domestic stocks, which expose the portfolio to the lower and higher risk/reward ends of the local market, respectively.

There are international stocks, which expose it to companies and markets overseas. And there’s a small percentage of emerging market stocks, which expose it to the potentially large gains and losses in overseas economies which are developing and growing quickly (but tend to be volatile).

The bonds, too, are split between government and corporate issuers, providing a spread of risk among the fixed income allocation.

In this example, the investor may have individually chosen each investment. Or, for the stocks especially, they could have invested in ETFs that track the respective sectors.

Which Assets Should Be Included?

You can see in the graphic above that the example portfolio includes investments across four asset classes.

Generally speaking, today we tend to consider four main asset classes.

The Four Main Asset Classes

·  Asset Class 1 —  Cash: Money in the bank is generally a stable, secure form in which to keep some of your capital. It’s how most of us store our wealth by default.

The problem with cash is that interest rates tend not to beat the inflation rate — meaning your cash’s value will diminish over time.

·     Asset Class 2Bonds: A bond is a debt instrument. It provides a fixed income. You buy a bond from a government or business and they guarantee to pay you a fixed interest rate while you hold it. Interest rates on bonds tend to be better than what your cash will earn in the bank. 

·     Asset Class 3Stocks/Equities: Stocks essentially let you participate in a company’s activities. You own shares in a business. Those shares can rise, fall and pay income in the form of dividends.

Blue-chip companies pay good dividends and have a record of climbing steadily over the long term.

After mid-cap stocks, you have growth stocks, or small-cap companies, are smaller businesses on an upward trajectory. They are riskier but can deliver bigger, faster returns. Risker and more dynamic again are small-cap and penny stocks.

·     Asset Class 4Mutual Funds & ETFs: Mutual funds are investment funds where many investors pool their capital and allow a professional fund manager to control it. These funds do charge management fees, though, and require you to allow a third party to select the assets the fund invests in.

An ETF — or exchange traded fund — tracks an underlying index, like the ASX200, for example. Owning shares in an ETF exposes your capital to a specific mix of assets. Like stocks, ETFs vary greatly in risk depending on the sector or market they track.

Asset allocation

What Are The Benefits Of Diversification?

The main objective of diversification is to mitigate risk.

Because low or negative correlated assets (like stocks and bonds or other fixed income investments) should, in theory, balance each other out over time, a well-diversified portfolio should steer your capital towards multi-year and multi-decade profits.

Think of it like a correctly-balanced diet.

By eating the right foods from the right food groups, in the right amounts, you’re giving your body the fuel it needs to grow and recover.

If you don’t do this, and your diet is lacking in key nutrients, or excessive with the wrong foods, your body will decline — especially over the long term. 

Consider your time horizon in these terms too. An unhealthy lifestyle may carry more risk later in life than when you’re younger.

Common Asset Allocation Strategies

Strategic: This strategy relies on a ‘proportional combination’ of assets based on how much you expect each to return. You can set initial targets and rebalance from time to time.

Dynamic: This is a more active approach, in which you frequently adjust the mix of assets based on market shifts and price movement. The key to dynamic asset allocation is selling assets that decline and buying more of those that perform well.

Insured: A strategy for the more risk-averse. You start by selecting a value you won’t let your portfolio drop beneath. As long as the investments keep the portfolio above that base value, you actively adjust your allocation. And if it does drop below, you move your capital into safe fixed income assets or cash. You might find mutual funds suitable for this strategy.

Tactical: Tactical allocation is similar to strategic allocation except it allows for ‘tactical’ trades aimed at capitalizing on short-term opportunities within your broader, longer-term wealth building plan. For example, you might invest a small amount in the cryptocurrency markets to expose yourself to some of the big (but volatile) potential gains. Once you’ve made a gain, though, you quickly capture the profits and return them to your main allocations.

Looking for more strategies? Check out these stock trading strategies.

H2: Should You Use An Active Or Passive Management Strategy For Your Investments? 

How hands-on, or hands-off, should you be with your asset allocation and portfolio management? 

Like so many things in the world of wealth building, how active or passive you are with your portfolio comes down to you, your objectives, your risk tolerance, time horizon, and your other commitments.

The markets change every day. So no single strategy or approach is going to be the best one all the time.

A passive management strategy might take the form of a ‘set and forget’ portfolio. This would involve setting your asset allocation and diversification, spreading your starting capital between the stocks, bonds, cash and other assets, and leaving the portfolio with minimal management or adjustment.

One type of investment that might suit the more passive portfolio and risk-averse is an ETF, since these funds, like mutual funds are often weighted and diversified in terms of the investments they track.

 This hands-off approach — if the portfolio is correctly allocated and diversified — should perform solidly over the long term, even if there are times when it doesn’t perform so well due to not being altered to suit changing market conditions. 

An active management strategy is more like those listed above — the tactical approach especially. Active is hands on. You’re looking at your portfolio performance often, identifying opportunities to rebalance and re-diversify your portfolio.

Active portfolio management may mean you can expose your capital to better short-term growth opportunities, or protect it from short-term risks.

This style of portfolio management requires a lot more time and research than passive investing. It may also mean your portfolio performance suffers a greater impact from trading fees, since you might buy and sell more often.

Asset allocation

The Best Way To Monitor Your Portfolio Performance

Everybody’s allocation models and portfolio diversification strategies are unique to them. Your own objectives and risk tolerance will determine how you distribute your capital across your investments — and how active or passive you are in managing the portfolio.

Whether you’re a set and forget investor, or an active trader monitoring the markets every day, there’s one thing you must make sure you do.

Correctly and thoroughly track your portfolio performance using a dedicated portfolio tracker.

This is because true portfolio performance factors in more than just your nominal gains.

It accounts for how long you’ve held a position, trading fees, currency gain, taxation and dividend income.

The Navexa portfolio tracker does all this (plus, you can generate a variety of reports, from calculating unrealized capital gains to taxable income, portfolio contributions, and many more).

Navexa portfolio tracker

Key Navexa Tools

Portfolio Contributions Report: Instantly see which holdings in a portfolio are contributing the most to your overall performance — and which are dragging on your returns.

Portfolio Diversification Report: See the exact percentages of your portfolio diversification and asset allocation (each sector and each holding within that sector).

Dividend Contributions Report: Income is a huge part of your portfolio performance. Especially over the long term. Use our dividend contributions report to identify which of your holdings are generating the most and least income.

Use these reports today when you try the Navexa portfolio tracker for free!

Categories
Financial Literacy Investing

Common Stock vs Preferred Stock: Key Differences, Pros & Cons

Common stock versus preferred stock — not sure where to start? In this post, we explain these different types of stocks, what they mean for shareholders, and the key qualities of common stock as opposed to preferred stock, and vice versa.

Not all stocks are created equal. And we don’t just mean that some stocks perform better than other stocks.

Rather, there’s two distinct types trading on the open market: Common and preferred.

The first you’re probably already familiar with. The second, maybe not so much.

Common and preferred stock offer shareholders very different things — from their pricing and dividend payments, through to the privileges you’re entitled to as a shareholder of each.

Below, we explain common vs preferred stock, which is better, which is safer and more.

Common: The Stocks Most Shareholders Buy

If you’ve bought shares before, chances are you probably bought common stock. Most of the time, common stock is what we talk about investing in. Most of the world’s major markets consist of common stock, as opposed to preferred.

The definition of a stock is this: A security representing a share of ownership in a company.

When you own common shares, you own a percentage of the company or fund’s assets and profits. This is the idea upon which most stock trading rests — that buying shares in the right companies exposes your money to their success.

By owning common stock, shareholders are aiming for one — or both — of two things. First, they’re looking to increase the value of their shares via gains to the stock’s share price. If a stock rises 100%, for example, shareholders who bought before that gain could double their money.

Second, investors can benefit from holding common stock through dividends the company pays to its shareholders. In other words, you can get paid to own common stock shares — if the company’s board of directors chooses to pay a dividend.

Dividend income is one of the key differences between common vs preferred stock.

There’s another crucial benefit to owning common shares: Voting rights. As a shareholder in a company, you get voting rights on some of that company’s corporate decisions. Preferred shares do not confer the shareholder these same voting rights.

Preferred Shares: More Like Owning A Bond Than Shares

Preferred shares, while they might sound similar to common shares, are actually a very different form of investment.

They function more like a bond.

A bond is a fixed income instrument. When you buy a bond, you’re essentially making a loan to a government or company, who use them to raise money.

An investor buys a bond because it entitles them to receive a fixed income for an agreed period, at the end of which the issuer will buy it back.

Preferred shares functions in a similar way. You buy a ‘preferreds’ not to profit from a company’s rising share price (or have any voting rights as a shareholder), but to receive a fixed income for an agreed period. Some preferreds don’t ever expire — you can buy them, collect the income and never have to re-sell them to the issuer.

So, it’s a significantly different form of investment. Why do we refer to it as preferred? The answer relates to the income you collect. Preferred stockholders are entitled to collect any income the company decides to distribute before common stockholders.

When it comes to dividend distributions, there’s a hierarchy. Bonds are first in line to receive income, then preferred shareholders, then common shareholders. While owning common shares exposes you to a company’s capital gains, it doesn’t guarantee that you’ll receive a dividend — or that each dividend you receive will be the same amount.

Owning preferreds doesn’t expose you to the company’s capital gains, but it does ensure that you’ll receive a share of the profits as a dividend before common stockholders (but after bond holders).

And, you don’t receive voting rights. While owners of common stocks get voting rights in certain situations, preferred stocks do not offer this benefit.

Which Is Better, Common Or Preferred Shares?

Like many questions about investing, whether common or preferred is ‘better’ depends largely on the individual investor’s objectives and preferences.

Consider the key differences.

Common Stock vs Preferred Stock: Key Differences
  • Preferreds grant shareholders the right to receive dividend income from the company before common shareholders.

  • Common shares grant shareholders the right to vote on matters like who joins the board of directors, operational and structural changes and issues affecting the shareholders themselves like mergers, acquisitions and stock splits. Preferred shareholders do not gain any such voting privileges.

  • If a company is forced to close and liquidate its assets, preferred stockholders are entitled to payment before common stockholders.

So in assessing which is ‘better’, you should consider what your priorities and preferences dictate. If you’re looking to invest in a company you whose share price you think could rise 10-fold in the next five years, you might prefer to go for common shares, since this will allow you to capture your share of any capital gain.

But, if you’re looking to buy a stock and collect income from it over several decades, you might consider buying preferred stock (if, of course, the company offers preferred stock — many do not).

Common Stock vs Preferred Stock: Which Is Safer?

While preferred shares are similar in ways to a bond, they’re still shares. This means that its value — and the dividends it might generate — can fluctuate.

According to this professional advisor, ‘nothing is guaranteed with preferred stocks’. 

While you are entitled to receive dividends before common shareholders when you own preferreds, this doesn’t mean you’re guaranteed to receive them.

It’s possible that a company will choose not to pay a dividend to common stockholders but still pay one to preferred stockholders. So in that sense, preferreds could give you a better chance of collecting income from your investment.

One thing to note is that some preferred stocks are classified ‘cumulative’ preferred. This means that if a company misses a dividend payment, it’s obliged to pay the arrears in the future — before paying dividends to common stockholders.

Preferred stocks, like common stocks, are liable to rise and fall. See the chart below showing a preferred stock ETF (in blue) relative to a common stocks fund over five years.

Common vs Preferred Stock
Source: https://obliviousinvestor.com/is-preferred-stock-safe/

If the company goes out of business, preferred stockholders will receive payment before common stockholders, but after creditors and bond holders.

So by some measure, preferreds could be regarded as relatively more safe compared with common shares. But all investments, of course, carry risk. You should always do your own research and seek a professional opinion before risking your money. 

Why Would A Company Issue Preferred Stock Vs Common Stock?

Preferred stock offerings are relatively rare in the stock market. There’s two main types of organizations that tend to offer them; Financial companies like banks, and real estate investment trusts, or REITs.

Businesses liked these might choose to issue preferred stock because it counts not as a liability on their balance sheet, but equity instead. That lets the business raise funds without increasing its debt-to-equity ratio.

Preferred stock also grants less control of a company to outside investors — something a business may prefer than offering common stock.

What Is The Downside Of Preferred Stock?

If the benefits of owning preferred stock as a shareholder are better privileges when it comes to dividend income and payment in the event of bankruptcy or liquidation, then the downsides are these:

1.   You don’t get any say in corporate decisions like you could get by owning common stock. This means you’re more of a passenger on the company’s journey than an active shareholder who can influence its direction or strategy.

2.   You don’t get any exposure to the stock’s potential capital gains. If your own preferred stock in a bank that produces a 100% price gain, you won’t benefit as a preferred stockholder. Although, you may indirectly enjoy a share of those profits in the form of an increased dividend payment.

Common Stockholders vs Preferred Stockholders

The differences between common stock and preferred stock are simple.

Common stock — which accounts for the majority of stock available on the market — gives you the standard exposure and rights you’re probably used to as a shareholder. You can grow (or lose) your capital and collect dividend income by owning common stock.

Common stockholders are investors who have the right to profit from rising stock prices, collect income and have a say in corporate decisions. But, they are the last in line for dividends and bankruptcy payouts.

Preferred stock is far more rare than common stock. Only certain companies — generally financials and REITs — offer this bond-like type of stock.

Preferred stockholders don’t get exposure to capital appreciation. Rather, they are ahead of common stockholders in the income and bankruptcy payout hierachy.

Earning Dividends From Common Stock Or Preferred Stock? You Must Do This.

Now you know the main differences between common stock and preferred stock.

But, did you know that many investors fail to properly track and account for their dividend income? They look at their capital gains and treat their portfolio’s income separately. But, the fact is, your dividend income has a potentially huge impact on your overall returns and performance.

With the Navexa portfolio tracker, you can easily track your dividend income.

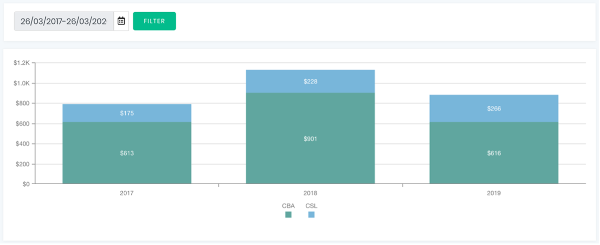
Here’s an example of our dividends reporting, showing you how different holdings generate income year to year:

Common vs Preferred Stock

Whether you’re collecting income from common stock or preferred stock — in fact, especially if you’re a preferred stockholder — you need to be able to report correctly on that income at tax time.

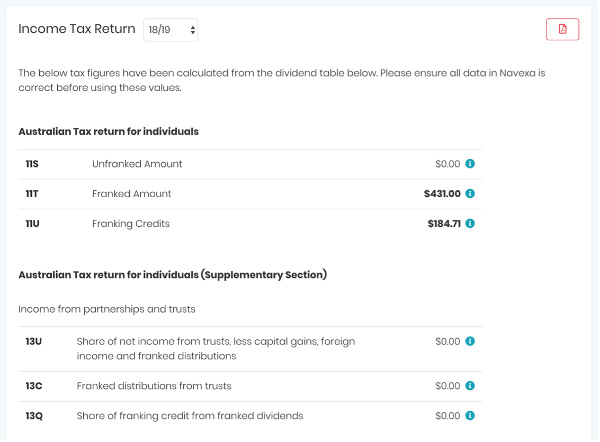
That’s why we’ve created an automated portfolio income tax report in Navexa: 

Common vs Preferred Stock

 If you want to improve your dividend income tracking and reporting, take a free trial of Navexa today.

Categories
Financial Literacy Investing

Stock Trading Strategies Every Trader Should Know

Trading the stock market is a complex and ever-changing challenge. Here are seven common trading strategies investors use to navigate it.  

Do you consider yourself an investor, or a trader? If you’re the type who prefers to buy and sell shares in the stock market often, instead of holding onto an investment perhaps for several years at a time, you’d probably be considered a stock trader.

You may have heard the terms ‘passive’ and ‘active’ investing.

Passive investing is generally long-term investing. You might research and value a stock, invest in some of its shares, and leave that investment alone for many years to let it appreciate in value.

Active investing is the opposite.

Active investing is the domain of the trader, as opposed to the investor.

Traders don’t look for long-term investments. Rather, they buy and sell stocks with the objective of making a quick profit from short-term price movement.

Some traders may make hundreds or thousands of trades a day, aiming to cycle their capital between positions — often looking to profit from both upward and downward price movement.

In this post, we’re going to introduce some of the essential components of trading strategies, from some of the common terms and ideas to important factors every trader, indeed every investor, should be familiar with.

Then, we’ll cover seven commonly used stock trading strategies traders of many different kinds are using in the stock market today.

trading strategies

Essential Components Of Every Trading Strategy

Trading in the stock market — regardless of which trading strategy you choose — requires a significant amount of knowledge.

Even beginning traders should invest substantial effort into educating themselves on the processes and terminology of the market and the wide variety of assets trading on it.

Volume: Volume refers to the amount of shares being bought or sold in a given stock at a given time. Most stock charts will show you the volume relative to the price movement — often with a bar graphic displayed over the price movement line. Volume shows you how much money is changing hands for that asset in the market.

Liquidity: Liquidity relates directly to volume. The more shares are being exchanged in a stock, the easier it should be to find a buyer or seller to trade with. Low liquidity might mean it takes time to execute your trade — which could mean the price shifts while you wait.

Volatility: This is the extent to which the stock’s price moves up and down. If the share price moved between, say, $100 and $105 over a one-month period, you’d say it showed low volatility compared with another that moved between $5 and $50 in the same timeframe.

Float & Short Float: When you hear traders talk about the ‘float’, they’re referring to the number of shares available to the public to buy and sell. The float has an effect on a stock’s liquidity. The ‘short float’ refers to the number of available shares that have been borrowed for short selling (this is a key indicator of short interest).

Long and Short: You may have heard the phrase ‘going long’ or ‘going short’. These are stock market terms for betting on a stock rising or falling in price. A ‘long’ position is where you buy shares and aim to sell them at a higher price. A ‘short’ position is where you borrow shares and agree to sell them at a lower price, capturing the difference as profit.

Moving Average: Traders will use the moving average to determine a stock’s trend over a given time frame. Many charting tools will allow you to set and view a moving average line over the price movement. This allows you to ‘zoom out’ and get a different perspective on a stock from price alone.

Stop Loss: Traders and investors alike commonly use stop loss orders to protect their capital. When you enter a trade with your broker, you can set that order to automatically sell you out of part, or all, of your position when the stock falls to a given price. This can save you losing more capital on a losing trade. It can also result in being ‘stopped out’ of a good trade during temporary price drop.

Limit Order: The limit order works similarly to the stop loss order. But in this case, you enter the trade with the condition to buy shares at a certain price. Say you’re keen to buy 100 shares in Stock X, but you don’t want to pay the current price of $20, you can enter a limit order so that if the price comes down to $15 within a given time frame, your broker will try to buy you those 100 shares.

These are just some of the key terms you need to be familiar with when entering the stock market as a trader or investors.

Remember, all investing carries risk and it’s vital to educate yourself, seek advice and be clear about the risks to your capital when you enter the market.

trading strategies

Seven Commonly Used Stock Trading Strategies

Now that we’ve covered some of the basics above, let’s get into the actual trading strategies you can choose from when looking to make money in the stock market.

Day Trading: Fast, High Impact Buying & Selling

You’ve probably heard of day trading. Day trading is exactly what it sounds like — a style of trading where all the buying and selling occurs within a single trading day.

The idea with day trading is to use large amounts of capital — and often ‘leverage’ (money borrowed for trading) — to profit from intraday price movements in stocks.

Day trading depends heavily on technical analysis. In other words, interpreting stock charts to determine the likelihood of small price movements one way or another.

Day trading relies heavily on technical analysis. The day trader tries to predict a short-term price movement, and bet a large amount of capital on that movement with a view to closing out the trade that same day.

For example, a day trader might calculate Stock X is going to increase from $10 to $10.25 that day.

They might put $100,000 of their own money into that trade, plus another $200,000 of leverage (borrowed money from their broker). They’ll probably use a stop loss to protect against critical losses, too.

If that price move does play out, it’s only a 2.5% gain. But with the $300,000 they traded with, that’s a $7,500 profit (minus the leverage fee, of course). 

That’s day trading in a nutshell! Of course, the potential big rewards come with the equal amount of risk.

Day trading is an often-talked about trading strategy which, like all stock trading strategies, carries with it the risk of losing money.

Position Trading: Looking to Profit From Medium-Term Trend Prediction

While day trading hinges on making trades within a single day, and trying to leverage tiny price movements for big profits, position trading is a relatively slower trading strategy.

Position trading, or ‘trend trading’ is similar to day trading in that the position trader will use charts and technical analysis (ADD TA ABOVE!) to determine whether a stock or market is likely to move up or down.

The difference is that position traders don’t worry about trying to predict prices. Instead, they use an array of tools, calculations and indicators — the moving average being a major one — to determine the trend.

Once they’re satisfied that a stock is trending a certain way, they’ll enter a trade with a view to holding that position until the trend changes.

This could mean they hold a stock for weeks or months. It could also mean they exit with a 5% gain or a 50% return. To the position trader, the length of the investment and the price change don’t matter. What matters is the trend.

Whatever they’ve put their money in, the trend trader monitors the investment’s trend. As soon as they see a clear indication the trend is about to change, they exit the position. They’ll also commonly employ stop loss orders to protect their capital.

Generally speaking, position or trend trading becomes is a difficult trading strategy in highly volatile markets, since it’s more difficult to determine medium and long-term trends when prices are rising and falling dramatically.

trading strategies

Swing Trading: Buying & Selling Based On Changes In Market Sentiment

Day trading is by definition a very short-term trading strategy. Position, or trend, trading is a longer term approach.

Between day trading and position trading, sits the swing trading strategy. Swing trading isn’t about trends, nor tiny movements in price. Rather, the swing trader focuses on changes in market sentiment about particular stocks.

Moving average indicators are key to swing trading. That’s because they help the trader interpret how the market feels about a given stock. Remember, the stock market is largely a measure of how people feel about companies and businesses.

A swing trader employs a particular kind of moving average called the exponential moving average, or EMA. The EMA doesn’t only reflect the average of a stock’s price for a given period. It also factors in the latest data points for that stock.

These might include company announcements, market news or relevant current events that could impact its stock (consider the extent to which the COVID-19 pandemic impacted airline and tourism businesses, for instance).

By interpreting these data using the EMA, the swing trader, will try to determine where bullish (optimistic) market sentiment changes, or swings, to bearish (pessimistic) sentiment.

They’ll use that data to time their entry and exit points for a trade — going either long or short depending on the swing and looking to exit a position once they believe the sentiment is set to swing back.

News Trading: Predicting Market Reactions To Current Events

Many trading strategies have a lot in common with each other.

You could think of news trading as swing trading’s cousin. But rather than using technical analysis to determine when prices are likely to move up or down, the news trader monitors current events to predict how a market might react.

 Again, consider the airline example above. A news trader might interpret the breaking pandemic stories as a signal airline stocks are about to fall, and either place short trades to profit from the downside, or wait to buy shares after the fall. 

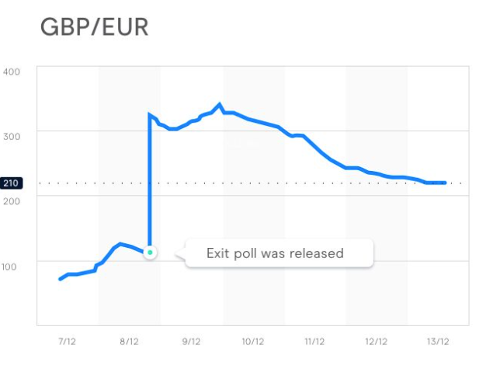
scalping trading strategy
Source: CMC Markets

See the chart above for an example of how the Brexit news had an immediate impact on the Pound/Euro exchange rate.

News trading requires a lot of research and time. It’s a less exact trading strategy that carries its own unique risks.

Scalping: Aiming to Accumulate Many Quick, Small Gains

Scalping is similar to day trading and trend trading strategies. The scalper will look for quick opportunities to profit using a combination of technical analysis and maybe some trend following.

But, rather than wait for a trend to establish itself, or change, the scalping trading strategy dictates that you get out of every trade fast.

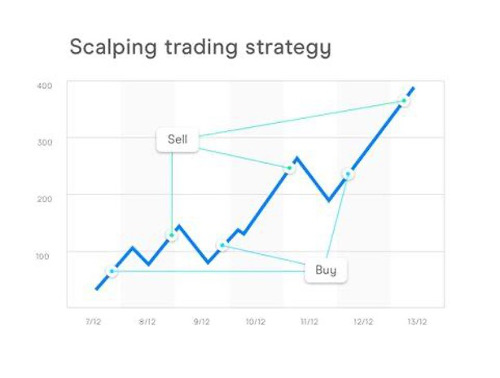
Rather than trading, say, one or two positions a day, you’d trade maybe five or 10, with the aim of gathering up a handful of small wins that amount to a solid return.

The image illustrates how a scalper might approach a trading position.

trading strategy
Source: CMC Markets

While there’s no overnight risk (as scalping is a type of day trading), this trading strategy does require discipline, focus, and a tolerance for stress.

Algorithmic Trading Strategy: The Way of Wall Street’s Elite

All the stock trading strategies above have one thing in common: The trader makes the decisions on what they’ll buy and sell, when, and for what reason.

But all those trading strategies can be augmented with another.

In algorithmic trading, the onus is on a piece of software to decide what you should trade.

Algorithmic trading — also called black box trading, or automated trading) involves a computer interpreting huge amounts of market data to determine the best way to trade the market on a given day.

The algorithm produces trading recommendations which you can either manually follow, or automate, depending on the system.

This type of trading relies heavily on the quality of the algorithm you use (and the talent of the people who create it — check out Motion Trader for an example of a very successful trading algorithm).

How To Learn Stock Trading Strategies And Get Started As A Trader

 The stock trading strategies we’ve outlined above are just a few of the main types in the market.

There’s many more — and more being created and refined all the time as markets and technologies evolve.

If you want to learn, you have a centuries worth of knowledge to draw on in the form of books, online courses, YouTube channels and more.

The best thing to do is to start learning, talk with other traders and seek to build your knowledge.

If you’re not investing already and are just starting out, you might want to consider this brilliant stock simulator where you can start testing your ideas without any risk to your capital.

portfolio tracker

However You Choose To Trade The Market, You Must Do This…

Whether you’re day trading, swing trading or an algorithmic trader, there’s one tool you should make sure you have for your journey: A dedicated portfolio tracker.

When we invest and trade, we often just focus on stock prices and returns. But, in reality, there’s many more factors that impact how much money we actually make (or lose) in the market.

That’s why you need to portfolio tracker that calculates your true, annualized performance for your portfolio and the holdings in it.

True performance is different from the simple ‘gain’ you’ll see in your trading account. It accounts for how long you’ve held a position, trading fees, currency gain, taxation and dividend income.

The portfolio tracker we run here at Navexa does all this (plus, you can generate a variety of reports, from calculating unrealized capital gains to taxable income, portfolio contributions, and many more).

Take a free trial of the Navexa portfolio tracker and see for yourself what your portfolio’s true performance really is.

Categories
Financial Literacy Investing

Short Float: What, Why, How & Examples

For the everyday investor, the world of short selling can seem like a dark and mysterious art. Perhaps one of the least understood terms in it is the ‘short float’. In this article, we explain what short float means, how it fits into trading, and how some investors use it to find profitable trades.

What is a short float?

Like many jargon terms you encounter when you get into the investing world, the short float is an often misunderstood — but relatively easy to grasp — term.

In this post, we explain what a short float means, why it exists, and how understanding it applies to everyday investing.

Plus, we share some examples of how investors and traders use the short float when they’re researching and executing trades.

Breaking It Down: What Is A Stock’s Float?

In the context of investing, the ‘float’ refers to the number of a company’s shares that are available to the public at a given time.

See, not all a stock’s shares are available for the everyday investor to buy or sell.

Shares are generally divided up into restricted and unrestricted groups.

Restricted shares are those issues to directors, executives and corporate affiliates.

The rest are available to the market.

It’s these unrestricted shares that constitute a stock’s float.

It’s important to understand that the size of a stock’s float (in other words, the total number of shares available on the open market) can impact its volatility.

A smaller float could mean it’s more difficult to buy or sell shares.

You might think checking a stock’s ‘shares outstanding’ figure will give you an indication of its potential liquidity.

But, it’s important to understand that the float is different from shares outstanding.

While shares outstanding refers to the total number of shares a stock has (including restricted shares), the float refers only to those actually available for everyday investors to buy and sell.

Short Selling: A Brief Explanation

You might have heard the term ‘short selling’ when the Gamestop story was in the headlines in early 2021.

Short selling — or just ‘shorting’ for… well, short — is when you borrow shares from a stock broker and sell them to another investor for a given price.

You also agree that you will buy those shares back at a specific time.

If you borrowed $5,000 worth of shares in a company you thought was going to be trading 50% lower in three months — and your prediction proved correct — you’d be able to buy those shares back for $2,500, return them to your broker and pocket the other $2,500.

That’s shorting in a nutshell.

It’s a way to potentially profit from prices falling instead of rising.

It’s important to note that you can’t short sell shares you own.

You have to borrow them, sell them, buy them back and return them to make money from shorting.

There have been many famous and infamous examples of traders making their fortunes by shorting assets and markets.

Kyle Bass, for example, bet about $4 billion against US subprime mortgage-backed securities right before they sent the global markets into a crash.

The Short Float Explained

A stock’s short float is the percentage of shares which investors are shorting relative to the total available — or floated — shares.

Another term for it is ‘short interest’, which says it all.

Learning about a stock’s short float means you’re learning how many investors are betting that the share price is going to fall.

According to ragingbull.com, the short float for a given stock rarely exceeds 50% — although it’s not impossible.

Generally speaking, you could say a stock had substantial short interest if the short float were above 40%.

A figure like that tells you that 40 in every hundred of a company’s unrestricted shares have been borrowed by short sellers.

Remember, shorting a stock involves borrowing from a broker, selling at market prices and agreeing to buy back and return at a specified time.

What does that mean for the everyday investor?

Primarily, you might look to the short float as an indicator of market sentiment.

While I personally prefer a value-based fundamental analysis approach, you could, for example, use the short float information to compare against a stock’s fundamentals to gain a clearer idea of where the price might be going.

How Do You Find Information On A Stock’s Short Float?

The exchange on which a stock trades should publish the numbers indicating short interest regularly.

The NYSE publishes short numbers twice a month, for instance.

Check with your local exchange to make sure you know where and when to access the data.

How Understanding A Stock’s Short Float Could Help

While the short float isn’t a complete indicator of coming price action or sentiment around a stock, it can help you understand a couple of things.

If you find that a stock has high short interest, this may mean that the company is struggling and that prices are indeed on their way lower.

If you are comfortable and competent with short selling, perhaps you’ll choose to use that as an opportunity to short.

Or, according to ragingbull.com, high short interest may be indicating that while a stock could be about to drop in value, investors are expecting the price to bounce back.

They may be trying to short the stock lower and then buy shares before it rebounds — trying to profit on the way down and the way up.

It’s never going to be obvious exactly what high short interest indicates about a given stock. There’s many possibilities.

That’s why, in my case at least, I’d be looking to pair my understanding of the short float with other forms of analysis.

For me, that would be fundamental analysis and company valuation.

For others, maybe that means technical analysis or research into news around the business and future events that could impact its profitability.

If 40% Is A High Short Float, What’s A Low One?

This trader points out that in 10 years of trading, they’ve seen a lot of short float data.

It’s possible that a short float can go to zero — that there are no borrowed shares at all and no one willing or able to short the stock.

That’s rare though.

Generally, you’d consider a stock to have a low short float if it were around 10%-20%.

When there’s little supply, as in a low float, it won’t take as much volume to produce a price movement.

For example, 10,000 shares changing hands in a stock that has a float of 1 million would, in theory, create a bigger price movement than if that stock’s float were 10 million.

In terms of the short float, this relationship between the amount of shares available and the volume matters, too.

  • It’s important to understand that float matters relative to volume.
  • You can think of the float as the supply of shares at any given time.
  • You can think of volume as the demand.

Calculating The Short Interest Ratio

The short interest ratio is a means of understanding what a stock’s short float could tell you about upcoming price action.

You can work out the extent to which short sellers are targeting a stock by calculating its short interest ratio.

How do you do it?

It’s easy.

You just need to find the short float number — remember, that’s just the amount of available shares traders have borrowed for short positions.

Then, divide that number by the stock’s average daily volume.

Some investors will refer to this ratio as ‘days to cover’.

The short interest ratio will give you the approximate number of days it would take for the market to ‘cover’, or buy, all the short positions in the stock.

The bigger the ratio, the longer it could take for the market to buy the shares from the short sellers.

And the longer it would take the market to buy those shorted shares, the higher you’d judge the short interest in that stock.

The short interest ratio will rise and fall as trades and volume fluctuate.

How Investors Can Use The Short Interest Ratio

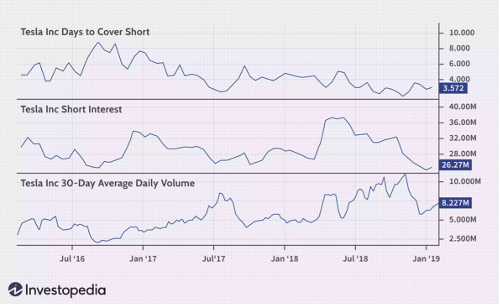
Here’s a great example of the short interest ratio at play with Tesla.

Take a look at the charts:

short float

The three charts show…

  1. How many days it would take for the market to cover the Tesla short positions — in other words, the short interest ratio.

  2. The number of shares borrowed for short selling (the short float).

  3. The daily average trading volume for Tesla stock.

This example illustrates that the relationship between the short float, short interest ratio and volume don’t always move in sync with each other.

According to the article:

In July and August 2016, the short interest ratio rose despite the number of shares short falling.

That was because the daily average volume fell sharply during that time.

Additionally, the short interest was steadily declining in 2018 despite short interest being elevated because the average daily volume was steadily rising on the stock.’

You can see that — as with most things in investing — understanding the short interest in a stock is not an exact science.

It’s important to consider information like the short float, short interest ratio and volume in relation to one another.

Short Interest Ratio Limitations

One of the main limitations of the short interest ratio — and the short float — as an indicator, is that it’s only updated relatively infrequently.

Generally, the market reports the short float (and therefore the short interest ratio) every fortnight.

By the time that information reaches the market, the short positions in a stock could have grown or shrunk.

Volume, too, fluctuates far more frequently than every two weeks!

The short interest ratio — even if were updated on a daily basis — is really only a guide.

Current events and market news also impact trading volumes greatly.

Think of the stock in the example from Investopedia above, Tesla.

This is a stock that often produces dramatic price movement thanks to its high profile business operations and highly visible CEO.

If you were looking at the short interest ratio on the day Tesla announced its massive Bitcoin investment in early 2021, for instance, and that information was two weeks old, the numbers probably wouldn’t be accurate at that time.

Short Float Versus Short Interest Ratio

Now that you know what the short float and the short interest ratio are, be sure to understand the difference between the two.

Remember, the short float is the number of unrestricted shares investors have borrowed to short sell in the hope that they can buy them back at a lower price.

Investors will sometimes refer to the short float as short interest.

But short interest and the short interest ratio are two different things.

The short interest ratio is a formula you use to determine how many days it would take the market to buy — or cover — all the shorted shares.

Now You Know How To Determine & Interpret The Short Float

If you came into this blog post unsure about what short selling, short float and short interest meant, I hope you now have a much better idea.

Like other methods of analyzing a stock, trying to interpret short interest isn’t an exact science.

When you’re sizing up a potential investment and trying to determine whether you want to risk your capital on it — and bearing in mind this post is general information, not investment advice — you can never be 100% sure what a stock is going to do next.

But, what you can be sure of is how your investments and portfolio are performing to date given the decisions you’ve made.

While past performance is no guide to future returns, understanding the details of your portfolio performance is, I believe, a crucial part of forging a profitable wealth building journey.

That’s why my team and I developed the Navexa portfolio tracker — a platform that gives you in-depth true performance analytics on your stocks, ETFs, cash accounts, cryptocurrencies and even unlisted investments like property.

Categories
Financial Literacy Investing

Dividend Reinvestment Plans: Some of the Key Pros & Cons

Dividends don’t always arrive in the form of cash. Some stocks allow investors to automatically reinvest their dividend payments into additional shares. Here, we take a look at some of the positives and negatives associated with reinvesting investment income instead of receiving dividend payouts as cash.

So, you’re collecting dividend income from your investments.

Great!

Investing in quality dividend-paying stocks can be a brilliant way to boost your returns — see how one of my income investments paid back nearly half my capital in just four years.

There’s more to dividend investing than just getting paid to hold shares, though.

Some stocks don’t simply pay you a cash dividend on a regular basis.

They give you the option to reinvest your dividend income into additional shares.

As you’ll see in our post explaining dividend reinvestment plans (DRPs), this option can have powerful effects on long-term returns.

On a long enough timeline, a DRP could be the difference between making a few hundred thousand dollars on an investments, and a couple of million.

But that doesn’t mean that choosing a DRP for your investment income is always going to be the default best option.

In this post, I’m going to go through three pros and three cons of reinvesting your dividends.

I should point out, though, that this is by no means an exhaustive list.

(Nor does it constitute financial advice.) 

DRP Pros: Compounding Through Increased Exposure & Saving On Brokerage Fees

  • Compounding

I like what Einstein (allegedly) said about compound interest being the eighth wonder of the world.

The true wonder of compounding only becomes apparent with enough time.

As a long-sighted value investor, I try to let time work for me.

By that, I mean I look for quality, undervalued stocks and I buy them with a view to going ‘The Full Buffett’ and holding onto them for decades.

If you’re prepared to be patient and hold an investment for a long time, a DRP might work in your favour.

Why? Because over time, not only will your additional shares compound the size of your overall position, but you’ll receive more shares each time (since dividend amounts relate directly to your position size).

In some cases, with the right companies over a long enough time, you could double the size of your position simply by allowing reinvested dividends to accumulate.

  • Increasing Your Exposure

Another advantage of using the DRP on an investment is that, over time (and again, the more time you allow, the more powerful the effect could be) is that accumulating more shares increases your exposure to the stock.

If you’ve selected a quality company to invest in, and the company’s stock increases in price over time, you will have more shares exposing your portfolio to that capital gain.

In simple terms, if you had 1,000 shares worth $10,000 in a company that rose 100%, you’d have 1,000 shares worth $20,000.

But if you’d reinvested your dividends and that had netted you, say, an extra 200 shares, you’d have 1,200 worth $24,000.

  • Acquiring Extra Shares Without Paying For Them

One of the factors many investors neglect to consider when calculating their TRUE returns is brokerage fees and other transaction costs.

Generally, when you make a trade, you’ll pay your broker a fee to facilitate that trade.

This is another reason why I favour longer term, relatively inactive investing as opposed to buying and selling frequently, trying to chase trends or predict the market.

If I hold a single investment for 20 years, the fact that I paid, say, $100 brokerage becomes virtually irrelevant when I annualize my return.

And if you prefer not to let fees eat into your returns, you might like the DRP option, too.

Some stocks’ DRPs allow you to accumulate the additional shares for zero fees, since you’re not buying through a broker but rather have a direct agreement with the company itself.

So, those are three upsides to DRPs. In my view, investing this way only really delivers a meaningful advantage if you allow enough time for compounding, increased capital exposure, and the benefits of not paying brokerage on your additional shares to accumulate.

Now, let’s take a look at the downsides of DRPs.

DRP Downsides: Opportunity Cost, Less Control, And The Flipside of Increased Exposure

  • You Don’t Control The Price Of Your Additional Shares

Acquiring additional shares through a DRP is great, in principle. Like I said, on a long enough timeline, and provided you’ve invested in a quality company that grows stronger and more profitable, it’s a sound idea to acquire more shares.

But like I also said, I’m a value investor.

I only buy shares in a stock I calculate is trading under its intrinsic value.

If you share that approach to buying stock, you may find that a DRP has an unintended downside; acquiring additional shares at prices above what you’d choose to pay were you analysing the stock with fresh eyes as a new investor.

Not only do you not get to choose the price you pay for each bundle of additional shares, you don’t get to choose the timing of the reinvestment, either.

So, in terms of control and in the spirit of not paying more than you want to, a DRP may be a downside.

  • Opportunity Cost

The essence of the DRP is that you receive shares instead of cash.

As we know, this can have plenty of benefits, especially if you’re investing for the long term and intend to let the power of compounding work its magic over.

However, one potential downside of opting for a DRP over a cash dividend, is that you’ll miss out on opportunities to do things with that investment income other than automatically convert it into additional shares.

In other words, opting to reinvest your dividends could have a negative impact on your portfolio diversification.

Consider early 2021’s cryptocurrency bull market.

Say you’d been reinvesting your dividends in one of your stocks for five years, and you’d turned a $10,000 position into a $20,000 position (between capital gains and the DRP).

Not bad, a 100% gain.

But say you’d taken the cash dividend instead and invested it in Bitcoin, you could have exposed that income to far greater capital gains.

Of course, this is a simplistic example that benefits from hindsight (five years ago and even today, many still wouldn’t recommend cryptocurrency as a sound investment).

The takeaway here is, while a DRP can be a powerful tool in compounding your investment income and position size, it can also cost you the opportunity to invest your dividends in other assets and opportunities.

  • The Flipside Of Increased Capital Exposure

This potential downside is a reflection of the potential positive we mentioned above — increasing your exposure.

Because, of course, if a DRP increases your exposure to a quality stock’s capital gains, it can equally expose your capital to greater losses.

This is something you should always take into account if you’re reinvesting your dividends back into a stock — and of course any time you invest — your capital is always at risk.

While the stock market does generally rise over the long term, that doesn’t mean every stock does.

Everything, in theory, can go to zero.

So if you were invested in a company that collapsed or went bankrupt, that increased exposure through your DRP could result in you losing more money than you might have if you had simply collected your dividends as cash.

Dividend Income: To Take The Cash, Or Reinvest?

Dividend reinvestment can be a valuable tool for the investor.

Of course, like any decision we’re faced with when trying to build wealth in the market, there are pros and cons.

Using a DRP to compound your income and capital can be a powerful way to grow your portfolio.

Compounding, increased capital exposure, and zero or few brokerage fees are in my view key benefits of utilizing a DRP.

On the other hand, increased exposure could bring increased risk, while DRPs may also inhibit you from investing in other opportunities or diversifying your portfolio.

The other key potential downside to DRPs is that you lose control over the timing and price of the additional shares your dividends will earn you.

In my opinion — and bear in mind I am not a professional investor or advisor — it’s important to view a DRP investment in both the wider context of your overall portfolio and financial goals, and — in my opinion — through the lens of long term investing.

I hope this post on the pros and cons of DRPs has been helpful for you.

I’ll leave you with one of my favourite investing quotes, from Warren Buffet’s business partner, Charlie Munger:

“The big money is not in the buying and selling. But in the waiting.”

Categories
Financial Literacy Investing

Ex-Dividend Dates Explained: What, When & Why

What does it mean when a stock goes ‘ex-dividend’? As you’ll see in this brief guide, the ex-dividend date is an important part of the income investing — and, potentially the value investing — process. We explain what it means and why you should understand its impacts when buying stocks for both capital gains and dividend income.

If you’re new to income investing, you may think earning dividends from stocks you own is simple and straightforward.

In principle, it is; You buy shares in a profitable company that pays a portion of its earnings out as cash dividends to investors who’ve traded their capital for shares in the business.

I’ve personally been receiving income from some of my investments for years now.

I’ve seen first-hand how powerful a steady stream of dividends can be for your overall portfolio performance.

But understanding investment income is a little more complex than just buying and holding any stock that pays a dividend.

Here, we explain the finer points of dividend payments.

As you’ll see, the date a company pays out a dividend to shareholders is just one of the key dates you need to be aware of as an investor.

What Does It Mean When A Stock Goes Ex-Dividend?

There are four key dates around dividend payments.

The first is the declaration date. This is the date the company announces it will issue a cash dividend in the future.

Second, you have the record date. That’s the date the company goes through its list of shareholders to confirm those who are eligible to receive the upcoming dividend.

Third is the ex-dividend date.

This is an especially important one, as it determines which shareholders will be considered eligible on the record date.

The ex-dividend date is commonly set two days before the record date.

This means you must own shares in the company on or before that date in order to qualify for the upcoming dividend.

Finally, there’s the dividend payable date, or simply the payment date.

That’s exactly what it sounds like; the day the company pays out the dividend to the shareholders who’ve met the criteria to receive it.

Those are the four key stages of a dividend.

The ex-dividend date is arguably the most important because it’s the cut-off point for determining whether or not you will receive the next scheduled payment for your shares.

Is It Better To Buy A Stock Before Or After The Ex-Dividend Date?

In my opinion — and everything on our blog is opinion, it’s not financial advice — there’s no great advantage to buying before or after the ex-dividend date.

But that’s because I personally prefer to hold any shares I buy for a relatively long time.

If you’re looking for a quick cash gain, you may consider trying to buy shares in a stock right before the ex-dividend date.

On paper, that might not seem like a bad idea.

In reality, the market adjusts the stock price when a company trades ex-dividend. This takes account of the cash payment being made to shareholders.

Generally, the share price adjusts by the amount of the dividend, meaning if you buy right near the ex-dividend date and sell right after the dividend payable date, you could take a small capital loss despite having captured the income.

In other words, trying to dip in and out of a stock to grab the dividend may not work out as profitably as you’d hoped.

Even if that weren’t the case… and you could dip in and out of a stock quick and easy to claim some fast income, you’d still have fees and taxes to contend with, which would eat into your gains (see the full list of factors that impact your true portfolio performance).

Still, there probably are people out there who buy and sell around ex-dividend dates regardless of the downsides. So…

Are Ex-Dividend Dates Value Investing Opportunities?

I personally follow the value investing strategy set out by Benjamin Graham and, later, Warren Buffet.

I prefer to look for high quality companies trading below their true value.

If I find one of those, I’d rather buy shares and hold them for a (very) long time than trade frequently.

So, for me, an ex-dividend date isn’t necessarily an investment opportunity in itself.

But, if I calculate that this is a stock I want to own, I might look to get in before the ex-dividend date.

Having said that, since my investment strategy is a long term one, missing a single dividend payment by buying in after the ex-dividend date wouldn’t bother me one bit.

I’d be looking to hold (that’s stockspeak for ‘hodl’ if you’re joining us from the crypto world) those shares for many years, ideally capturing a long term capital gain plus the income the company pays out over that time.

But, that is just me. Not everyone invests the way I do (learn about my experience buying my first ever shares to see why I invest the way I do).

I hope this post has shed some light on ex-dividend dates, the process they’re part of, and the impacts they can have on both stock prices and investment income.

Categories
Financial Literacy Investing

Three Mistakes To Avoid When Calculating Portfolio Return

The truth about portfolio performance and investment returns is a lot more complex than most people realise. Here’s three tips on better understanding how your money is performing in the market over time.

When someone asks you how your investment portfolio is performing, what do you say?

‘Not bad’? ‘Could be better’? ‘Stock X has been on a tear lately’?

If you use a financial advisor to manage your investments, do you simply glance at the ‘annual return’ figure and say that’s how your portfolio has performed?

What about income from dividend payments?

Or taxes?

What about time?

Are you happy to look at the short term and cherry pick assets that have performed well?

In this post, we’re going to explore the common problems people have in understanding and expressing their portfolio performance.

Specifically, we’re revealing three mistakes you should avoid when you’re analysing your portfolio and determining its performance.

These mistakes relate to our understanding and perspective on time, our tendency to ignore the impact of dividend income and reinvesting, and the dangers of ignoring the impact fees and taxation has on your overall portfolio performance.

Here at Navexa, we believe intelligent investing hinges on carefully analysing data to get a clear view of your portfolio’s big picture.

Mistake I: Not Annualizing
Your Investment Returns

Say you buy a stock at $5.00 and you sell it for $10.00.

Boom, that’s a 100% gain!

Awesome, you doubled your money.

Good for you. But, what’s missing from the above account of your epic gain?

Time.

Consider this; Two investors buy a stock each. The stock price of both increases by 100%.

Say it took one of them 12 months, and the other three years.

Is it the same result?

On paper, yes. Their capital doubled.

But there’s little doubt you’d rather do it in one year than three.

When you ‘annualize’ your investment returns, you factor time into your calculations.

There are various methods of doing this, but the basic idea is that you divide your capital gain by the time it took you to realize it.

So, 100% in a year is an annualized 100% gain — it took one year to realize.

But 100% over three years is a 33.3% gain, because it took three years to realize.

Annualizing your portfolio performance gives you a more balanced and realistic understanding of your returns over time.

Time, after all, is a finite resource for every investor. So it pays to factor it in!

Mistake II: Treating
Dividend Income Separately

If you own a stock that pays a dividend, you’re collecting income simply for holding the company’s shares.

Investments that pay an income are central to compounding capital and building wealth over the long term.

However, there’s sometimes a tendency for investors to think of their stock’s capital gains as one thing and their income as another.

In some ways, they are separate.

But in terms of calculating the true performance of a holding or portfolio, it’s vital to factor in dividend income.

For instance…

Say Stock A goes up 100% in price over three years (a 33.3% annualized return), and Stock B goes up 110%.

If you fail to account for dividends, you’d think Stock B would be the winning investment.

But if Stock A paid you a 8% quarterly dividend over those three years, and B only a 3% dividend…

Then you’ll find that despite returning a lower capital gain, Stock A delivered the better return on account of the superior dividend income.

This applies even more so when you’re reinvesting your dividends into new shares in a holding.

It’s vital to treat investment income as a factor in calculating you’re overall true portfolio performance.

Mistake III: Disregarding
Broker Fees and CGT Events In
Your Portfolio Performance

Every time you buy or sell an investment, you’ll pay a fee for the transaction to your broker.

Say you pay $10 per trade.

One hundred trades will cost you $1,000 — regardless of whether the investments themselves make any return.

You broker fees should factor into your portfolio performance calculation.

It’s money you’ve spent in the investment process. Money you ideally want to (more than) make back in capital gains and dividends.

The other thing to note about trading fees is obviously that the more you trade, the more capital you’ll burn in the process.

The same goes for CGT — capital gains tax — events.

In Australia, every time you sell a holding you trigger a CGT event.

For argument’s sake, let’s return to the example from earlier.

Say you make a 100% capital gain on a stock over three years.

And say that stock made you another 50% in dividends over those three years.

That’s an annualized gain of 50% (150% total divided by three).

If it was a $10,000 investment to begin with, on paper you’d have $25,000 in capital.

Now let’s deduct the broker fees for buying and selling: $24,980 left.

Now, let’s deduct a notional capital gains tax of 25% on the gain itself ($14,980).

The tax would be $3,745, leaving a gain of $11,235 and total capital after exiting the position of $21,235.

So when all is accounted for — annualization, broker fees and taxation — you’re investment, while you might have liked the sound of 150%, has returned you a 37.45% annualized return of $3,745 over three years.

How Navexa Gives You a Clearer Picture of Portfolio Performance

The Navexa portfolio tracker platform is designed to help you quickly and easily see your portfolio’s true performance.

That means, your annualized return taking into account dividend income, broker fees and taxation.

Cherry picking results to brag about — like the 150% above, for instance — might seem like a good idea.

But the reality of investing is that you must be blunt with yourself about the costs of making money in the markets.

That means not ignoring the key factors we all have to work with when we buy and sell stocks: Capital gains, dividend income, trading fees, tax obligations and, above all, time.

Categories
Financial Literacy Investing

Finding Financial Freedom By Creating Passive Income

Financial independence or ‘freedom’ is the ultimate goal for many. But what is it, exactly? We take a look at the role of passive income and intelligent financial management in building financial freedom.

Building a passive income is something many people dream of, but few achieve.

For those who do manage to build a passive income, enjoying true financial freedom becomes more realistic.

It’s easier than you think to build a passive income stream.

Before we get into that though…

What is Financial Freedom, Exactly?

The truth is that financial freedom means different things to different people.

One person might say they only need a million dollars to feel financially free.

Another might say a billion.

Generally speaking, though, financial freedom means collecting a comfortable income from your money, instead of having to trade your time for money.

If you have enough savings, investments and liquid funds available to live the lifestyle that you and your family want, then you have financial freedom.

In other words, you might say it’s having the ability to choose how you spend your time, rather than having to devote your time to making money.

Few people achieve that goal.  

A survey by GoBankingRates found that 69% of Americans have less than $1,000 in their savings accounts.

In Australia, savings.com.au reports that about half the population has less than $10,000 in savings.

Saving for a rainy day is the first and most important step to financial freedom.

Think of it as the foundation for financial freedom.

Once you’ve created a firm foundation, you can start to look at building up passive income.

What Are The Best Ways
To Earn Passive Income?

The idea of having a passive income is often dismissed as a ‘get rich quick’ scheme.

Perhaps that’s because many people don’t like the idea of parking a substantial amount of money in an investment for a long period of time.

The truth is that passive income is the opposite of ‘get rich quick’.

It’s more like ‘get financially free slow and steady’.

There are, however, ways to make the money you are already earning work harder for you and generate a passive income through interest or an investment portfolio.

The average annual return of the stock market over a 10 year period is 9.2%.

That’s far higher than a typical savings account.

If you follow the golden rule of personal finance and pay yourself first by saving some money — even a small amount of money — then the returns you’d see investing in the stock market over the long term could be life-changing.

Imagine you invested $70 per week, every week, for a decade.

With returns of 9.2% per year, compounded, your $33,600 deposits could earn an extra $21,726 in interest, making them worth $55,396.

That’s a pretty impressive return for a relatively modest investment.

The 20-odd grand of interest is your passive income.

If you were able to invest $10,000 a year for 20 years, for argument’s sake, you can see how you’d create a substantial passive income over time.

This long-term, passive income-focused investing can become the path to financial freedom.

How Much Money Do You
Need To Be Financially Free?

Financial independence is a very personal thing. How much money you need depends on your own lifestyle.

In general, if you want to be able to live off the interest on your savings you should aim to be drawing down no more than 4% per year.

So, you should aim to save enough to be able to do that.

If you want to withdraw $40,000 per year, you would need savings of $1 million.

If you live more modestly, you could get away with smaller savings.

Do I Have To Be Rich To
Achieve Financial Freedom?

You don’t have to be rich to start saving.

Simple things like cutting your outgoings and building a modest emergency fund can help you avoid expensive borrowing.

Once you have a safety net you can start investing while looking to increase your income.

Even if you feel like the amount you can save now wouldn’t make a difference, it’s worth making a start.

Consider the snowball cliché.

Even the greatest avalanche starts with a single flake.

And if you’re serious about investing to create passive income and financial freedom, platforms like Navexa give you the tools you need to make intelligent decisions for your portolio.

Categories
Financial Literacy Investing

What If You Were Building Wealth From Scratch?

The times they are a changin’. Our need to build wealth is not — but the way we do it is. Here’s some ideas on how (and why) to begin investing now.

Maybe you’re 19 years old and have yet to pop your investing cherry.

Maybe you’re 29 years old and the penny has finally dropped that grinding out a 9-5 job for the next 30 years will bring you more misery than financial security.

Maybe you’re 39 years old and you need to recover having just lost a substantial chunk of capital in the markets.

Whatever the scenario, we’re going to take a look at the investing and personal finance landscape as it stands in mid 2020 and explore a couple of approaches for building wealth from at, or near, zero.

There are some aspects to investing that haven’t changed in hundreds of years.

But there are other parts of the wealth building process that are changing faster than ever before.

If you’re starting out building wealth in the financial markets today, you face a significantly different set of challenges and opportunities than you would have 50, 20 or even just five years ago.

In 2010 index funds were all the rage.

Today, just 10 years on, cryptocurrencies, private equity, micro investing and fintech are driving innovation and disruption to the point where, to many, index funds seem boring.

Starting from scratch today is a different beast on that basis alone — leaving the major economic fallout from COVID-19 aside.

So let’s start with the basics.

The Best Time To Begin Is Always Now

Whenever you begin investing, and at whatever age, your most powerful ally (or adversary) is time.

Anything you do in life requires time.

In investing, how you spend your time is particularly important.

You’ve probably heard the statement that time in the market is more powerful than timing the market.

This refers to the generally accepted idea that on a long enough timeline, stock prices go up.

In a two year period, the market might fall 50%.

But over a 20 year period, the market will probably rise 150% to 200%.

If you’re wondering whether to begin your investing journey now, the answer is yes based on that idea.

Check out this example from The Street to see why.

Take two 25-year olds.

The first commits to investing $5,000 a year for 11 years.

Total starting capital: $55,000.

The second waits until they are 35 to begin investing $5,000 a year and keeps doing so until age 60.

Let’s assume an annualized rate of return of 8% on their invested wealth.

The one who started at 25 invests $55,000.

The other invests $130,000.

Looking at that, you’d assume the second investor would gain the most, having invested more than double what the first did, right?

Well, check this out.

At 8% a year, the first investor has grown their portfolio to $615,000.

It’s taken 35 years to generate $560,000 in profits (forgetting brokerage fees and taxation for the purposes of this example).

The second investor, on the other hand, who started 10 years later but invested over 26 years instead of 11, has grown their portfolio to $430,000 from a total investment of $130,000.

Despite investing more money, they’ve made just $300,000 in profit — more than a quarter of a million dollars less than the one who started at age 25.

That, in a nutshell, is the supreme power of time in building wealth.

That’s why we say there’s no better time to start than now (providing your personal financial situation allows it, of course — this is not personalized financial advice!).

The way that time works for you when you start right away is that your returns compound.

If you leave your money and the returns it generates in the market, then you start making returns on top of those returns.

The more time you allow for this process — which Einstein called the eighth wonder of the world — the more you can benefit from it.

And on the topic of time…

Starting Early Allows You To Be
More Aggressive In Your Investing

If you are in your early 20s, for instance, you have about 33% more time — in theory —  before the notional retirement age of 60 to go about building wealth.

That’s 33% more time you can use to experiment, learn and refine your investing style.

It’s also extra time you can use to recover from any losses you might incur from investing in higher risk assets — like small caps, speculative tech stocks, cryptos and options.

Higher-than-average risk assets can sometimes bring higher-than-average returns.

If you get up and running early in life, you might find you can make some big returns by tolerating the higher risk.

But even if you’re only getting started in your 30s, you might want to allocate a small amount of capital to trying to win big in cryptos or options.

Generally, though, you probably won’t want to take on as much risk, as you’ll have less time — in theory — to recover from any losses your capital suffers.

Whenever you’re starting though, you should:

Cultivate Financial Literacy And Discipline

The saying ‘knowledge is power’ is a cliché. But it is so for a reason.

Because in many senses, it’s true.

In investing, it is especially true.  

In order to take $10,000, or $50,000, or $150,000 and multiply it 10 or 20 or 50 times through investing, you’re going to need to obtain and interpret a lot of knowledge.

Knowledge about the markets, the world, financial technology, business — basically everything.

Becoming financially literate will elevate your knowledge about the world and consequently your ability to navigate your wealth through the markets.

It’s a constant process. Read widely, expose yourself to different ideas about making money the constantly changing landscapes of both personal finance and the wider financial world.

Keep An Open Mind
And Let Data Guide You

Beginning your investing journey in 2020 is in some ways no different from if you were beginning in the 1980s.

But in other ways, it’s markedly different.

Today, you have access to more information than ever before.

If you have an internet connection, you have the ability to find out almost anything you like about a market, stock, anything, really.

You also have access to assets that didn’t exist even 15 years ago — cryptocurrencies — and ways of getting into the market that are only possible because of technology.

Micro investing is a prime example of that.

The apps and platforms that allow you to invest pocket change into funds and stocks take advantage of many strands of modern connectivity and financial technology to make investing more accessible and easy to understand.

You may have heard this trend called the ‘democratization of investing’.

This trend is the latest evolution in the history of wealth building.

Combined with the sheer amount of information available, the current state of the investing world means you have more power and knowledge than ever with which to begin your own wealth building journey.

The bottom line is, if you’re starting that journey in 2020, you should take advantage of the centuries of knowledge and research available to you — and the latest technology to help you implement that knowledge in your own investing.

To sum up then, if you’re just starting your wealth building journey…

Start as soon as possible and take advantage of every tool and piece of knowledge you can.

And now, a shameless plug for the platform we’ve designed to help you do just that.

This interplay between knowledge and technology is central to our portfolio tracking platform, Navexa.

We’ve built it to help you empower yourself and inform your decisions with near real-time data and analytical tools that, in decades past, would only have been available to those in the financial industry.

You can sign up free and get access to advances investing analytics and reporting tools, beautiful customisable charts and benchmarking.

Begin your Navexa trial here.