Understanding a stock’s trend is a vital part of trading, and a key focus for technical analysis. This post explains what the zig zag indicator formula is and shows you the basics of how to calculate and use it to identify price trends.
The zig zag indicator is a basic technical analysis tool you can use to determine whether a stock is trending up or down.
This indicator is one of the more simple tools used in technical analysis — the discipline of analyzing charts to make predictions on future price movements.
In this post, we’ll explain:
· How the zig zag indicator works to identify price trends
· How to calculate the formula
· The potential benefits
· Some potential limitations
Plus, we’ll share some examples of technical analysis using the zig zag formula, and other key data you should be looking at for both individual stocks you own and your portfolio as a whole.
This post will give you a good overview of the zig zag indicator and how you can use it to better understand and determine price movement.
It is not intended as financial advice, and we always recommend you do your own research and/or consult with a financial professional before risking your money on an investment.
What Is The Zig Zag Indicator And How Does It Work
The zig zag indicator is part of the discipline of technical analysis.
Technical analysis involves interpreting historical data about a security from its price chart in an attempt to determine a pattern, which in turn might give you an idea of where the price is likely to go next.
Traders use the zig zag indicator specifically to eliminate the ‘noise’ of day-to-day market conditions and price movement, and get a clear picture of whether a security’s trend is reversing.
The zig zag indicator allows you to make points on a price chart wherever the price reverses by more than a given percentage. The most common percentage threshold for selecting these points is 5%.
So for every instance on a chart where the price shifts from either down to up, or up to down, by more than 5%, you make a point.
Once you’ve found all the points that qualify on the chart you’re looking at, you draw lines between each adjacent point.
Take a look at an example.
The zig zag pattern this creates shows you all the significant changes in trend on the price chart.
By showing you only the trend reversals greater than 5%, the indicator helps you to focus only on the significant ones (which may be useful to you in predicting the next likely trend change) and not on the smaller, less consequential fluctuations.
These significant turning points are known as swing highs and swing lows.
It’s important to know that the zig zag indicator cannot predict future price trends or price movement. Advanced traders use the indicator with both Elliot Waves and Fibonacci projections in predicting likely future price movement.
For the everyday investor, however, this indicator can still be a useful tool in getting a clearer picture of a stock’s past behaviour, volatility and support or resistance levels.
How To Calculate The Zig Zag Indicator For A Stock
Calculating your zig zag indicator is simple.
First, select a starting point. Looking at a historical price chart, you’ll need to determine how far back you want to analyze. Choose a swing high or swing low.
Then, decide which percentage of price movement you want to set as your threshold. Most zig zag analyses use 5%.
Once you’ve set the percentage, find the next swing high or swing low that qualifies by being over that amount relative to the starting point and mark it on the chart.
Draw a trend line (the zig zag line) between the two. Then repeat the process from this new point to the next one.
Remember to calculate the percentage change relative to the previous point.
Repeat this process until the last swing high or swing low on your chart.
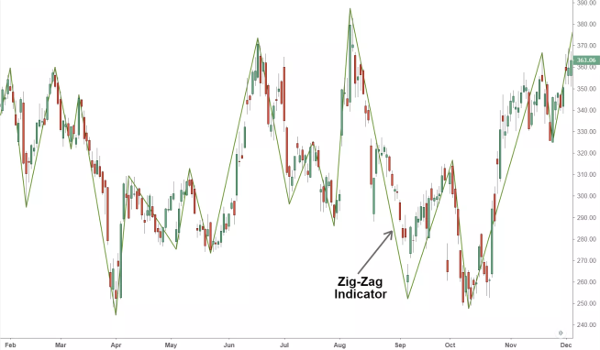
Once you’ve completed the process, you’ll see something similar to this:
Now, you can see the significant swings in the stock’s price — not every single change.
At the right hand side of the chart above, you can see the trend line continues right to the Y axis.
If this chart were up to date, you’d be able to confidently say the stock was currently trending upwards.
You could continue analyzing it day to day — or hour to hour if you’re an active trader — until you identified the next swing high or swing low point, allowing you to potentially exit a trade before the price fell further.
Zig zag Indicator Main Points
- Calculate the points at which the price reverses by more than a minimum percentage.
- Rule straight lines between each adjacent point.
- Add further trend lines and analyses overlays to augment the zig zag indicator with other technical trading tools.
More Examples Of Stocks Analyzed With The Zig Zag Indicator
Overlaying the zig zag indicator onto a price chart helps you to see more simple trends and patterns in what can be confusing collections of noisy information.
Finding the points and plotting the zig zag between them is only part of the process for many traders, though.
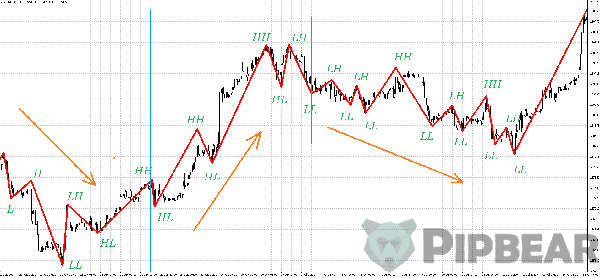
Take a look at this chart:
You can see the zig zag line in green. And you can see two more lines, in black.
The trader here has drawn these by ruling along the upper and lower points on the chart.
These black lines show resistance and support levels. Resistance and support are central ideas in technical analysis and trading.
Resistance is the price at which an uptrending stock is will likely pause before breaking through due to supply levels. Support, on the other hand is the opposite — the price at which a downtrending stock will likely pause due to demand levels.
In other words, a stock might struggle to get beyond a certain price because many investors will sell at or near that price. Conversely, it might struggle to fall below a certain price because investors will try to buy around that price.
Moving averages and trendlines — like the zig zag indicator — are key tools traders use to determine these levels, as you can see above.
Using The Zig Zag Indicator To Spot Trends & Breakouts
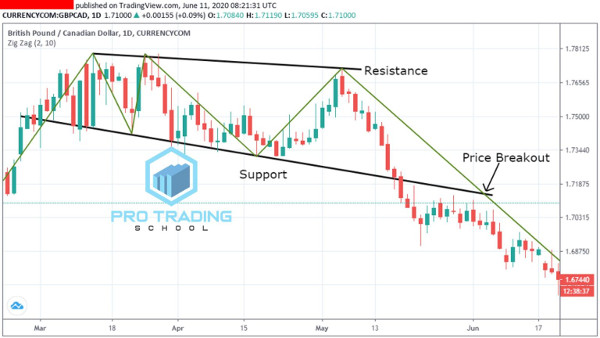
Now let’s look at another example of the indicator at play in a chart.
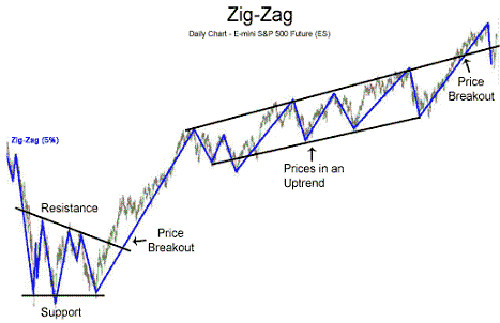
In this example, the trader has not only added support and resistance levels based on their zig zag trendline. They’ve also made notes of trends and breakouts.
When a stock price passes a support or resistance line, it can be said to be ‘breaking’ higher or lower.
You can see in the lower left part of the chart the note ‘price breakout’. This shows you where the trendline has passed the resistance line, indicating a new break higher.
After breaking higher, there’s a flurry of new swing highs and lows, which the trader has annotated with new resistance and support lines and the note ‘prices in an uptrend’.
These are just two examples of how the zig zag indicator can be useful in the technical analysis of a stock price chart.

The Benefits Of Using This Type Of Analysis In Your Investing Strategy
The zig zag indicator has several potential benefits. But they only apply if you’re confident with using technical analysis in your investing or trading.
If you’re more of a passive investor (someone who’d rather put their money in an ETF and leave it alone for a long period), or, say, a value or fundamental investor, the zig zag indicator might not be useful to you.
Here are three potential benefits to using it:
1. Block out noisy short-term price movements and see the significant ones: It can be easy to get caught up in every single price move a stock makes. But not every move demands you buy or sell. Even the best performing investments probably won’t go up every single day. By using the zig zag indicator, you can focus on the meaningful swing highs and lows — the points at which the price really changes direction, rather than just fluctuating as a result of regular trading.
2. Pair it with other analyses: As you can see in the charts above, using other technical analyses tools allows you to leverage the indicator further. You can see resistance and support levels, and get an idea of the price a stock needs to move above or below in order to break higher or lower — or trade within to remain in a trend.
3. Zoom out and see a bigger picture: In a week, a stock might have several swing highs and swing lows. But paired with resistance and support lines, plus other more advanced technical analysis tools like Fibonacci levels, you can use the indicator to get an idea of a stocks longer term patterns and trends.
There are many types of trading strategies that may benefit by employing the zig zag indicator — especially swing and momentum trading.
Why You Should Use Caution Before Deciding To Invest In A Company Based On Zig Zag Indicator Analysis
Like any trading strategy or stock analysis tool, the zig zag indicator is not going to give you any guarantees regarding the likely success of an investment.
It’s a trend following indicator. That means it works on historical data. And while it’s a very useful tool in analyzing past price action, it’s never going to predict what a stock might do next.
In this respect, it’s more of a confirmation tool — albeit a very illustrative and educational one.
If you’re using the indicator in your own investing, be sure to pair it with other forms of analysis and research. And, of course, always be aware that no matter what a trend following indicator — or historical price action — might suggest, you do always risk losing money when you invest it.
Additional Resources Available Online About The Zig Zag Indicator
There’s plenty of good resources about the indicator online to help you learn more.
Here’s a detailed breakdown that explains the basics, strategies for deploying it and several examples of the indicator in use.
This page explains the parameters of the zig zag indicator, and some of the things using it can tell you about a stock’s price action and trends.
Since the indicator is a part of technical analysis, you might want to read this introduction to technical analysis itself.
Level 2 Market Data: How Traders See Market Moves Before They Happen
Imagine knowing how many traders were placing orders in a stock before those orders were fulfilled.
That’s the power of level 2 market data, which, if you’re using the zigzag indicator, or looking for a swing high and swing low in a chart, may come in handy.
We explain how to read and apply level 2 market data here.
Pro Tip: Automate Your Portfolio Performance Tracking
Whatever investment or trading strategy you use, you should always correctly track and analyze your investments’ performance.
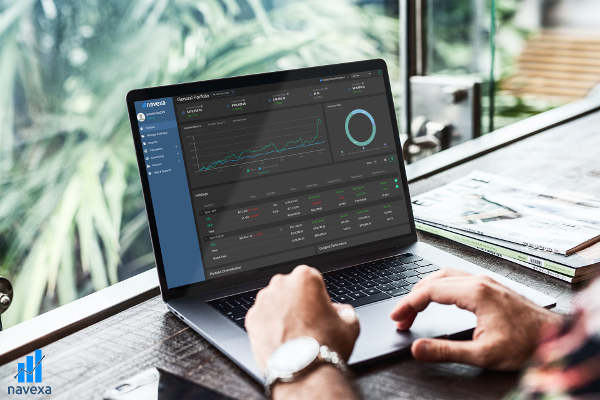
The Navexa portfolio tracker tracks stocks, ETFs, cryptocurrencies and unlisted investments together in one account.
Navexa lets you track everything together so that you can track, analyze and optimize your investment performance over time.
With a Navexa account, you’ll receive weekly and monthly email updates on how your portfolio is performing, plus powerful tax reporting tools that make recording and reporting your investment taxes quick and easy.
Plus, Navexa allows you to apply different tax strategies to your investments, meaning you can better control the amount of tax you’ll owe when you sell holdings.
You can access charts of your individual holdings and your portfolio as a whole. If you’re using the zig zag, you could apply it to your entire portfolio to identify historical trends and swings.
Plus, you can drill down on your portfolio diversification, contributions and more — giving you a greater depth of insight into how your investments are performing together and relative to each other.
Create Your Portfolio Performance Tracking Account Free Today
Whether you’re using the indicator as part of a trend following, swing trading or day trading strategy, having access to quality charting and data on your investment and portfolio performance is crucial.
You can try Navexa for free for up to 14 days when you create an account today.
Sign up, add your portfolio securely, and see your true portfolio performance using all our members-only reporting and analysis tools.