September 8, 2024
Teetering stocks & the harsh reality of not owning them
Dear Reader,
This week’s email is a shameless chart party.
One of our team here at Navexa kindly shared a treasure trove of fascinating charts with me recently, which led me down many different and thought-provoking rabbit-holes.
First up, take a look at this:
Risk is was back on the menu, boys
Source: https://www.chartstorm.info/p/weekly-s-and-p500-chartstorm-20-may
What you’re looking at above is evidence that Wall Street’s appetite for risk has returned after a couple of years of fear and uncertainty.
At least, that’s how it looked at the end of May.
The S&P Global investment manager index had measured risk appetite and near-term market outlook returning to late 2021 levels.
Stocks were at or near all-time highs, and institutional investors were brimming with optimism.
Callum Thomas, who runs ChartStorm, noted that we’re in a ‘cyclical bull market’:
‘The takeaway or bullish suggestion would be that this cyclical bull is relatively normal, and also mid-lower pack… and most of all, looks like it still has time and space to go up to the right if history is any guide.’
Three months later, however, you can see just how fast sentiment can swing in the stock market:
Tech stocks flirting with bearish trend
Source
Callum says of the chart above:
‘After failing to breach that key overhead resistance level, tech stocks have rolled over again — at this point now notching up a lower high. From a classical technical analysis standpoint this is not a good sign, you want to see a series of higher highs and higher lows to be confident in the bull trend, whereas a transition to lower highs brings into prospect the possibility of a bear trend establishing.
‘To remain constructive at all on tech stocks and by extension US equities as a whole, it is going to be critical for the Nasdaq to avoid making a lower low (and avoid breaching that rising bar of the 200-day moving average).’
I try, in this email, not to get too caught up in dangerous short-termism.
Stocks are going to do what they’re going to do. Up one day, down the next, irrational exuberance and panic dished out by turn as the great financial circus constantly unfolds.
So let’s zoom out now and go big picture.
Check this out:
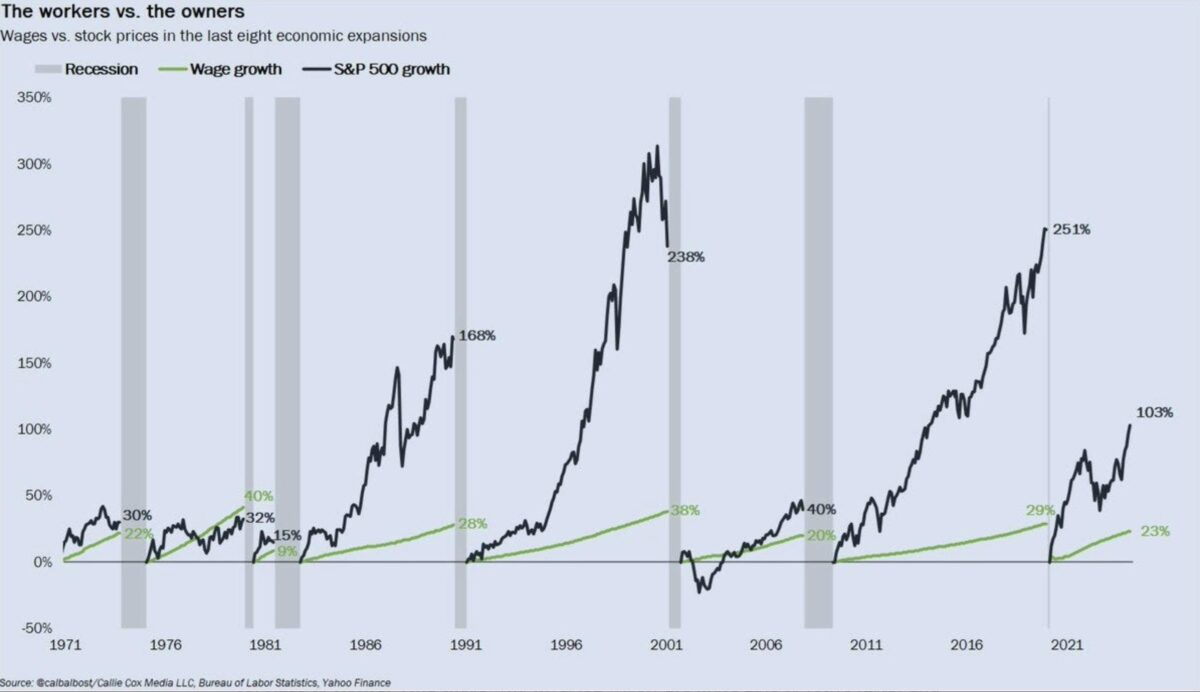
Wage growth vs. stock market growth
Source
Work a job, earn money, save some, invest some, retire comfortably, right?
That used to be the dream for most people. For some, it perhaps still is.
But what you see on the chart above is the reality of working for money, versus putting money to work in the markets.
In the 1970s and early 1980s, wage growth more or less kept up with stock prices — in the late ’70s even beating the stock market’s performance by nearly 10%, imagine that!
But after that, as you can see, the stock market left wage growth in its dust.
From ’91 to ’01, there was a 200% difference.
Across the half-century of data represented in the chart, its clear that those who owned stocks built many times more wealth than those who relied solely on income from a job.
And speaking of jobs, here’s a lesser-talked about aspect of the relationship between the stock market and the employment market.
82% of U.S. jobs are not on the S&P 500
Source
There are 158 million people employed in the U.S. economy.
But only 29 million, or 18%, of them work for S&P 500-listed companies.
In other words, most of the U.S. workforce is employed outside of the biggest companies in the country — meaning the vast majority of the economy is in private, rather than public, markets.
Why is that? Ben Carlson shared a brilliant Sam Ro chart a while back that sheds light on this:
Source
Ben notes:
‘The stock market is mostly corporations that make and sell things. The economy is mostly the stuff we do with those things. Most of the time the stock market and the economy are moving in the same direction but they also diverge on occasion. The S&P 500 also receives roughly 40% of revenues from overseas. For technology stocks, that number is closer to 60%.’
And now, to our final chart of this week’s email.
This one might surprise you.
Buffett’s (relatively) late bloom as billionaire
Source
We tend to think of Warren Buffett as supremely wealthy. Which he is.
But we also tend to presume he was always supremely wealthy.
As you can see on the chart above, this is simply not the case.
Warren didn’t crack a billion-dollar net worth until he was more than half a century old.
It took him until his early sixties to hit five billion.
But then the power of compounding really started to go to work, and Buffett’s net worth began climbing steeply.
While the chart only goes up to 2019, today, Warren is worth about $139 billion.
He’s built that wealth, of course, by buying and holding shares in the highest-quality companies in the world (and by selling shares in his legendary holding company, Berkshire Hathaway).
Imagine what his net worth might be today had Buffett worked a job, instead of buying stocks and building businesses?
Now, if, like Warren, you’re building wealth by investing in the stock market, you’re going to need some specialist knowledge re: tax.
Specifically, you’re going to need to understand capital gains tax to a far greater degree than the average tax-payer.
Because, as you’re about to see, far too many investors get caught out by the three CGT lies Navarre exposes in his latest video guide.
Click the player to watch:
That’s it for The Benchmark this week.
Forward this to someone who’d enjoy reading.
If one of our dear readers forwarded this to you, welcome.
Until next week!
Invest in knowledge,
Thom
Editor, The Benchmark
Unsubscribe · Preferences
All information contained in The Benchmark and on navexa.io is for education and informational purposes only. It is not intended as a substitute for professional financial or tax advice. The Benchmark and any contributors to The Benchmark are not financial professionals, and are not aware of your personal financial circumstances.