Compound annual growth rate, or CAGR, is one of the key methods for calculating investment performance. Here’s how to calculate it manually — and a fast way to automatically see an investment’s compound annual growth rate.
CAGR, or compound annual growth rate, is a method investors use to measure the annual growth rate of an investment. Generally it’s only used for portfolios that compound their growth by generating income which is in turn subject to capital appreciation.
While it’s not the only method of determining an investment’s long-term annual returns, it is one of the most popular. As we’ll show in this explainer, CAGR has advantages and disadvantages — which is why the Navexa portfolio tracker allows you to compare CAGR-measured performance with other calculation methods.
What Is Compound Interest?
To understand CAGR and its possibilities, you should first understand how compound interest works. Compound interest is what happens when money accrues interest, and that interest then accrues more, and so on. Basically, it’s an interest you earn on interest.
On the opposite end, there’s simple interest. This type of interest represents financial gains an investor earns just on the principal portion of the loan or their initial investment. In other words, simple interest is limited to one earning cycle — it leaves out interest earning more interest.
Compound interest is what happens when money accrues interest, and that interest then accrues more.
Definition of Compound Annual Growth Rate
Compound annual growth rate is defined as the rate of return required for an investment to grow from its starting balance to the ending value. It’s used when profits are reinvested at the end of each period.
With CAGR, investors can compare the present value of two or more stocks, and see which one has performed better over a certain timeframe.
CAGR calculates past performance. Furthermore, the compound annual growth rate isn’t the same as the true rate of return. Instead, CAGR is a metric used to determine how an investment may perform in the future, based on past performance.
Investors use CAGR as an estimate, rather than the exact measurement of the portfolio performance. It’s important to understand that neither CAGR, nor any other performance calculation methods, are any guarantee of future performance.
Other Growth Metrics to Know
Here are some other metrics investors use to help measure their journey.
Year-over-Year (YoY) Growth compares the changes in annualized metrics at the fiscal year-end date.
Month-over-Month Growth (MoM) compares the changes in the value of a metric at the end of the current month compared to the past month.
Last Twelve Months (LTM) is the timeframe of the immediately preceding 12 months, often used to evaluate a company’s performance.
Reinvestment Rate is the expected return that occurs after the reinvestment of the previous gains.
What Is CAGR Used For?
The CAGR is used to calculate an investments’ performance when compounding gains, or interest, are taken into account. It presumes profits or income will be reinvested, and gives a representational figure, which, as you’ll see shortly, has benefits and limitations as far as understanding performance.
CAGR is useful for understanding long-term performance in that it smooths out the effects of volatility. If an investment is up 10% one year and down 5% the next, then up 4% the next year, CAGR shows the long-term trend.
CAGR presumes profits or income will be reinvested, and gives a representational figure
Benefits and Downsides of CAGR
There are many advantages of using the compound annual growth rate formula:
It’s one of the most reliable ways of calculating ROI for compound interest.
Helps compare stock performance in different time periods.
Can be used for each investment separately.
Fixes the limitations of the average return calculation.
Works better for short-term calculations.
Some of the CAGR calculation’s limitations:
Doesn’t account for investment risks.
Implies a constant growth rate, which is not always the case.
Can’t be used to measure the profitability of an asset’s inflows and outflows.
Ignores market volatility.
CAGR Formula
To calculate CAGR, investors divide the value of the investment at the end of the period of time (EV) by the value of the investment at the beginning of the period (BV).
The next step is to raise the result to an exponent of 1 divided by the number of years (n).
Then, subtract one from the result.
To get the percentage, investors multiply the result by 100.
The complete formula looks like this:
CAGR = (EV / BV) ^ 1/n – 1 x 100
Modification of the CAGR formula
Investors have to modify the CAGR formula to get the correct data on their investments.
They need to know how long they’ve been holding a particular asset. To get this number, investors calculate how many days they held an asset for the beginning and the end of the period, then take into account all the other “complete” years, shown in days.
For example, someone held the investment for 300 days during the first year, plus three years (equals 1,095 days), then exited the position after 200 days in the last year. Their total holding period is 300 + 1,095 + 200 = 1,595 days.
To get the years, divide by 365, which makes 4.369.
They can then use this number in the CAGR formula, where n = 4.369
CAGR Calculated via Excel Spreadsheet
Some investors like to track their stock performance via an Excel spreadsheet. It’s possible, but not as easy — Excel requires that they use “RATE” (used for calculating the rate of return), and the “COUNTA” function (counts the number of years) to get the desired value.
However, there’s an easier way to calculate compound annual growth rate, using the CAGR calculator online.
CAGR Calculator
An online calculator is a simple solution to calculate an investment’s compound annual growth rate. Online calculators are straightforward, and investors get results immediately.
But, if you don’t want to deal with any calculations, Navexa is here to help.
Navexa: Automatic CAGR Calculations
Sometimes, calculating CAGR requires collecting a lot of data from your portfolio. The Navexa portfolio tracking platform can calculate investment performance using multiple formulas. Just upload your portfolio, and Navexa will do all the work for you.
Once you finish uploading your holdings, you can toggle between “Simple” and “Compound” and the platform will provide you with detailed performance metrics.
With Navexa, there’s no need to question whether the CAGR calculator is correct. You’ll get the data instantly within the app, so you know how your portfolio performs.
Example of CAGR Formula
If you’re still struggling to understand how compound annual growth rate works when using a formula, here’s an example.
Let’s say a company has a revenue of $100 million at the end of year 0.
Three years from then, the company is projected to reach a revenue of $150 million.
To start calculating, you should ignore the initial year (year 0), as the formula only takes into account the compounded revenue. To get the initial balance, subtract the beginning period (year 0) from the ending period (year 3).
Proceed to enter the following data into the compound annual growth rate formula:
Beginning Value = $100 million
Ending Value = $150 million
Number of Periods = 3 years
In this case, the annual growth rate CAGR formula looks like this:
CAGR = (150 million / 100 million) ^ 1/3 – 1 x 100
Based on this example, the compound annual growth rate is 14.47 %
CAGR vs. IRR
CAGR shows the return of an investment over a specific time period. However, there’s one more calculation you should know about — the Internal Rate of Return (IRR).
IRR also measures growth rate and performance, but in a more flexible way compared to CAGR.
One of the key differences between CAGR and IRR is that CAGR is used for simple calculations. Additionally, investors can calculate CAGR by hand, or with a CAGR calculator.
IRR, is used to show the growth rate of complex investments. IRR is used with portfolios with various cash inflows and outflows. If you want to measure IRR, you’ll likely need a powerful calculator or an accounting system.
IRR is often used for an investment that can’t be managed with a CAGR calculation.
CAGR shows the return of an investment over a specific time period. IRR also measures growth rate and performance, but in a more flexible way compared to CAGR.
CAGR vs. AAGR
Average Annual Growth Rate (AAGR) is another performance calculation. While CAGR accounts for the compound annual growth rate, AAGR doesn’t. Instead, it’s a linear measure that shows the average annual return.
What is Risk-Adjusted CAGR?
The risk-adjusted formula helps the investor determine whether a certain investment is worth the risk. With this method, investors measure and compare the generated returns and risks. This gives them an idea of the potential ending value of their portfolio.
Risk-adjusted CAGR requires a bit more calculation, and is more advanced. This is because it takes into account the standard deviation figure — a measure of volatility, which is different for every asset.
Calculating risk-adjusted CAGR is done by multiplying the CAGR by 1 and subtracting the standard deviation. In case the volatility number is 0, CAGR remains the same. However, with a higher standard deviation, CAGR gets lower.
This formula helps investors compare multiple investments and decide which one can provide the highest likelihood of returns for the desired time period. Again, no calculation method is ever going to protect against investment risk or predict future performance reliably.
How Investors Use CAGR
There are many ways to use CAGR in investing. The first is to determine the rate of return and likely future value of an investment.
Additionally, CAGR helps investors set objectives and calculate the rate they need to successfully grow their investment. This is especially true for risk-adjusted CAGR. This formula includes the risks related to a specific investment, which helps determine future growth rates.
The CAGR formula is also an ideal way of comparing multiple investment opportunities. Using it to forecast future value helps investors make strategic decisions.
The Importance of CAGR for Companies
Investors aren’t the only ones calculating growth rates and dealing with CAGR. Business owners and CEOs also utilize CAGR to determine company performance.
Finally, CAGR is crucial for companies that plan to give out dividends to shareholders, as it shows the company’s (positive or negative) performance between two different years.
What is Considered Good CAGR?
Generally speaking, a CAGR of 15% to 25% for the period of five years would considered a good compound annual growth rate for stocks and mutual funds.
However, if the CAGR were lower than 12% for stocks and mutual funds, investors might gravitate towards other opportunities, such as real estate or other securities.
See Your CAGR & Simple Returns in Navexa
Compound annual growth rate (CAGR) is one of the methods investors measure the performance of their holdings. The formula is fairly simple, but it doesn’t account for market volatility and investment risks, unless you use a risk-adjusted one.
The CAGR formula can only be used for compounding investments. Compound annual growth rate is different from AAGR, which simply shows the average change for one year. Many investors prefer CAGR since it smoothes out the year-by-year volatility in growth rates.
Among many other features, Navexa also offers CAGR calculations based on uploaded portfolio data. Simply toggle between ‘Simple’ and ‘Compound’ to get accurate data instantly. To check out how it works, register today and start your free trial.
Time-weighted return is one of the most popular ways of measuring investment performance and calculating returns. We explain how to calculate TWR and explore other key methods of tracking portfolio performance.
It can be challenging for investors to find the best method of measuring portfolio performance and investment returns. The time-weighted return is on of the most common ways of doing so.
Besides a simple rate of return, there’s the time-weighted return (TWR) method. It’s among the most common formulas used to track investment performance. In short, it accounts for moments when cash flows occur, and creates sub-periods to help investors track growth rates.
Keep reading to learn how bankers, investment professionals, and portfolio managers use a time-weighted rate of return to evaluate investment performance.
Impact of Inflows and Outflows of a Portfolio
Cash flows are vital to time-weighted returns
Before diving into the time-weighted return, it’s crucial to understand cash flows. Cash flows are an important part of calculating portfolio performance. They also make a difference in which method experts use, because each performance calculation treats inflows and outflows differently.
Cash flows, or inflows and outflows, represent the total money transferred into and out of one’s portfolio — deposits and withdrawals. The example of inflows includes proceeds from the selling the asset. Outflows can be payments for buying a stock.
Cash flows can be used to define a sub-period, and the method that will be used to calculate the rate of return — the money-weighted rate of return, or time-weighted rate of return formulas.
If someone invested money and never made any withdrawals from their portfolio, calculating the rate of return on their investments would be easy. Any method would give the same result, since there were no outflows and inflows to observe across the sub-periods.
Still, this rarely happens in practice, and cash flows are always present. Investors may make changes in their portfolios daily, and calculating the weighted rate of return can be challenging. Since each method (TWR, RoR, MWRR) handles these cash flows differently, each will give a different performance number.
Here’s what you should know about the time-weighted return.
What Is the Time-Weighted Return?
Time-weighted returns are one measure of compound growth.
Time-weighted return (TWR) is a method of measuring the compound growth rate of one’s portfolio. This method is designed to help investors eliminate the distorting effects of deposits and withdrawals.
TWR breaks up the investment performance into sub-periods, based on the moment when the money was added to, or taken out of, the account. Then, it provides the rate of return for each interval with cash flow changes.
Is Time-Weighted Return Correct?
By isolating the intervals based on these inflows and outflows, TWR provides more accurate numbers than simply subtracting the beginning balance from the final value of the portfolio.
Additionally, the time-weighted rate of return formula multiplies the returns for each sub-period, links them together, and shows how the returns have compounded.
The time-weighted rate assumes all gains are reinvested in the portfolio.
This method is also more commonly used by fund managers, or bankers, and not private investors. This is because fund managers usually don’t have control over cash flows, but still need some way to calculate portfolio performance and returns for their clients.
Can Time-Weighted Return Be Used to Compare Investments?
Some experts argue that TWR shouldn’t be used to compare investment performance, and that the money-weighted rate of return formula (equal to IRR) is a better measurement for comparison. This is mainly due to the complexity of its formula, which is not ideal for regular investors.
However, TWR remains preferred among fund managers and finance experts who don’t have control on the cash flows in the portfolios they manage.
Time-Weighted vs. Basic Rate of Return
The rate of return is one of the simplest ways of calculating the rate of return over a certain period. RoR is shown in percentage and represents the change from the beginning of the holding period until the end.
RoR is not always an accurate measurement, since it doesn’t account for cash flows. However, the time-weighted return calculation is there to eliminate the effect of cash flows, and create intervals based on when the money was added or withdrawn from one’s portfolio.
By isolating each time period, TWR provides more accurate results. In practice, the sub-periods between cash flow events are treated as constituent performance units, which are then combined to give the total performance for the overarching period.
However, there’s another method to compare it with.
Time-Weighted vs. Money-Weighted Rate of Return
Money-weighted rate of return accounts for timing and size of a portfolio’s cash outflows.
Money-weighted rate of return (MWRR), which is equal to an internal rate of return (IRR) is another performance measurement method.
While the time-weighted method factors in the moment of change, creates the period for each change, and calculates period return, MWRR accounts for both the timing and sizes of cash outflows, such as:
The cost of a purchased investment
Withdrawals
Reinvested dividends
It also accounts for inflows:
Received dividends
Deposits
Sale proceeds
Contributions
The key difference between TWR and MWRR is that MWRR doesn’t create time periods based on cash flows like the TWRR. This means that any cash flow within a time period can impact MWRR. If there’s no cash flow, both methods should provide similar results.
Money-weighted rate of return is a more complicated, but more accurate measurement of investment performance. This is also the most appropriate way to measure the return on investment.
The Importance of the Time-Weighted Return
Since the time-weighted return is based on cash flow, but used to calculate the period return for each interval, it’s usually used as a reflection of the investment strategy. Investors find it’s easier to calculate returns once the performance is broken down into sub-periods.
The TWR method helps them further isolate cash flows for each period and gain more accurate results. Plus, the TWR multiplies each sub-period, and shows how the returns compound over time.
This performance method is crucial for investment managers, since they don’t have control over cash flows in the portfolios they manage.
What Does the Time-Weighted Return Tell?
Since TWR is used to generate sub-periods and link them, it’s one of the best methods to see how the returns compound over time. When calculated correctly, TWR also shows the results of an investment strategy. It strips the impact of cash flows, and reveals pure investment performance.
How to Calculate Time-Weighted Return
Investors and fund managers who calculate time-weighted return start by calculating the rate of return for each sub-period. This is done by subtracting the ending balance from the initial value.
Then, they divide that difference by the initial value of the holding period.
The key is to create a new sub-period for each cash flow, and calculate the RoR for each of these.
Investors then add “1” to each of the return amounts. This simplifies the calculation of negative return numbers, and assures the formula works correctly.
Then, they multiply the rates of return for each sub-period, and subtract “1” to yield the time-weighted return.
TWR Formula
TWR = ((1+HP1) x (1+HP2) x (1+HPn)) – 1
TWR = Time-Weighted Return
HP = (End Value – (Beginning Value + Cash Flow)) / (Beginning Value + Cash Flow)
n = Number of Periods
HPn = Return for sub-period n
In addition to the basic TWR formula, two other calculations can clarify the portfolio performance — Simple and Modified Dietz methods.
Simple Dietz method
Since TWR doesn’t account for cash flows that likely occur during the holding period, the Simple Dietz method can be used to address this. This method assumes that cash flows occurred either at the beginning, middle, or the end of the measured periods (day, month, or year).
It compensates for external cash flows. The formula is:
R = B – A – C / A + C/2
R = rate of return,
A = beginning market value
B = ending market value
C = net external inflow during the period
Modified Dietz Method
The Modified Dietz Method is the most common way of calculating time-weighted returns.
The Modified Dietz method is also the most common way of calculating TWR. However, it’s not perfect, and may skew the results in certain circumstances.
Issues with timing
One of the main issues with calculating portfolio performance is the assumption that all transactions happen at the same time within each sub-period. If the sub-period is one day, we calculate the data as if all transactions happen at the beginning and end of the day.
This can lead to errors, as sometimes the change in the portfolio is equal to zero and we can’t apply some formulas. In such cases, experts would have to further adjust the Modified Dietz method for better results.
Issues with negative or zero capital
The average capital is usually positive. However, if a larger outflow occurs, the average capital could go to zero or become negative. This can cause the Modified Dietz calculations to show a negative balance when there’s an actual profit, and vice versa.
One of the solutions is to catch a moment when the outflow happens, account for it, and use the simple returns calculation for specific period returns.
Excel Sheet
Some fund managers like to use Excel to calculate the time-weighted return. They either download an existing template, or use formulas in the sheet.
Others create their own Excel sheet. They enter the portfolio data manually, starting with the beginning and ending values for each period. Then, they calculate the return for each of the sub-period.
To get to the TWR, experts should add 1 to each of the results (to mitigate the negative returns), use the geometric mean function, and finally subtract one at the end. Excel can then turn it into a percentage form.
Automatically Calculating TWR With The Navexa Portfolio Tracker
If you’re looking for an easier way to get the accurate time-weighted return, the Navexa portfolio tracker uses a version of the Modified Dietz method. Our performance calculation accounts for the performance of assets, and the size, and frequency of cash flows for each sub-period.
This provides a clear idea actual investment performance. Simply upload the portfolio data you need to track, and Navexa will calculate the returns. Plus, the tracker will also annualize the numbers for an easier overview.
Navexa does so using live market data from the ASX, NASDAQ, NYSE and global cryptocurrency markets, displaying intra-day pricing and performance.
Advantages of the Time-Weighted Return
There are several advantages to the time-weighted return method. It:
Is a solid indicator of investment performance,
Eliminates the impact of cash flow,
Provides a clear picture of returns after each deposit/withdrawal,
Is suitable for measuring investment managers’ performance,
Links periodic returns.
Disadvantages of the Time-Weighted Return
Due to the complex nature of investing, TWR still has some disadvantages. This calculation can turn out to be challenging when the money moves in and out of the portfolio more often. The common changes may skew the final number, and provide less accurate results.
Additionally, the TWR doesn’t measure how long the money has been invested, or when it was invested. This is why some investors may prefer IRR instead.
TWR is often used to track performance month over month. However, using the TWR is tricky if there’s an increased cash flow occurring within each month or day.
Examples of Using the Time-Weighted Return
The best way to understand how the time-weighted rate of return works is through an example. Let’s say that an investor has the portfolio of this value:
Dec. 31, 2011 — $100,000
Jan. 31, 2012 — $110,000
Apr. 30, 2012 — $103,000
Nov. 30, 2012 — $120,000
Dec 31. 2012 — $135,000
This makes four time periods we should observe:
Dec. 31, 2011 to Jan. 31 2012 (HP1)
Jan. 31, 2012 to Apr. 30 2012 (HP2)
Apr. 30, 2012 to Nov. 30, 2012 (HP3)
Nov. 30, 2012 to Dec 31. 2012 (HP4)
Additionally, this person made a $12,000 withdrawal on March 3, 2012 (occurred during HP2) and a $20,000 deposit on December 20, 2012, (HP4).
Now we should calculate the holding period return for each period:
To get to time-weighted rate of return, we should now add 1 to each of the period results and multiply them together, then subtract one:
( (1 + 0.100) x (1 + 0.0455) x (1 + 0.1650) x (1 + 0.0417) ) – 1 = 0.2840
To get a percentage, multiply the result by 100, which equals 28.4%.
The Navexa Portfolio Tracker automatically tracks portfolio performance using the Modified Dietz Method and money-weighted return calculation.
Summary: Time-Weighted Return Calculation
The time-weighted rate of return is a great method of measuring portfolio performance. It’s a preferred method among financial experts, bankers, and fund managers. The TWR formula focuses on time periods when cash flows occurred, and helps experts calculate growth for each period.
Time-weighted return is considered a standard in portfolio management, but still has some flaws. But by adjusting the calculation, fund managers and investors can overcome these issues, and measure growth correctly.
A money-weighted return, on the other hand, measures compound growth in the value of all funds invested in a portfolio over the evaluation period.
Navexa is one of the easiest tools to use for understanding your returns and portfolio performance. Our advanced performance calculation utilizes the Modified Dietz method.
Not only that, but when you track your performance in Navexa, you can examine performance at both the portfolio and individual investment level, and toggle between simple and compound returns in a single click.
Your guide to calculating capital gains tax in Australia in 2022. From tax rates, CGT events, taxable income and more. Plus, discover four key tax reporting strategies investors use to adjust and optimize their total taxable capital gain.
Paying tax is a part of investing. It has long been a fact of life that a significant portion of our earnings will always be earmarked for payment to the state. This includes capital gains.
Tax is applied to a wide range of earnings including wages, salaries, and investment income from property, shares, and cryptocurrency.
In Australia, the tax rate that is applied to your investment income is known as the Capital Gains Tax, or CGT.
Whether you’re a seasoned investor or just starting out, it’s important to be aware of how CGT works. This article will explain how the CGT works, and how to calculate and report your capital gains in Australia in 2022.
While you can’t avoid paying CGT on your investment income, there are some strategies you should be aware of for minimizing the impact of tax on your capital gains. This blog post examines some of these strategies and provides examples of how they might look.
The Australian tax year, or financial year, runs from July 1 to June 30. This is the period for which you will need to submit your tax assessment based on any income you received during the financial year. This period is known as ‘tax season’.
How Does CGT Work?
The Australian Tax Office (ATO) requires individuals to declare investment activity in their tax return and pay tax on all investment earnings, including capital gains and dividend income.
If you buy shares, invest in property, or hold other investments which you sell at a higher price than what you bought them for, you will have made a capital gain. This means you will be paying CGT.
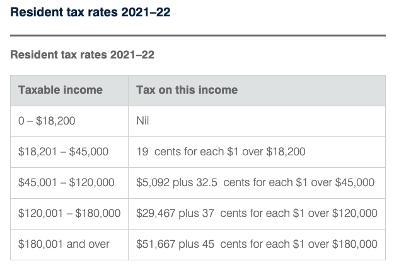
CGT is the tax rate that is applied to net capital gains (total gains minus total losses). It is not a set rate, but is calculated according to your marginal tax rate. This is the tax rate that you usually pay on your personal income, and will be the tax rate applied to your investment earnings.
Capital gains are taxed at an individual’s marginal tax rate
While CGT rates for individuals vary according to their marginal tax rate, flat rates apply for companies and self-managed funds.
Trading companies pay 26% if their annual turnover is less than $50 million, and if it exceeds $50 million, the CGT applied is 30%. Investment companies don’t qualify for the 26% rate and are taxed at 30%. Self-managed super funds are taxed at a lower rate of 15%.
If you sold any assets during a financial year, you will need to work out your capital gain or capital loss for each asset. CGT will need to be paid on your net capital gains.
To calculate your capital gains, you first need to know the ‘cost base’ or original purchase price of the asset. From there, you can work out how much profit you’ve made by subtracting the selling price from the cost base.
Depending on how long you’ve held the shares for, you may or may not qualify for Australia’s 50% CGT discount on investments held longer than 12 months.
The Navexa platform provides an automated solution for making these calculations — more on that later.
That’s how the CGT rate is determined. So, let’s take a closer look at which investments the CGT applies to.
What Does CGT Apply To In Australia?
CGT applies to a wide range of investment income in Australia, including earnings generated from real estate, shares, cryptocurrency, foreign exchange, and collectibles.
When you dispose of an asset for more than what you paid for it, you realize a capital gain which you will have to pay CGT on.
There are a range of other situations that will trigger the requirement to pay CGT. These are known as ‘CGT Events’. A CGT event occurs when an investor makes a capital gain or incur a capital loss on an asset.
The Australian Tax Office (ATO) imposes CGT when you make a capital gain or loss
How Does CGT Apply To Shares?
When you sell shares for more than what you paid for them and realize a capital gain, you will have to pay CGT. When other CGT events occur, you will also have to pay CGT on your shares. Examples include switching shares in a managed fund between funds, or owning shares in a company that is subject to a takeover or merger.
It is important to keep good records of all your share transactions, including amounts and dates of purchase. When you file your tax return, CGT will need to be calculated for any profits you made from selling your shares.
Does CGT Apply To Dividend Pay-outs?
Many Australian investors enjoy investing in companies that pay out dividends (a percentage share of their profits) to their shareholders. But, like other forms of income, dividends are subject to taxation.
Dividends are paid from profits that have already been subjected to Australian company tax. Because the profits have already been taxed, shareholders won’t be taxed again when they receive the profits as dividends, provided that their marginal tax rate is lower than the tax rate paid by the company.
These dividends are described as being ‘franked’. A ‘franking credit’ is attached to the dividend and represents the tax that has already been paid by the company distributing the dividend. The shareholder who receives the dividend with an attached franking credit will either pay less than their usual tax rate, or receive a tax refund.
The general rule is that if your marginal tax rate is lower than the rate of tax paid by a company or fund, you might be entitled to claim a refund. However, if your marginal tax rate is higher than the tax already paid on the dividend, you may have to pay additional tax.
Does CGT Apply To Crypto?
If you were hoping to avoid paying CGT by investing in cryptocurrency, we have bad news for you. Cryptocurrency investment in Australia is also subject to taxation, in a similar way to other investment assets.
In recent years, the cryptocurrency market has grown rapidly, and the ATO has been quick to catch up.
Crypto gains are subject to CGT in Australia.
Cryptocurrency markets have exploded in recent years and the ATO is all over it
As with other assets, CGT may apply in circumstances other than just selling your crypto. The ATO classifies four main CGT events for crypto activity:
You’ll be taxed when you:
Sell crypto.
Exchange one crypto for another.
Convert crypto to a fiat currency like AUD.
Pay for goods or services in crypto.
Just like when you pay CGT at your marginal tax rate when you sell shares, you pay this rate when you sell crypto.
Generally, you could apply the same tax rules to your crypto portfolio as you would for investment in stocks.
You must pay CGT when you realize a capital gain from property. This could include selling an investment property for more than what you paid for it or selling a block of land that you created through a subdivision process.
Your main residence is generally excluded from CGT if you meet certain criteria specified by the ATO:
You will need to have lived in the home for the whole period that you have owned it.
The home can’t have been used to produce income or have been bought with the intention of renovating and selling it for a profit.
It must be on land no greater than two hectares.
If you meet the criteria, you may be able to avoid paying CGT when you sell your house. If not, you may still qualify for a partial exemption. The ATO provides a property exemption tool on their website to help you make the calculations.
In Australia, investors can expect to pay CGT on shares, crypto, property and more.
Capital Gains Tax (CGT) has to be paid on investment income from property
If you acquired property on or prior to 20 September 1985, CGT does not apply. But it will apply to certain capital improvements made after this date. It is also important to keep track of any rental income you receive from property and include it in your tax return. For more details on CGT and property, visit the ATO.
If You Are An Investor, It Pays To Know About CGT
As you can see, CGT applies to a wide range of investment income. When you prepare your tax return, you will need to provide the ATO with your assessable income and any capital gains or capital losses you made that year.
While this article isn’t financial advice, we do advise you to be well informed. The above is not an exhaustive list of what CGT applies to in Australia, so you should check with the ATO if you are unsure about what your tax obligations are.
You can’t escape having to file a tax return, but fortunately there are a few strategies you can use to reduce your tax burden, legally.
Let’s explore some of the strategies that investors use to minimize investment tax.
Effective Strategies To Minimize Tax Payments
There are several legal investment strategies investors employ to minimize tax bills and claim tax deduction. This goes for both gains and income.
Below you’ll find some of the ways Australian investors hold on to as much of their investment gains and income as possible.
The following is not investment advice. As with all the information on the Navexa blog, it’s general investment information our writers have collated from other sources. For any financial or investment decisions, you should always understand the risks, and seek professional advice if necessary.
Strategy 1: Hold Onto Your Investments For Longer Than 12 Months
Australian tax law makes a distinction between short and long term capital gains. A long term capital gain is when you make a profit on an investment that you’ve held for longer than 12 months. It’s a short term capital gain if you’ve held the asset for shorter than 12 months.
As an investor, this is important to understand because of something known as the ‘CGT discount’.
If you’ve held an asset for longer than 12 months before a given ‘CGT event’ occurs, you may be able to claim a CGT discount of 50%. Remember, a ‘CGT event’ is the point at which you make a capital gain or loss on an asset.
Let’s say you made $30,000 profit from investments that you’d held for less than 12 months, and your marginal tax rate was 37%. You’d have a $11,100 tax liability.
However, if you’d held the asset for longer than 12 months before you sold, the CGT discount would mean your tax liability was just $5,500! That’s a significant amount saved on your tax bill.
Capital Gains Tax discount applies to a wide range of investment income, including shares, property, and cryptocurrency.
As you can see, holding onto your investments for longer than 12 months to take advantage of this discount can be much more tax effective than disposing of them quickly.
Remember, you must be an Australian resident for tax purposes to take advantage of the CGT discount. There are also some other situations where the CGT discount does not apply.
For example, the discount is not available if the asset is your home and you started using it as a rental property or business less than 12 months before disposing of it.
A CGT discount of 50% is available to Australian trusts, and complying super funds can receive a discount of 33.33%. However, companies can not take advantage of the CGT discount.
When you file your tax return, you must subtract any capital losses that you may have from your capital gains before applying the CGT discount. In most cases you will be eligible for the discount if the asset has been held for longer than 12 months.
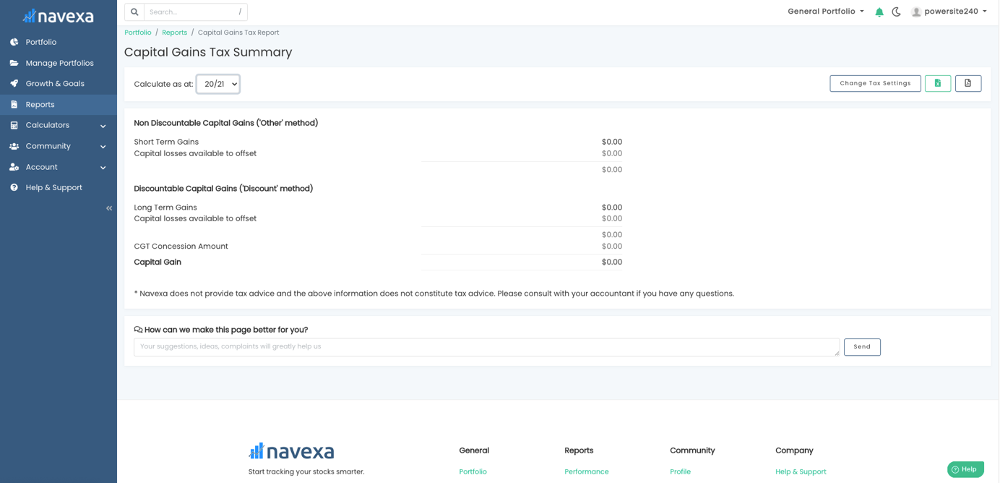
Navexa provides a platform where you can easily track your portfolio performance and calculate both your taxable capital gains and taxable income. Our CGT Reporting Tool gives a detailed breakdown of which assets are ‘non-discountable’ from a CGT perspective (those which have been held for less than the required 12 months to qualify), reducing the amount of tedious leg-work at tax time.
Navexa’s tax reporting tools remove the need to manually calculate your portfolio’s tax obligations and show you the most tax effective way to prepare a tax return.
Provided the portfolio data in your account is correct and up-to-date, you can run an automated tax report in just a few seconds.
Navexa’s CGT Reporting Tool.
What you see above is Navexa’s CGT Report.
Navexa calculates your taxable gains and displays a detailed breakdown. Capital gains are displayed according to Short or Long Term status alongside your Capital Losses Available to Offset. The report also calculates your CGT Concession Amount and finally, your total Capital Gain.
Navexa’s CGT Reporting Tool makes it easy to categorize your investments for your tax return.
Strategy 2: Offset Your Capital Gains With Capital Losses
Another useful strategy at tax time is using capital losses to offset your capital gains. While it would be nice if your assets always made gains and never losses, most of us who invest know that this isn’t the case. Thankfully, the silver lining here is that your capital losses can be used to reduce the tax you pay on your capital gains.
You will have made a capital loss when you sell an asset for less than what you paid for it. This loss can be deducted from capital gains that you made from other sources, to reduce the tax you pay. If you don’t have any capital gains to deduct from, the capital loss can generally be carried forward to future financial years. If you make capital gains in future years, the capital losses are still up your sleeve to deduct from any gains and reduce tax.
While there is no time limit on how long you can carry the losses forward if you don’t make any gains, the ATO does require that capital losses are used at the first available opportunity. This means when you have a capital gain to declare and capital losses available to offset, you must do so. They also require the earliest losses to be used first.
For example, if an investor owed $5,000 in CGT for their investments in a financial year, but had declared losses of $1,500 the previous financial year, they could carry these losses over to offset their capital gain, resulting in a reduced tax bill of $3,500.
There are some capital losses that can’t be deducted, so be aware of these. These include personal use assets such as boats or furniture, or collectables below a certain value. The ATO also won’t allow capital losses to be deducted from collectables unless they are deducted from capital gains from collectables.
Capital losses can also be deducted from your cryptocurrency assets, too. Let’s say you bought $5,000 worth of Ethereum because it had been surging in price and you were experiencing crypto-FOMO. You buy near the peak and in subsequent weeks the price crashes heavily, after a large nation announces that it won’t endorse cryptocurrency in their economy. Despite this disappointment, don’t forget that if you sell the asset and realize a capital loss, it could be a handy tool to offset other capital gains in your portfolio.
Despite a few exclusions, however, most capital losses from your investments can be deducted from capital gains you have made from other assets. If you are unsure about whether you can deduct a particular capital loss, check with the ATO.
Strategy 3: Invest In Companies That Pay High Dividends And Franking Credits
We’ve already looked at how the ATO taxes dividends, so what does this mean for minimizing your income tax obligations? Again, this is not financial advice.
Remember that companies must pay the Australian Companies Tax on their profits. If an investor receiving a dividend has a tax rate greater than the company tax rate that has already been applied to the company’s profits, they will receive a franking credit.
Let’s look at an example. Say an investor with a 32.5% tax rate receives a $1,750 dividend with a $750 franking credit attached. The franking credit takes the taxable income to $2,500, with gross tax of $812.50 payable. The franking credit rebate of $750 is deducted from the gross tax and the investor is left to pay a reduced tax amount of $62.50, leaving them with $1,687.50 after tax income. As you can see, the impact of the franking credit rebate is significant. For a full breakdown of this and other franked dividend scenarios, click here.
The investor in the above situation manages to retain most of their dividend income. Because the franking credit offsets their CGT so significantly, the amount of tax the individual pays is greatly minimized. Obviously, if your marginal tax rate is lower than 32.5% you will pay less tax and receive a larger chunk of the dividend. If you’re in a higher tax bracket than this, you will receive less.
Regardless of your marginal tax rate, franked dividends are a useful tool to reduce your tax obligations. Choosing to invest in companies that pay dividends, especially fully or highly franked dividends, is a popular strategy for minimizing tax paid on investment returns.
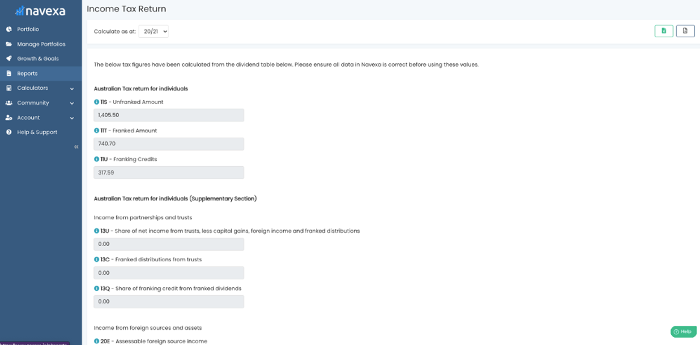
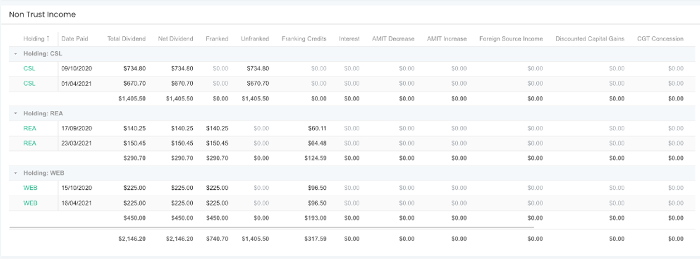
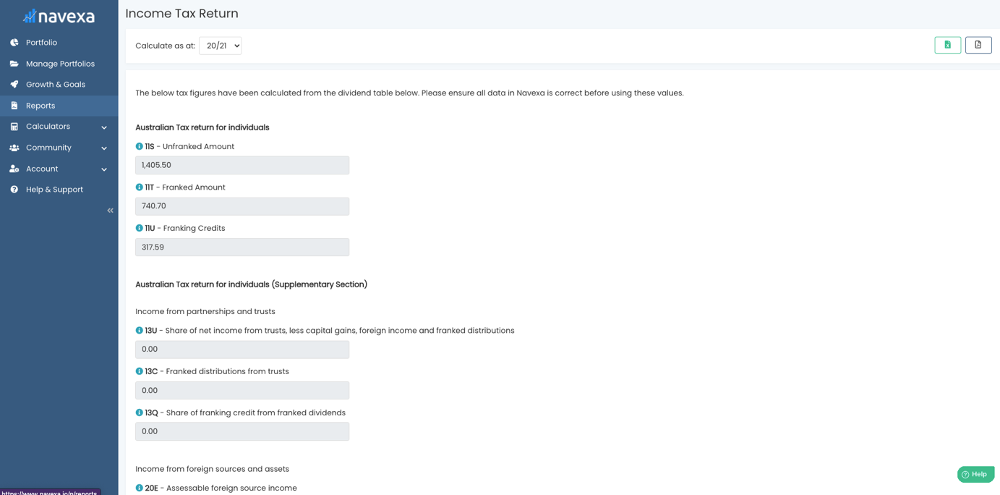
Navexa’s Taxable Income Reporting Tool
Navexa can help you accelerate the process of determining your taxable income. When you automate your portfolio tracking in Navexa, the Taxable Investment Income Report provides you with everything you need to know to prepare your tax return.
Navexa’s Taxable Investment Income Tool.
As you can see above, the Taxable Income Tool displays the Unfranked Amount and the Franked Amount for your dividends, as well as the total franking credits attached to them.
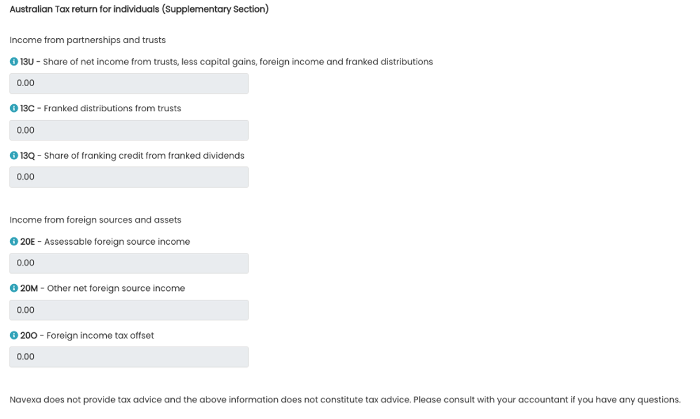
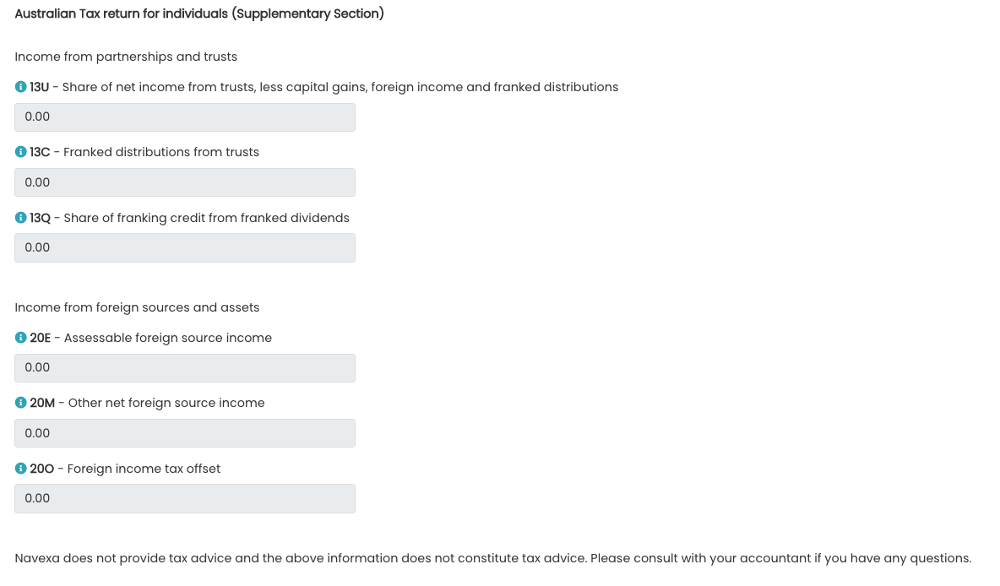
And in the below image, you can see the additional fields in the ‘Supplementary’ section. These display further tax-relevant information such as the amount of Franked Distributions From Trusts, the amount of Assessable Foreign Source Income, and your Foreign Income Tax Offset.
The report automatically categorizes sources and tax return codes.
A foreign income tax offset is when you may have already paid tax on something in another country. This might be employment income or capital gains. In some instances, you may be able to claim a foreign tax offset as part of your tax return. Navexa’s Taxable Investment Income Tool will calculate and display these details for you.
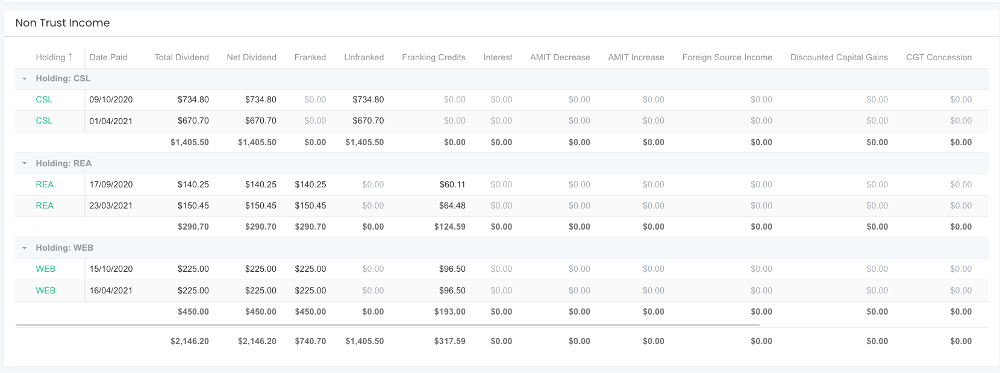
Below these fields, you’ll be provided with a holding by holding breakdown of your taxable investment income, like this:
Navexa’s holding by holding investment income breakdown.
This shows you subtotals for payments from each holding, with grand totals for each column at the bottom. Assets are organized by the dates at which you acquired them, which has important tax implications.
At the top right of the report, you’ll find buttons for exporting the report as both an XLS and a PDF file.
This helps you accelerate the process of preparing your investment income for assessment.
Let’s take a look now at how different investors might choose to dispose of their assets.
Different Tax Strategies For Disposing Of Investments
When the time comes that you want to sell, it can be easy to get excited about the potential gains you are about to realize. This excitement can be dampened, however, when you are faced with the reality of your tax bill.
Choosing a particular method to dispose of your assets can have a major impact on the profits you generate and the tax you pay on them.
Please remember that this does not constitute financial advice. Our writers have collated a wide range of information relating to investment tax that we think is useful for you to consider. As always, we recommend you do your own research before making any investment decisions — tax or otherwise
Strategy 1: First-In-First-Out (FIFO)
The first-in-first-out (FIFO) approach is a common method used by investors when they sell holdings. When you purchase a group of shares at a given price, they will constitute a ‘parcel’.
You may acquire shares in the same company in several different transactions over a period of time. Each transaction forms its own parcel of shares.
The concept of FIFO relates to the disposal of investments. When you are ready to sell shares, you can choose which parcels — sometimes called ‘lots’ — of shares you would like to sell.
Using the FIFO method, you would sell the parcels that have been held for the longest period. Provided that the share price has risen since the time of purchase, the FIFO method will ensure the greatest capital gain from the sale of a parcel of shares. Obviously, this won’t always be the case, and adopting a FIFO approach might not result in the greatest capital gain.
For example, if an investor purchased 100 shares in a company at $20 per share three years ago, and another 100 shares at $40 two years ago, they might choose to use the FIFO method when they choose to sell some of those shares.
Let’s say the company’s share price has now risen to $50. The investor sells using the FIFO method, disposing of the first 100 shares that were purchased at $20. Because the share price has grown $30 since they purchased them, they realize a gross profit of $3,000. However, if they had chosen to sell the more newly acquired shares parcel, they would only realize a gross profit of $1,000.
As mentioned, FIFO will only result in the largest capital gain if the share price has risen consistently over time. If share prices have dropped since you bought them, the FIFO approach might not result in the greatest capital gain — but it could lower your tax burden.
Strategy 2: Last-In-First-Out
In the above example, the investor opted to sell their more recently acquired shares because they wanted to maximise their capital gains. Because the share price rose over time, the FIFO approach achieved this goal.
LIFO works in the opposite manner to FIFO — your newest shares are sold first. The LIFO method ‘typically results in the lowest tax burden when stock prices have increased, because your newer shares had a higher cost and therefore, your taxable gains are less’.
If we continue to assume a consistent growth in share price, LIFO would be a useful strategy to dispose of assets and realize less capital gain from the disposal — and subsequently pay less tax.
However, don’t forget that you can only qualify for the CGT discount if you’ve held shares for longer than 12 months.
Investors have four main ways to calculate their portfolio’s capital gains.
FIFO and LIFO are based on shares being organized by time
The FIFO and LIFO approaches above assume that share prices have risen over time. When the opposite is the case, a smaller capital gain may be realized by selling the newly acquired shares or vice versa. The degree to which FIFO or LIFO suits your goals will depend on how the share price has behaved since you acquired the asset.
Some investors might opt for a more precise method of disposal such as maximum or minimum gain, to ensure that they dispose of the parcels which will return the greatest capital gain or result in the lowest tax burden.
Strategy 3: Maximum Gain
The FIFO and LIFO methods are based on selling assets based on the time at which you acquired them. One alternative approach is maximum gain, which is focused on the price at which shares were bought, rather than the time they were bought.
The suitability of FIFO or LIFO will depend on what has happened with the share price since you bought, and what your goal is. Maximum gain focuses on disposing of the assets that were acquired for the lowest price, rather than those which were acquired first or last. This approach is suitable for those looking to ensure maximum capital gains when they sell.
An example of the maximum gain approach: A prospective home buyer has found their dream home and needs to prove to their bank that they can service a large mortgage. They carefully select the shares that were bought at the lowest price in their portfolio to sell, so they can realize the maximum possible capital gain from the sale. While they will pay the most tax using this method, the capital gain will be the largest, and this will help paint a healthy financial picture to the bank.
But, you may want to minimize your CGT obligations.
Strategy 4: Minimum Gain
The minimum gain approach works in the opposite way to maximum gain — you select the parcels of shares in your portfolio that you acquired for the most expensive price and sell these first. By choosing to sell the tax lots with the highest cost base, you will minimize your gain.
This strategy is generally used by investors who want to minimize their CGT obligations. As we know, less capital gain = less tax paid.
Minimum and Maximum gain, as well as FIFO and LIFO approaches, will suit different investors depending on their requirements.
Regardless of what your aspirations are, and which approach you choose, it is important to make sure that your investment portfolio is kept in good order.
Record keeping is paramount in both portfolio management and personal finance — particularly as it concerns reporting your investment activity to the tax authorities.
The above strategies are probably best deployed when you have a clear understanding of your portfolio’s performance. It is important to keep an accurate record of your transaction history, including the dates and prices at which you bought particular shares. This knowledge is vital if you wish to select the most tax-efficient disposal strategy that you can. Or in some instances, simply if you want to maximise your capital gains.
The Navexa Portfolio Tracker automates this entire process, from tracking trades and transactions to optimizing how you report CGT on a portfolio.
Remember, Navexa doesn’t offer tax advice. We always encourage you to consult your accountant or seek other professional advice when it comes to investments and taxes.
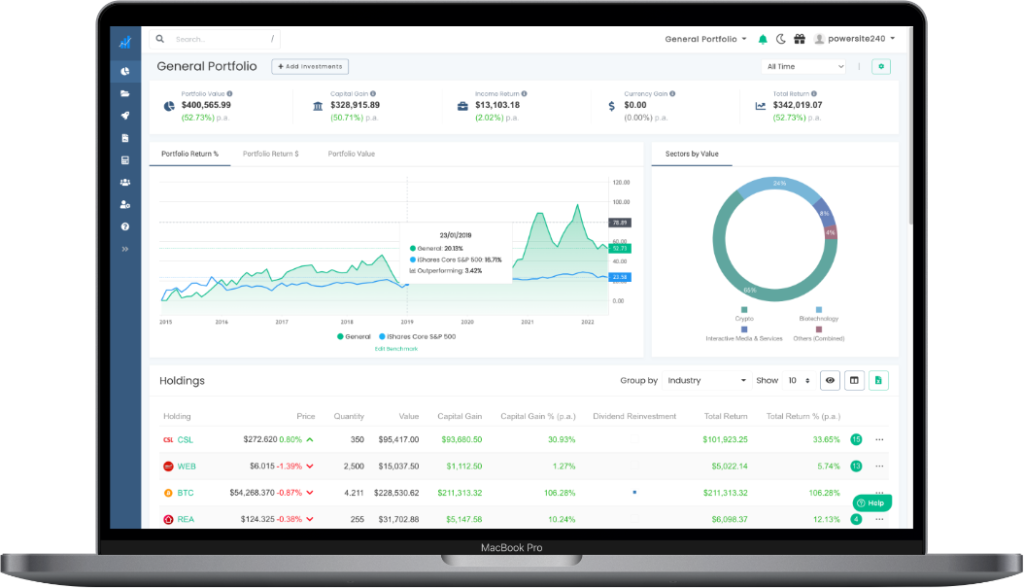
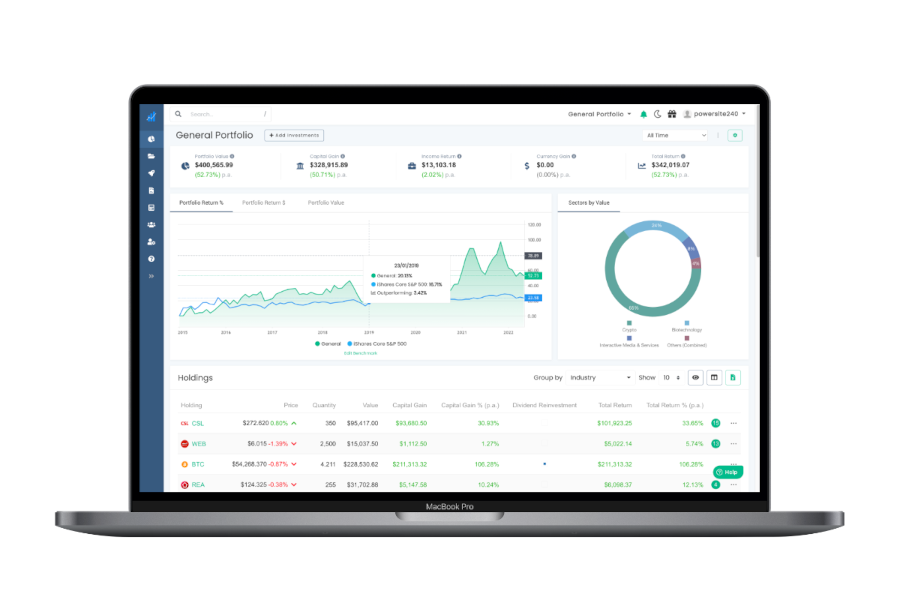
The Navexa portfolio tracker’s portfolio overview.
Automate Your Portfolio Tax Reporting & Optimization With Navexa
Navexa is a platform for tracking your investment portfolio and displaying detailed information that will help you better understand your performance — and better handle investment tax reporting.
When it is time to prepare your tax return, you should have a clear vision of what you want to achieve. Whether you are looking to maximise your capital gains or minimize the impact of CGT, Navexa makes the process fast and stress-free.
Our CGT and the Taxable Income tools can help you determine your obligations and options when it is time to file your tax return.
Join thousands of Australian investors already using Navexa to manage their investment portfolios.
With Navexa you can:
Track your stocks and crypto investments together in one account.
Automatically track capital gains, portfolio income, currency gains and losses and trading fees.
Benchmark your long-term portfolio performance against any index you choose.
Automatically track your dividend and distribution income from stocks, ETFs, LICs and Mutual/Managed Funds
Use the Dividend Reinvestment Plan (DRPs/DRIPs) feature to track the impact of DRP transactions on your performance (and tax)
See the complete picture of your investment performance, including the impact of brokerage fees, dividends, and capital gains with Navexa’s annualized performance calculation methodology
Run powerful tax reports to calculate your dividend income with the Taxable Income Report
Calculate your CGT obligations with our Australian Capital Gains Tax Report and the Unrealised Capital Gains Tax Report
Using the Rule of 72 is a simple method for getting an approximate idea of how long it takes for your money to double. So how can you use it in tracking your investments?
In a perfect world, investors would like to know, in advance, how long it will take to double their money in the stock market. Knowing exactly how long this will take is helpful in planning out portfolio diversification, and eventually achieving financial freedom.
But, how does one go about working out how long it might take to double the value of a portfolio?. Investors can easily become confused. Especially when it comes to accounts that receive annual interest. Then, they may reach for complex formulae, and spreadsheets.
But, there’s a simpler, better way of calculating the period it will take to double one’s investment.
One of the best ways is to use the Rule of 72 — one of the simplest methods of calculating when one’s portfolio will double in value.
What is the Rule of 72?
The Rule of 72 refers to the mathematical concept that shows how long it will take an investment to double in value (in theory). It’s a simple formula that anyone can use to determine the approximate time when an investment will double at a given annualized rate of return.
However, the Rule of 72 only works for calculating compounding growth. Investors can use the Rule of 72 only for an account that earns compound interest, not simple interest. Additionally, the Rule of 72 works better with an interest rate ranging from 6% to 10%.
Besides being used to show exponential growth of a portfolio, the Rule of 72 is also used to show exponential decay. For example, the loss of purchasing power caused by inflation, or the drop in the population numbers.
Compound Growth vs. Simple Growth
Interest helps the portfolio growth, and allocating a certain amount of money to an account that earns interest is a smart move investors make. There are two types of growth, or interest — simple and compound, and these are crucial for using the Rule of 72.
Compound interest is added to the already existing interest, plus the principal amount of the loan or deposit.
This type of interest is calculated with the following formula:
A = P (1 + r) (n)
On the other hand, simple interest is added only to the original investment. The formula for simple interest is:
A = P (1 + Rt)
Compound interest is better, as it can reduce the time required to double the money in an account, and grows the investments exponentially.
In other words, compounding interest grows an investment more and more every year, since the interest gets calculated on progressively larger amounts. Whereas simple interest doesn’t compound on itself over time.
Origins of the Rule of 72
While it may sound surprising, the Rule of 72, and the concept of interest aren’t new ideas. Even ancient civilizations, such as the Mesopotamian, Greek, and Roman, used them in transactions, and basic money management.
While it may not have been called the Rule of 72, it was always around. For example, lenders always wanted to know how to manage their investments, and the rate of return.
Who Came up With the Rule of 72?
The first person to ever take note of the Rule of 72 was Luca Pacioli. Pacioli was an Italian mathematician. He mentioned the Rule of 72 in his book Summa de Arithmetica, Geometria, Proportioni et Proportionalita (Summary of Arithmetic, Geometry, Proportions, and Proportionality), published in 1494.
Pacioli stated that people who wish to know how many years it will take to double their investment should always ‘keep the number 72 in mind.’
Pacioli never went deeper into defining or explaining the reasoning behind 72.
With that in mind, it could have happened that someone else invented the number to improve their calculation of the interest rate, and portfolio growth. Some even say that Albert Einstein was the one to invent the Rule of 72, but that was never confirmed.
Why Is It Called the Rule of 72?
There’s no specific reason this rule is called the Rule of 72. Still, it serves to replace the complex logarithmic calculation that most investors are having trouble dealing with. The exact formula for determining how many years it takes to double your money based on compounding interest, or growth, is:
ln(2) / ln(1 + (interest rate/100))
where “In” represents the natural log value.
Good mathematicians could use this formula to get accurate results by observing return rates, and natural logs. The actual number that’s derived from the formula is 69.3. However, since this number is not easy to work with, people usually replace it with 72, since it’s equally good in showing the approximate number of years necessary to double the investment.
Navexa’s portfolio tracker is even easier to use. Our portfolio tracker automatically calculates every aspect of portfolio performance for shares, cryptocurrency, cash accounts and more.
How to Use the Formula?
To calculate how long it would take for the investment to double in value, one can use the following formula:
Years to double = 72 / expected rate of return
This method can also be used to calculate the expected rate of return.
Investors should divide 72 with the years to double to get the rate of return on their investment (expected rate of return = 72 / years to double).
This principle handles fractions, or portions of the year. Plus, the resulting rate of return includes compounding interest on the investment.
However, there are a few things to pay attention to:
the interest rate should not be a decimal
this formula should be applied to an investment that receives annual interest (compounding)
the farther the interest rates are from 8%, the less accurate the results would be
to calculate lower interest rates, one can drop the number to 71
this formula is easily divisible, but not perfectly accurate
Rule of 72 — Variations
Since this principle provides an approximate result, sometimes investors use slight variations, like the Rule of 69, Rule of 70, or Rule of 73.
These numbers are used in the same way, and serve to calculate the years required for the investment to double in value.
Rule of 72 — Examples
Here’s a simple example of using the method to calculate how long it takes for the investment to double:
Let’s say an account earns 4% of annual interest.
dividing 72 by 4 would give the years it takes for the money to double – 18.
When used to show inflation, and other deprecating numbers, the formula is the same.
However, the final result will show the years it will take for the amount to be cut in half.
Since this principle provides an approximate result, sometimes investors use slight variations, like the Rule of 69, Rule of 70, or Rule of 73.
Both novice, and experienced investors could use the Rule of 72 to estimate the doubling time of their holdings. Since the Rule of 72 is easy to use, almost anyone can estimate how long it will take for a certain number to double in value.
Who Uses The Rule of 72?
Since this rule can be used outside of personal finance and investing, it’s also used by other experts who need to estimate how many years it will take for a value to double.
What Is the Rule of 72 Good For?
The Rule of 72 is a good method that can be applied to anything that grows (or decays) exponentially. For example:
GDP
Inflation
Investment compounding interest rate
Credit card debt
House mortgage
Car loan refinancing
How Does the Rule of 72 Work?
By using the Rule of 72, investors can get an approximation of the years it will take for their assets to double in value.
This makes the Rule of 72 one of the key personal finance formulae to understand for investingt. Plus, this rule gives a general idea of how many “doubles” an investor might get during their lifetime, or for a certain period.
Does It Show Accurate Results?
When it comes to the accuracy of this rule, the Rule of 72 provides approximate information about the desired time period.
This formula is a simplification of the more complex logarithmic equation. Investors who wish to get an accurate result would have to do the entire calculation, or use an electronic spreadsheet calculator.
As we previously mentioned, this rule is usually used to determine the rate of return on the investment. However, experts in various industries can also apply this principle to anything that is compounding, and this doesn’t necessarily involve money.
For example, a city’s population that grows/decreases by a certain percentage per year can also use the rule to check how long it would take for the population to double, or halve.
Limitations of This Principle
Besides not being completely accurate in showing data, this formula is also mainly applied to compounding interest accounts, not simple interest ones. What’s more, the Rule of 72 works better for lower interest rates, and is less precise as the interest rate increases.
Additionally, this calculation can’t be used to forecast how long it might take to get a double return with decentralized finance and cryptocurrency, due to high market volatility, and sudden changes in prices.
In fact, no calculation can give anyone a 100% accurate prediction of what their investments may or may not do in the future.
Speculating Future Returns With The Rule Of 72
When people invest, they often want to know how long it will take to double their money. However, predicting the exact number of years can be tricky.
This is why the Rule of 72 exists. When used correctly, with an investment that involves compound interest,this formula is generally fairly accurate — provided, of course, the annualized rate of return remains consistent.
here are certain limitations investors should be aware of. This mathematical concept works only with accounts that receive compounding annual interest at lower rates.
The higher the rates go, the less accurate the results will be.
This principle doesn’t work with simple interest.
On the other hand, investors can slightly change the number, based on their annual interest rate. For example, some may use 69.3, or 73, depending on the percentage of their rate.
The Navexa portfolio tracker and reporting platform is a fast, accurate way to determine your annualized rate of return across shares, ETFs, cryptos, cash accounts and more. We handle all portfolio performance calculations behind the scenes so you can focus on better understanding your portfolio and returns.
Managing a complex portfolio and calculating cash dividends might be challenging. Here’s how it can be done with ease with a few formulas — and with the Navexa portfolio tracker.
Most people who consider investing are familiar with owning stocks. Some are also highly interested in receiving a dividend payout. Those who go deeper into researching an investment, might decide on purchasing stocks of companies because that pay cash dividends.
Dividends might help investors maintain a stable portfolio, remain invested in quality companies, and earn a profit, all while holding shares.
However, novice investors may find dividends confusing — especially when it comes to calculating their dividend yield per share.
The traditional way to calculate dividend per share is using the company’s income statement and similar reports. But, there are other, easier methods, too.
Dividends Explained
Cash dividends are payments companies make to shareholders from their profits.
A dividend is defined as a distribution of a company’s earnings or stocks to a class of its shareholders. Dividend payouts are determined by the board of directors, and shareholders receive them for as long as they hold the stock.
A dividend is a form of reward to shareholders for investing in the organization and for holding the stock. Dividends may also help a stock’s price remain relatively stable.
Some companies offer dividend payments and prefer to keep the shareholders satisfied. Others decide not to pay dividends, instead reinvesting profits back into the company.
Dividends are paid monthly, quarterly, or annually, depending on the company. They’re paid at a scheduled frequency, so investors always know when they’ll receive the profit from holding shares.
Receiving a dividend based is a great way to increase one’s income, but there’s more to it.
Shareholders also pay attention to other factors, such as dividend yield, rates, retention ratio, and other key numbers.
Dividend Rate vs Dividend Yield
The dividend rate is a percentage that shows how much the company pays in dividends annually, relative to its stock price. The dividend rate can be fixed or adjustable, and it’s expressed as a dollar figure.
The dividend rate is calculated with the following formula:
Dividend rate = dividend per share / current price
On the other hand, the dividend yield is expressed as a percentage, and shows the ratio of a company’s annual dividend payout, compared to its share price.
Shareholders can calculate the dividend yield by using the following formula:
Dividend yield = annual dividends per share / current share price x 100
Navexa helps share investors by calculating dividend performance automatically. Navexa’s app is easy to use, and tracks multiple types of investments. This includes tracking and reporting on cryptocurrency investments.
Dividend Payout Ratio vs. Retention Ratio
The dividend payout ratio shows how much of the company’s earnings after tax are paid to the shareholders. It’s in direct relation to the organization’s net income amount, and it’s used to measure the net income percentage.
It’s calculated by the following formula:
Dividend payout ratio = total dividends / net income
On the other hand, the dividend retention ratio represents the percentage of net income that the company keeps to grow the business, instead of paying it out to the shareholders as dividends.
It’s calculated by the following formula:
Retention ratio = retained earnings / net income attributed to stockowners
Calculating Dividends per Share and Earnings per Share
Dividends per share (DPS) is the number of stated dividends paid by companies for each of the shares outstanding. It represents the number of dividends each shareholder receives based on the shares they own.
DPS is often used to calculate dividend yield, and the formula goes as follows:
DPS = total dividends paid over a period – special dividend payout / shares outstanding
On the other hand, earnings per share (EPS) are useful in calculating how profitable the company is based on measuring the net income for each of the company’s outstanding shares.
EPS is also an important number used to determine share price.
EPS shows whether investing in a certain company and holding its shares would benefit the shareholders and improve their net income.
For example, if the company reports an EPS that’s below a certain estimate, that might cause its share prices to drop.
The formula for calculating earnings per share goes as follows:
EPS = net income – preferred stock dividends / outstanding shares
Types of Dividends
Four types of dividends include cash, stock, property, and liquidating dividend.
There are several types of dividends that a company may pay to the shareholders. These include:
Cash dividend
Stock dividend
Property dividend
Liquidating dividend
Cash dividends are the most common. They represent a simple distribution of funds to incentivize shareholders to hold their shares, improve the shareholders’ equity, and increase confidence in the organization.
What Are Cash Dividends?
Cash dividends represent money a company pays to the shareholders per share they own. The money can come from the organizations’ current earnings or accumulated profit. Cash dividends are paid regularly, usually by quarterly or annual payments.
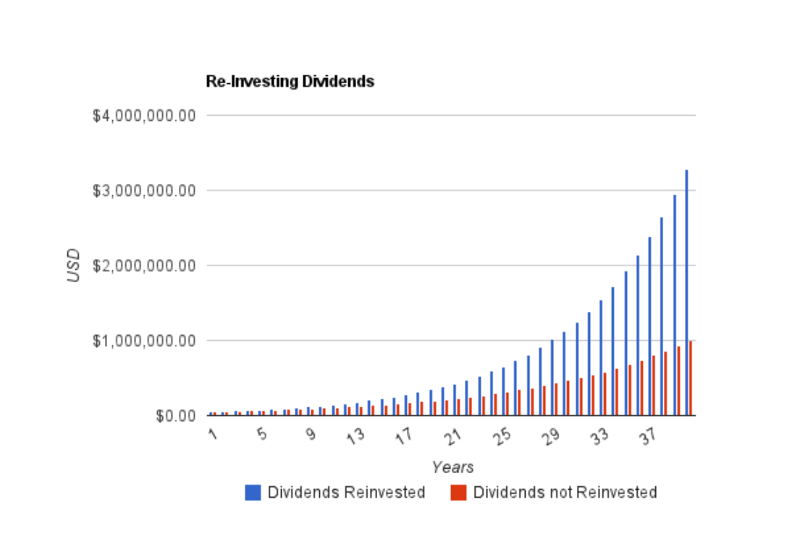
Once the shareholders receive this dividend, they may have the option to accept the cash payment, or reinvest in additional shares (known as a dividend reinvestment plan) and improve their position in the market.
The willingness of the company to pay cash dividends shows a solid financial strength, and positive performance, although that’s not always the case. Sometimes the companies may keep paying dividends, but still be in a poor financial position and eventually shut down.
This is why potential stock owners must be careful when investing and take everything into consideration before they invest in the organization.
Which Company Can Afford to Pay a Cash Dividend Yield?
Many companies have outstanding earnings, and can afford this form of dividend payout. These are just some of the companies that offer dividend payouts across the ASX, NASDAQ and NYSE:
IBM
AT&T
Johson & Johnson
QUALCOMM
Fortescue Metals Group
BHP
Magellan Financial Group
More experienced investors can easily determine which company has a solid income statement, and capital, which helps them invest in profitable shares. On the other hand, novice investors may struggle in finding the dividend shares worth investing in.
Potential stock owners must be careful when investing and take everything into consideration before they invest in the organization.
Still, investing in shares that pay these types of dividends can help both new and experienced investors increase capital.
Additionally, those who wish to invest often check out the company’s trailing 12 months (TTM).
This is a set of performance data that shows how the organization managed finances in the last year. TTM is beneficial for understanding a company’s growth and potential.
Example of a Cash Dividend Payout
Here’s a simple example of a cash dividend:
One investor owns 100 shares of company X. At the end of a quarter, the company X calculates its financial performance for that quarter.
The board of directors then reviews the information, and decides on a $0.50 dividend per share for the quarter.
This means that the investor is entitled to $0.50 x 100 shares = $50
How Does a Cash Dividend Work?
When a company earns enough, it may decide to distribute part of its earnings to the shareholders. This part of the earnings is most commonly distributed via cash dividends paid in regular intervals, usually quarterly.
While these dividends are a great way of motivating shareholders to stay with the company, they may cause the stock price to drop. Still, investors love companies that offer dividends, as they know they can count on regular payouts.
Why Does a Cash Dividend Matter?
There are many reasons these dividends are important to shareholders. For example, the cash dividends could signal whether the company has good financial health.
It may show that a company is more effective in using its capital, compared to companies that don’t pay dividends.
Dividend payment per stock also increases the chance of shareholders remaining invested in the stock. This means the company’s stock price may stay more stable.
Are Cash Dividends Better Than Stock Dividends?
When it comes to the cash dividend, shareholders have no other option but to either keep it, or reinvest it and increase the number of shares they own.
Even though these dividends are a more common way of paying shareholders, stock ones are sometimes considered better.
When it comes to the cash dividend, shareholders have no other option but to either keep it, or reinvest it and increase the number of shares they own.
With a stock dividend, they can keep the shares or turn them into cash. Plus, stock dividends aren’t treated as taxable, as they’re usually not turned into income.
The Advantages of Cash Dividends
There are many advantages of the dividend payout for shareholders. One of the main advantages is the steady income. These dividend payouts are regular, so shareholders know when they’ll receive the funds.
Regular payouts are especially beneficial for those who build a large portfolio with a view to living on the income.
Receiving dividend payments can also be a good way of establishing a market hedge. This defends the shareholders from the stock price dropping, which often happens during a bear market.
Furthermore, they know that companies that pay dividend yield may be more careful with their financial decisions, as they want to keep people invested in their shares.
The Disadvantages of Cash Dividends
While these types of dividends are common, and can yield great profit for investors, there are certain financial disadvantages for companies.
One of the major disadvantages to paying the dividend is that the money that’s paid to shareowners can’t be used to further develop the business. In a way, paying the dividend prevents the company from investing in increasing sales and profits. Instead, offering a healthy dividend might sustain or even raise the share price — effectively raising capital for the business.
When it comes to shareholders, dividend payments mean they’ll have taxable income. However, if an investor has an income that’s too low to make them liable for tax, they may be entitled to a refund from the Australian Taxation Office.
Do Cash Dividends Go on the Balance Sheet?
A balance sheet is a financial statement that involves the company’s stock, other assets, liabilities, and shareholder equity. This sheet is also used to evaluate the business.
Dividends do impact the balance sheet, as they will show a decrease in the company’s dividends payable, and financial balance. The balance will be reduced.
To check the total amount of paid dividends, investors should also use a financial statement. This statement shows how much money is entering and leaving the company.
Why Do Shareholders Prefer Cash Dividends?
According to financial theory, investors don’t care much about whether they’ll receive cash or stock dividends, for as long as they have the same value. However, this approach doesn’t include other complexities, such as taxes, transaction costs, dividend payout, demographic attributes of investors, etc.
On the other hand, the theory states that investors would pay additional expenses for receiving cash dividends, and they may prefer them over stock dividends.
Some shareholders would rather pay the taxes and receive cash for their outstanding shares, than receive additional stocks, simply because of direct financial compensation.
Accounting for the Cash Dividend
These forms of dividends are usually accounted for as a reduction of a company’s retained earnings. After the board of directors allows this type of dividend payout, the company debits the retained earnings account, and creates a liability account called ‘dividends payable’.
By moving funds to a dividends payable account, the company reduces equity, which is instantly shown in the company’s balance sheet even though no money has been paid out yet. This, in turn, increases liability.
Once the payment date comes, the company then reverses the dividend payable with a debit entry, and credits the cash account for the cash outflow.
In that way, these forms of dividends don’t actually affect the company’s income statement. Still, all companies that pay these dividends must report the payments in the cash flow statement.
Calculating Cash Dividend
Calculating the dividend payout for the given year is done by subtracting the retained earnings from the beginning of the year from the end-of-the-year numbers.
Based on the complexity of these types of dividends, potential stockholders may struggle in finding the appropriate information they can use to calculate the dividend payout. In general, companies report their dividends in a statement they send together with their accounting summary to their stock owners.
Some organizations share the date in press releases. However, that’s not always the case.
Those who can’t find this data officially, usually consult the company’s balance sheet, which can be found in the annual reports.
Calculating Cash Dividend From a Balance Sheet and Income Statement
If the dividend payout is not explicitly stated in any public document, potential shareholders can look into two things:
Balance sheet
Income statement
The balance sheet is a record of the organization’s assets and liabilities. This document reveals how much the organization has kept in terms of retained earnings. Retained earnings are all earnings of the company that weren’t paid out as dividends.
The second document, which can be found in the annual report, measures the organization’s financial performance for a certain time period. The income statement shows how much net income a company had during a certain year.
This document helps determine what changes would occur in retained earnings if the organization had decided not to offer a dividend payout for that time period.
Calculating the dividend payout for the given year is done by subtracting the retained earnings from the beginning of the year from the end-of-the-year numbers.
This will give the net change in retained earnings, which should then be subtracted from the net income for the year.
The final number shows the total amount of dividends paid during the stated period.
Cash Dividend Per Share Formula
Those who wish to do their own accounting can easily calculate the earnings they receive from per-share dividend yield. After purchasing a stock that pays dividends per share, the shareholder would usually get quarterly dividend checks.
To find the dividend payment per share, the quarterly dividend payout should be divided by the number of shares.
To get annual numbers, the shareholder can multiply the quarterly dividend yield by four.
However, with Navexa, there’s no need to use complicated formulas to calculate the growth of a portfolio.
Navexa is a smart portfolio tracker that manages accounting for its users. Our app makes investing simple, as it automatically calculates portfolio changes.
Navexa tracks and records every dividend payment — cash and reinvested — in a portfolio and provides insights into which holdings are earning the most and least in a given period.
Plus, Navexa can annualize portfolio performance, and automate portfolio income tax reporting.
The Navexa Portfolio Tracker allows you to track dividends alongside capital gains, trading fees & more.
Final Word On Calculating Cash Dividends
Owning dividend-paying stocks is an attractive proposition and a key part of many investors’ long-term wealth building strategies.
But while earning income from an investing is good, it’s vital that investors keep track of their dividend performance — whether that’s from cash dividends or reinvested dividends.
This is important not just to understand and analyze how much a portfolio is generating in income (and how much that income contributes to overall performance), but because investment income is taxable.
Tax reporting requirements require that investors provide full details of their investment income.
That’s why we’ve built the Navexa portfolio tracker’s automated taxable income calculator. The tool calculates every last cent worth of income an investor needs to report for a given tax year, including details on franking credits (for Australian investors).
It’s part of our mission to empower investors to build brighter financial futures with simple, but powerful, automated investment analytics and reporting tools.
Tracking a cryptocurrency portfolio might be challenging. Here’s what experienced inventors use to understand their crypto ROI.
Investing in cryptocurrencies can be challenging, especially for investors who are used to dealing with traditional assets. These investors often see the crypto market as highly volatile.
In addition, there’s a lot of market manipulation, which often causes drastic price movements.
However, most people get attracted to crypto investment and jump into a digital asset because of the possibility of a high return on investment.
Even the experienced trader who deals with gold might test out the waters and get into crypto, ready to take the risks.
Here’s how they calculate the ROI, rate of return, and their net profit.
Briefly on Cryptocurrencies
There’s a lot that can be said about cryptocurrencies, but new investors should know that it all started with Bitcoin (BTC) in 2009. It was the first-ever digital currency that introduced a peer-to-peer electronic cash system.
Once the first cryptocurrency started getting traction, others followed. Soon, a whole new market was born, and ever since, the financial industry hasn’t been the same. Cryptocurrency opened up many doors to investors who can now invest in these assets in several ways, such as:
Purchasing coins or tokens directly on the exchange
Investing in an Initial Coin Offering (ICO)
Investing via Initial Exchange Offering (IEO)
Getting into Crypto Exchange Traded Fund (ETF)
Some of the new options for investing in crypto include purchasing non-fungible tokens (NFTs) and lending money via some of the Decentralized Finance (DeFi) platforms.
How to calculate rate of return and net profit for crypto investments
Dangers of Investing in Cryptocurrency
Even though there are many ways to get introduced to crypto investments, novice investors often worry about the limitations regarding current and future regulations.
Many investors don’t consider the value, efficiency, or use case of the cryptocurrency they invest in. Some also completely ignore the technology behind the project and only follow a hyped community and current market sentiment.
This often results in a poor, emotion-driven investment decision, which brings a negative return on investment (ROI).
On the other hand, some investors are fortunate, and hit the nail on the head by getting into tokens which prove to be successful projects, bringing high ROI.
Still, those who purchased crypto and learned to manage the risks claim there’s a potential for a decent return on investment (ROI).
However, ROI depends on the current price of the asset and market fluctuations, which can be shaken with just one negative headline.
This is why calculating the rate of return and ROI can be tricky.
What Is Return on Investment (ROI)?
Return on investment, or ROI, is defined as the percentage growth or loss of investment, divided by the initial cost of an investment, multiplied by 100. ROI calculation measures the profitability of an investment.
On the other hand, the rate of return, or IRR, is the rate of all future expected cash flows of an investment. IRR measures the estimated return.
Both are used to measure the performance of investments, with ROI being used by individual investors or institutions and IRR being used by financial analysts.
Positive ROI and Negative ROI
The difference between a positive ROI and a negative ROI is simple. A positive return on investment means that net returns are greater than any investment costs.
The negative ROI percentage shows the net returns are poor, meaning the total costs are greater than returns.
The Importance of the ROI Metric
ROI is the key performance indicator that shows how successful an investment might be. ROI calculation can be handled in two different ways:
By using the standard ROI formula: subtracting the initial value of the investment from the final value of investment, and then dividing the number by the cost of investment x 100
By using the alternative ROI formula: dividing net return on investment with the cost of investment x 100
Still, investors should be mindful that the annualized return formula often ignores the compounding that’s added to the initial value, which is why it might give incorrect results.
Tools Investors Use to Calculate ROI
There are many tools to calculate ROI, and experienced investors often don’t even have to use a formula to get the numbers right.
For example, Navexa is one of the best ROI and portfolio trackers people can use to keep track of the money they invested.
It’s a smart portfolio tracker tool, developed to pull data from all sorts of platforms, including crypto exchanges.
Navexa helps traders and investors see their annualized ROI with ease — bypassing the need to use any manual calculation.
What is Crypto ROI?
Crypto ROI helps investors calculate the performance and efficiency of their crypto investment.
By calculating crypto ROI, traders and investors also compare how different crypto investments perform against one another, and which asset has the highest potential of bringing more money.
What’s more, crypto ROI is a key metric in determining the performance of an asset compared to its initial price.
Calculating crypto ROI has become a popular indicator for Bitcoin, Ethereum, and altcoin traders and investors.
Crypto ROI is observed in the same manner as traditional investments ROI — if an ROI is positive, that means the investment is performing well — the price is increasing over a certain period.
On the other hand, if the value of ROI is negative, that means the asset has lost value.
When it comes to crypto, it might be tricky to know whether a crypto investment will bring ROI.
Digital assets often look quite appealing, especially to new investors, but the market is very volatile and high ROI often depends on multiple factors.
Why do Investors Measure Investment ROI in Crypto?
The most common reason investors measure crypto return on investment ROI is to see whether the initial value of the investment has increased.
Calculating crypto ROI gives the general idea of how profitable an investment is.
It also shows how the investor’s portfolio performance compares to the initial investment.
Navexa tracks and reports on crypto returns & performance
How to Calculate ROI in Cryptocurrencies?
Investors usually calculate crypto ROI by subtracting the original cost of investment from the current value and then dividing it by the original cost.
Just like with traditional investment assets and markets, ROI calculation shows whether an investment strategy is working or not.
Is ROI an Ideal Metric?
While ROI is a powerful metric that shows the success or failure of the investment strategy, it has some flaws. For example, ROI doesn’t usually account for the time someone spent investing. This is why analysts often calculate annualized ROI, which shows the progress of profit or loss for a given timeframe.
ROI doesn’t explain the asset’s environment, market risk, and liquidity changes. This is why investors often rely on a few other metrics, and not just the ROI.
Those crypto investors who prefer trading to holding should also account for other factors and costs, such as trading fees, wallet fees for sending the coins, and any other metric related to their expenses.
They should also account for the dates when they bought and sold an asset.
The ROI metric doesn’t reflect the risk associated with purchasing, trading, and holding crypto, which is why investors must rely on additional data.
Crypto ROI Calculator
There are many crypto investment ROI calculators out there and most are super easy to use to calculate profit on crypto investments.
Navexa is one of the top crypto ROI calculator tools investors use to get the percentage of their ROI.
The Navexa portfolio tracker calculates performance for stock and cryptocurrency holdings, including capital gains, currency gain tracking, income tracking and more. Navexa is easy to use and free to start with, so both novice and experienced investors can test out its features.
Example: Calculating the ROI of a Bitcoin Investment
Bitcoin is likely the first asset investors get into when they start investing in crypto. Here’s a simple example of how people calculate the ROI of BTC.
Let’s say someone invested $2,000 into BTC. After a while, their $2,000 grew to $6,500.
They would calculate the BTC ROI following the standard formula:
($6,500 – $2,000) / $2,000 = 2.25 x 100 = 225% ROI
Return on Investment for Different Digital Assets
With so many different assets on the crypto market, each asset may have a different ROI. Those projects that have a more active community, and a better use case for their tokens may provide higher ROI to early investors. However, that’s not always the case and this post should not be considered financial advice!
Bitcoin is already a somewhat established asset, and its ROI has historically been the highest compared to other assets. On the other hand, Ethereum is the second-largest cryptocurrency after Bitcoin, but it just recently provided a higher ROI for some investors.
Some of the best performing assets currently include The Sandbox, Terra, Decentraland, and other assets that are related to the metaverse, play-to-earn gaming models, NFTs, and a few other new technologies in the crypto space.
However, experienced investors know that the crypto market is unstable and that ROI on most crypto assets can become negative if the coins face a massive sellout.
Final Word on Calculating Crypto ROI
One of the reasons people get into crypto is the promise of a potentially high ROI. However, getting great returns with crypto can be challenging. Still, measuring ROI can help investors make more rational decisions. ROI metric also helps people allocate the money in their portfolio in the right way so that they’re more profitable in the long run.
On the other hand, calculating ROI on a crypto investment could be tricky, as investors often forget to account for their trading fees and other expenses they managed.
However, with Navexa, getting a clear ROI metric is easy 🙂
An introduction to some of the (legal) ways to optimize investment taxes in Australia.
Paying tax is part of investing. While you can’t avoid paying tax (at least, not legally), there are several ways in which you can reduce the impact of tax on your investment earnings.
This post explains the tax system in Australia as it relates to investment income, and introduces some strategies Australians use to minimize their investment taxes.
Different investment strategies have different tax obligations
Tax And Investing In Australia
The Australian Tax Office (ATO) requires individuals to declare investment activity in their tax return and pay tax on all investment earnings, including capital gains and dividend income.
If you buy shares, invest in property, or hold other investments and then sell them at a higher price, you will have made a capital gain.
The Capital Gains Tax (CGT) is the tax rate that is applied to net capital gains (total gains minus total losses).
How Does the Capital Gains Tax (CGT) Work?
The capital gains tax is not a set rate but is calculated according to an individual’s marginal tax rate. This is the tax rate for personal income, and will be the tax rate applied to investment earnings.
Capital gains are taxed at an individual’s marginal tax rate
Unlike CGT rates for individuals, flat CGT rates apply for companies and self-managed funds. Trading companies pay 26% if their annual turnover is less than $50 million. If it exceeds $50 million, the CGT applied is 30%. Investment companies don’t qualify for the 26% rate and are taxed at 30%. Self-managed super funds are taxed at a lower rate of 15%.
Getting back to individual taxation, if you sold any investments during a financial year, including shares, you will need to work out your capital gain or loss for each asset. CGT will need to be paid on your net capital gains. The Navexa platform provides a straightforward solution for making these calculations — more on that later.
Which Investments Does The CGT Apply To?
CGT applies to a wide range of investments, including property, shares, and cryptocurrency. When you sell an asset and realize a gain from that sale, you will be charged CGT.
In addition to owing CGT when you sell an asset, the tax also applies in other investment situations, or ‘CGT events’. A CGT event occurs when you make a capital gain or incur a capital loss.
Examples of other CGT events include switching shares in a managed fund between funds or owning shares in a company that is subject to a takeover or merger.
The ATO considers these dividends ‘franked’. A ‘franking credit’ is attached to the dividend and represents the tax that has already been paid by the company distributing the dividend. The shareholder who receives the dividend with an attached franking credit will either owe less than their usual tax rate, or receive a tax refund.
Tax And Cryptocurrency
Cryptocurrency investment is also subject to taxation in Australia. Cryptocurrency is taxed in a similar way to other investment assets.
The ATO classifies four main CGT events for crypto activity.
You’ll be taxed when you:
Sell cryptocurrency.
Exchange one crypto for another.
Convery crypto to fiat currency like AUD.
Pay for goods or services in crypto.
Just like when you pay CGT at your marginal tax rate when you sell shares, you owe this rate when you sell crypto.
Capital gains are taxed for cryptocurrency investments, too.
Now that we’ve discussed the basics of tax for Australian investors, let’s explore some of the strategies that investors use to minimize investment tax.
Effective Strategies to Minimize Tax Payments
There are several legal investment strategies investors employ to minimize tax bills and claim tax deduction. This goes for both gains and income.
Below you’ll find some of the ways Australian investors hold on to as much of their investment gains and income as possible.
The following is not investment advice. As with all the information on the Navexa blog, it’s general investment information our writers have collated from other sources. For any financial or investment decisions, you should always understand the risks and seek professional advice if necessary.
Strategy 1: Hold Onto Your Investments For Longer Than 12 Months
Australian tax law makes a distinction between short and long term capital gains. A long term capital gain is when you make a profit on an investment that you’ve held for longer than 12 months.It’s ashort term capital gain if you’ve held the asset for less than 12 months.
As an investor, this is important to understand, because of something known as the ‘CGT discount’.
If you’ve held an asset for longer than 12 months before a given ‘CGT event’ occurs, you may be able to claim a CGT discount of 50%. Remember, a ‘CGT event’ is the point at which you make a capital gain or loss on an asset.
Fifty percent is a significant discount. If you made $40,000 profit from investments that you’d held for less than 12 months, and your marginal tax rate was 37%, you’d have a $14,800 tax liability.
However, if you’d held for longer than 12 months, the CGT discount rules would mean your tax liability was just $7,400 — a much more ‘tax effective’ amount.
The CGT discount applies to crypto investments, too.
As you can see, holding onto your investments for longer than 12 months to take advantage of this tax discount can be much more tax effective.
Navexa provides a platform where you can easily track your asset performance and calculate your taxable gains. The CGT Reporting Tool gives a detailed breakdown of which assets are ‘non-discountable’ from a CGT perspective and reduces the amount of tedious leg-work at tax time.
Navexa’s tax reporting tools remove the need to manually calculate their portfolio tax obligations or the most tax effective way to prepare a tax return.
Provided the portfolio data in your account is correct and up-to-date, you can run an automated tax report in just a few seconds.
Navexa’s Capital Gains Tax Tool
Navexa’s CGT reporting tool
What you see above is Navexa’s CGT Report.
Navexa calculates your taxable gains and displays a detailed breakdown. Capital gains are displayed according to Short or Long Term status alongside your Capital Losses Available to Offset. The report also calculates your CGT Concession Amount and finally, your total Capital Gain.
Navexa’s CGT Reporting Tool makes it easy to categorize your investments for your tax return, while the Unrealized Capital Gains report can help show the most tax efficient way to dispose of investments.
Strategy 2: Lower Capital Gains With Capital Losses
Another useful tool for investors at tax time is their capital losses.
You make a capital loss when you sell an asset for less than what you paid for it. This loss can be deducted from your capital gains (from other sources) to reduce the amount of tax. If you don’t have any capital gains to deduct from, the capital loss can generally be carried forward to future financial years. If you make capital gains in future years, the capital losses are still up your sleeve to deduct from any gains and reduce tax.
For example, if an investor owed $4,000 in CGT for their investments in a financial year, but had declared losses of $1,500 the previous financial year, they could carry these losses over to offset their capital gain, resulting in a reduced tax bill of $2,500.
Strategy 3: Invest In Companies That Pay High Dividends And Franking Credits
We’ve already looked at how the ATO taxes dividends, so what does this mean for minimizing your income tax obligations?
For example, an investor with a 32.5% tax rate receives a $1,750 dividend with a $750 franking credit attached. The franking credit takes the taxable income to $2,500, with gross tax of $812.50 payable. The franking credit rebate of $750 is deducted from the gross tax and the investor is left to pay only $62.50 in tax, leaving them with $1,687.50 after tax income. For a full breakdown of this and other franked dividend scenarios, click here.
As you can see, the investor in the above situation manages to retain most of dividend income. Because the franking credit offsets their CGT so significantly, the amount of income tax the individual pays is greatly minimized.
Choosing to invest in companies that pay dividends, especially fully or highly franked dividends, is a popular strategy for minimizing tax paid on investment returns. Fully franked dividends are effectively tax free income.
Navexa can also help you accelerate the process of determining your taxable income. When you automate your portfolio tracking in Navexa, the Taxable Investment Income tool provides you with everything you need to know to prepare your tax return.
Navexa’s Taxable Income Tool
As you can see above, the Taxable Income Tool displays the Unfranked Amount and the Franked Amount for your dividends, as well as the total Franking Credits attached to them.
And in the below image, you can see the additional fields in the ‘Supplementary’ section. These display further tax-relevant information such as the amount of Franked Distributions From Trusts, the amount of Assessable Foreign Source Income, and your Foreign Income Tax Offset.
Fully franked dividends are like tax free investment income!
Below these fields, you’ll also be provided with a holding by holding breakdown of your taxable investment income, like this:
Navexa’s holding by holding investment income breakdown
This shows you subtotals for payments from each holding, and grand totals for each column at the bottom.
At the top right of the report, you’ll find buttons for exporting the report as both an XLS and PDF file.
This helps you accelerate the process of preparing your investment income for assessment.
Dispose Of Your Investments In A Tax-Efficient Way
When the time comes that you want to sell it can be easy to get excited about the potential gains you are about to realize. This excitement can be dampened, however, when you are faced with the reality of your tax bill.
Choosing a particular method to dispose of your investments can have a major impact on the profits you generate and the tax you pay on them.
First-In-First-Out (FIFO)
The first-in-first-out (FIFO) approach is a common method used by investors when they sell holdings. When you purchase a group of shares at a given price, they will constitute a ‘parcel’.
You may acquire shares in the same company in several different. Each transaction will form its own parcel of shares.
The concept of FIFO relates to the disposal of investments. When you are ready to sell shares, you can choose which parcels — sometimes called ‘lots’ — of shares you would like to sell. The FIFO method involves disposing of the parcels that have been held for the longest period. Provided that the share price has risen since the time of purchase, the FIFO method will ensure the greatest capital gain from the sale of a selection of shares.
For example, if an investor purchased 100 shares at $20 in a company three years ago, and another 100 shares at $40 in the company two years ago, they might choose to use the FIFO method when they choose to sell some of those shares.
Let’s say the company’s share price has now risen to $50. The investor opts to sell using the FIFO method, disposing of the first 100 shares which were purchased at $20. Because the share price has grown $30 since they purchased them, they realize a gross profit of $3,000. However, if they had chosen to sell the more newly acquired shares parcel, they would only realize a gross profit of $1,000. The FIFO method is therefore popular with investors looking to maximise capital gains when they sell. But what about tax?
Last-In-First-Out (LIFO)
In the above example, the investor opted not to sell their more recently acquired shares because they wanted to maximise their capital gains. But if you are looking to minimize the impact of tax, adopting the LIFO approach could be advantageous.
LIFO works in the opposite manner to FIFO — your newest shares are sold first. The LIFO method ‘typically results in the lowest tax burden when stock prices have increased, because your newer shares had a higher cost and therefore, your taxable gains are less’.
Because the investor has chosen to dispose of shares that were bought at a higher price, they realize a smaller capital gain — and subsequently pay a lower tax bill.
However, don’t forget that you can only qualify for the CGT discount if you’ve held the shares that you sell for over a year.
The FIFO and LIFO approaches discussed above assume that the share prices involved have risen over time. This won’t always be the case. If the price of an asset drops over time, a smaller capital gain may be realized by selling the newly acquired shares. Smaller capital gain = less tax.
In some instances, investors might choose to dispose of a particular lot or parcel that cost more than the current share price so they can realize a capital loss. This capital loss could be used to offset other capital gains.
Regardless of the approach you choose, it is important to keep good records and understand the tax implications of disposing of the various share parcels in your portfolio.
We hope you’ve enjoyed this quick guide to investment tax and some of the strategies investors use to help minimize their tax bill in Australia.
Navexa doesn’t offer tax advice, and we always encourage you consult your accountant or seek other professional advice when it comes to investments and taxes.
Navexa is a platform where you can easily track your investment portfolio and display detailed information that will help you at tax time.
Navexa empowers investors to build brighter financial futures with simple, but powerful, automated investment analytics and reporting tools.
Features such as the CGT Reporting Tool and the Taxable Investment Income Tool can help you determine your obligations and opportunities when the time comes to pay the tax man.
Our guide to what is — and is not — taxable for cryptocurrency investments in Australia. From basics like capital gains tax from selling crypto, to paying tax on crypto staking income, declaring capital losses and understanding how the ATO treats DeFi.
If you’re buying and selling cryptocurrencies in the hope the Australian Taxation Office either won’t know about, or won’t be able to tax, your profits and income, I have bad news:
Crypto’s ‘wild west’ days — at least in terms of mainstream adoption and regulation — are gone.
While you’ll find many a tweet about how ‘it’s not too late to be early’, it is, in fact, too late to slide into what was once a murky, misunderstood world of strange new digital currencies.
(As an aside, I first heard about Bitcoin from a friend of a friend on a tram in Melbourne around 2013. That was early.)
The markets have grown exponentially since Bitcoin’s inception.
Today, the Australian government, like many others around the world, has a greater grasp on the cryptocurrency markets and blockchain technology than ever.
As you’ll see in this guide to crypto tax in 2022, as the technology and markets for digital currencies and assets grows and becomes more complex, so do the tax laws surrounding them.
Now, more than ever, Australians investing in (or trading) the cryptocurrency markets need to prepare themselves to accurately track, report and declare their activity.
As the ATO states:
‘Everybody involved in acquiring or disposing of cryptocurrency needs to keep records in relation to their cryptocurrency transactions.’
This guide covers basic concepts around how the government in Australia treats digital currency for tax purposes, capital gains and taxable income, tax deductions and even tax-free digital asset transactions.
Plus, we’ll introduce some useful services and tools which may be helpful in tracking and reporting all the information the ATO requires when lodging crypto information at tax time.
Please bear in mind this article is neither tax nor financial advice. It is general information collated from credible sources, including the ATO.
Bitcoin, like other digital currencies, is subject to tax in Australia.
The ATO Knows About Your Cryptocurrency
As the crypto markets and the platforms people use to navigate them have grown in recent years, there’s been an increasing emphasis on ‘know your customer’, or KYC practices.
KYC is a way both for governments to impose regulation on crypto providers, and a way for crypto providers to communicate legitimacy — and distance themselves from the criminal activity which continues to plague the fast-evolving crypto space.
In Australia, this means you can’t register for a crypto exchange or wallet without providing documents and details that prove your identity (like your driver’s license or passport) and address.
The crypto providers, in turn, must provide details on their customers to the ATO, which began collecting details in 2019 to ensure Australians active in the crypto markets were complying with tax laws.
So if someone doesn’t declare their crypto activity, that doesn’t mean the Australian government won’t know about it. And, when someone does report it, the ATO can match what’s reported with what they have on file as a result of their data matching program protocol (the current version of which runs until 2023).
In other words, it’s probably not going to work out well for those who attempt to dodge declaring their crypto activity or paying tax on it — see here for more.
The ATO Can Legally Tax Australian Residents’ Crypto Activity
Australian tax law and the ATO have caught up to the crypto markets significantly in the past few years. As we mentioned, the wild west days are over. While Bitcoin survives, it’s now one of thousands of digital currencies.
Today, those investing in and trading ‘virtual currency’ need to accept taxation as a given, just as they would with traditional stocks and other assets.
As the crypto space continues to expand in bold new directions (while initial coin offerings were once crypto’s hottest topic, NFTs are the latest booming multi-billion dollar acronym), the tax regulation surrounding it grows ever more complicated.
Below, you’ll find introductions to many different tax scenarios surrounding various areas of the crypto markets (like DeFi and staking).
The basic premise though, is this: The ATO does not treat virtual currencies like currency at all. It’s not ‘money’ for tax purposes. They treat digital assets as property.
For the purposes of applying capital gains tax, or CGT, the ATO treats crypto like any other investment asset (like shares or property). In other cases, it will treat crypto as taxable income.
The ATO makes a distinction between two types of crypto activity.
The ATO can tax trading, staking, and other blockchain activities.
The Difference Between Investing In & Trading Cryptocurrency
As in the traditional investment markets, there’s a distinction between investing and trading in crypto, too. Some people buy some Bitcoin or Ethereum in the hope they’ll someday realize a huge profit.
Others will buy and sell frequently, perhaps even as their full-time job.
With crypto, the ATO makes this distinction between investors and traders.
How a person classifies their crypto activity has a significant impact on how they’ll be taxed on it in Australia.
You’re A Crypto Investor, If…
You are an individual buying crypto for the purpose of generating a future return. This means you buy and sell digital currencies as you would shares in a company, with the same goal — profiting from long-term capital gains as those assets rise in price.
Generally speaking, most Australians in the crypto space would be classed as investors by the ATO.
You’re A Crypto Trader, If…
You use crypto activity to make an income from a business. This includes short-term buying and selling, mining crypto, and operating an exchange, for example. Whatever proceeds you generate from your crypto business activities, the ATO treats as taxable income.
Obviously, given the ATO’s oversight on crypto activity in general, both of these use cases demand detailed record keeping, regardless of how seriously or casually one is active in the market.
The big difference from a tax perspective is that while investors can qualify for capital gains tax discounts (resulting from holding an investment longer than 12 months), traders cannot, since their crypto profits are classed as taxable income, not capital gains.
For the purposes of this explainer post, we’ll focus on crypto investing, not trading.
Which Crypto Activity Does The ATO Tax?
In short, everything. The ATO classifies four main CGT events for crypto activity.
You’ll be taxed when you:
Sell cryptocurrency (or gift it to someone).
Exchange one crypto for another.
Convert crypto to fiat currency like AUD.
Pay for good or services in crypto.
These are just the main taxable events the ATO looks at. We’ll get to the more complex scenarios shortly.
First, it’s worth noting that the ATO doesn’t consider a digital crypto wallet as an asset. Rather, it treats the individual crypto assets within a wallet as separate CGT asset (the same way that an investment portfolio is not taxable — the investments within it are).
There are some similarities between cryptocurrency taxation and traditional investment taxation.
Paying Tax On Crypto Capital Gains
Australians pay capital gains tax on their crypto investments at the same tax rate they pay on their personal income for the financial year.
So, for example, if someone earns $100,000 from their employment and makes a $20,000 profit from selling some Bitcoin and Ethereum, they’d held for less than 12 months, their capital gains tax rate would be 32.5%.
This means they would be taxed $6,500 on the capital gains they realized by selling their crypto.
It’s important to note that capital gains tax rates differ for individuals, companies and self-managed superannuation funds in Australia.
Australian tax law makes a distinction between long term and short term capital gains. This effectively incentivizes investors to hold investments for more than a year.
In the example above the investor has held their Bitcoin and Ethereum for fewer than 12 months before selling and realizing their capital gain.
This means they pay the same tax on their crypto gains as they do their personal income (for tax purposes, capital gains profits are added to other income to determine the tax rate).
But if they held the Bitcoin and Ethereum for more than 12 months, they’d qualify for a 50% CGT discount.
So, instead of paying $6,500 of their $20,000 capital gain, they’d only need to pay $3,250 — substantially less money.
Learn more about capital gains tax obligations in Australia here (ATO) and here (NAB).
Declaring Capital Losses On Crypto
Of course, people don’t always sell cryptocurrency for a capital gain. If someone bought 100 Solana at $100, got excited when it rose to $150, but then panicked when the coin dipped back to, say, $70, they might choose to sell to stop any potential further losses.
In that case, they’d be selling for $7,000 a crypto investment they paid $10,000 for in the first place — realizing a $3,000 capital loss.
Firstly, they don’t need to pay any tax on the $7,000 they received from selling the asset, since it represents a loss. Secondly, they can deduct that $3,000 loss from any other capital gains they might declare in the same — or a future — financial year.
Going back to the previous example, assuming someone needed to pay a $6,500 capital gains tax on their crypto profits, but had in the previous year realized a $3,000 loss, they could apply that loss in their current tax return, bringing the total payable CGT on their crypto down to $3,500.
Declaring a capital loss on crypto can allow an investor to offset gains they may have realized not just on other crypto, but on shares or property. They cannot, however, carry them over as a deduction on regular income.
Crypto-to-crypto trades are generally considered CGT events in Australia.
Paying Tax On Crypto-To-Crypto Transactions
The ATO doesn’t just view selling crypto for fiat currency (like AUD) as a CGT event. It also requires Australian investors report any crypto-to-crypto transactions for capital gains tax.
Remember, for tax purposes in Australia, every asset within a digital wallet is considered a separate CGT asset. So when people trade between different assets within a wallet or on an exchange, they need to track and record this like any other investment CGT event.
Since crypto is effectively property as far as the ATO is concerned, its value is based on a given currency’s market value at a given time.
Here’s an example to illustrate crypto-to-crypto tax in action:
Crypto-Crypto CGT Example
An investor trades some ETH for some SOL.
Say they bought $2,000 worth of ETH. Over three years, their $2,000 investment rises to $6,000.
Then, they trade it for $6,000 worth of SOL. By doing so, they realize a capital gain of $4,000, because they’re effectively ‘selling’ out of their ETH investment. It’s just that they’re realizing their gain in SOL, as opposed to AUD.
So while they don’t convert any crypto back into AUD, they still need to declare this trade as a CGT event when they file their tax return.
Similarly, had their ETH investment fallen by 50% to $1,000, and they’d traded that for SOL, they’d be able to declare a capital loss of $1,000.
Transferring crypto between different digital wallets is not a taxable event in Australia, since people don’t realize a capital gain by doing so.
Staking = taxable income
Crypto Staking Rewards = Taxable Income
Crypto ‘staking’ is a blockchain mechanism whereby holders of particular cryptocurrencies can contribute to the coin’s blockchain by making their coins available to help validate transactions.
If that’s too complex, don’t worry. The simpler way to think of crypto staking is like a savings account that pays interest.
When you stake crypto, you earn more of that crypto back as a percentage of the amount you choose to stake on its blockchain.
For example, say I have 100 SOL worth $10,000 ($100 each) and I choose to stake it at a rate of 7% per annum. Nine months later, I ‘unstake’ my SOL and receive an extra 5.25 SOL in staking rewards.
Let’s say in the nine months I staked my SOL, the value rose 50%.
So when I receive my new 5.25 SOL, they’re worth $787.50 — the market value at the time I receive them.
How To Treat Staking Rewards For Tax Purposes
Unlike the other transactions we’ve looked at so far in this post, the ATO considers staking rewards as ordinary taxable income.
This is different from a capital gain. In this case, the $787.50 gets added to my regular income (like my salary, for example) and taxed at the appropriate personal tax rate.
In other words, it’s taxed like interest I might earn from keeping money in a savings account.
But, were I to sell the extra SOL I earned by staking my initial investment, I would have to pay capital gains tax on that — although the base price would be the market value at the time I received it, not the price I paid for the initial investment.
Crypto Tax On Decentralized Finance (DeFi)
Decentralized Finance, or DeFi, is one area of crypto where Australian tax policy is seemingly still playing catchup.
DeFi is, in basic terms, is the finance marketplace on the blockchain. As the name suggests, this is finance without centralization — or intermediaries like banks, finance brokers or credit card companies.
DeFi protocols allows people to lend and borrow capital through blockchain-based peer-to-peer financial networks.
While you could argue DeFi is still in its infancy, reports suggest there is already nearly $1 trillion ‘locked’ into DeFi protocols such as Aave (AAVE), Solana (SOL) and Uniswap (UNI).
At this stage, while the ATO doesn’t have any specific guidance as yet, this doesn’t mean that DeFi activity can’t be taxed.
If someone uses a DeFi protocol to earn crypto, chances are the ATO would consider this taxable income. And like crypto staking, if they sold or traded any crypto earned through DeFi, this would trigger a CGT event.
This excellent guide details the possible tax implications of various DeFi actions.
Crypto investors are entitled to certain tax breaks in Australia.
Tax Breaks For Australian Crypto Investors
It’s not all tax obligations when it comes to crypto activity for Australian investors.
As with traditional investments, there are three main ways the ATO offers tax relief.
The first is the standard personal income tax break on the first $18,200 of personal income. While it’s probably unlikely someone in the crypto markets would make less than that in a financial year, it is, technically possible to pay no tax on crypto gains in this respect.
Second, the 50% capital gains tax discount is not to be underestimated. If someone realized $100,000 in gains on crypto they held less than 12 months, and that gain is taxed at the highest rate (45%), they’ll net just $55,000.
But, if they tactically hodl longer than 12 months before realizing the gain, that $45,000 tax bill comes down to $22,500 — meaning they keep $77,500. This is a significant financial difference when you consider that the difference between ‘less than’ and ‘more than’ 12 months is a single day.
The third way Australians can qualify for a crypto tax break is through personal use. The window for claiming crypto activity as personal use is quite small. Basically, if someone buys up to $10,000 worth of crypto and then immediately buys something else with it, they can claim personal use (as opposed to investing for a future gain).
As with everything when it comes to crypto tax, it’s always important to closely track and record every transaction. The burden of proof is on investors to produce the records required to prove what they claim in their tax return.
Tax-Free Crypto Transactions? They Exist!
Not only are there tax breaks available to those investing in crypto in Australia — there’s even a list of crypto transactions that trigger no tax events.
These are, of course, transactions in which the person probably won’t make a significant profit.
Australian investors won’t pay crypto tax when they:
Buy cryptocurrency
Receive cryptocurrency as a gift
Give cryptocurrency as a charity donation
Hold cryptocurrency (even if it goes up 10,000%)
Receive cryptocurrency from ‘hobby’ mining
Move cryptocurrency between digital wallets
Buy goods and services up to the value of $10,000 using cryptocurrency (see the personal use scenario above)
Where To Find Tools & More Information About Crypto Tax In Australia
It might seem difficult to understand the nuances of crypto tax law in Australia. But the reality is that for the average crypto investor —someone who buys and sells crypto with the objective of making some money — it should be pretty straightforward.
By and large, you could apply the same tax rules to your crypto portfolio as you would for investments in stocks.
If you sell an investment for a capital gain, you’ll need to pay a capital gains tax.
If you make money from an investment, you’ll need to declare it as income and pay tax at the marginal rate applied to your total income for the financial year.
But, as you’ve seen in this post, things can quickly grow more complex the deeper you get into the crypto markets.
Here at Navexa we’re proponents of continuously searching for and acquiring financial literacy.
Here are some resources we consulted in putting this guide together that may help you with your own crypto investing and tax reporting:
As always, seek professional advice and support when considering investing and its tax implications!
Navexa helps speed up the crypto tax reporting process
Navexa: Automated Tracking For Crypto Capital Gains & Income
If you’re investing in cryptocurrencies and you’d prefer a quick, automated way of not only tracking your portfolio performance and returns, but also of generating comprehensive, accurate tax reports, try Navexa.
We’ve developed Navexa to give investors radical insight into how their portfolio performs over time.
Not only does the platform break down your total return by capital gains and dividend income, it calculates the impact of trading fees on your portfolio performance.
As you may already know, trading fees can have a massive impact on crypto transactions. The Ethereum blockchain has been notorious in recent years for slapping users with transaction fees which often outweigh the value of the coins being transacted.
If you don’t consistently and accurately track the impact of fees on your crypto investments, you may end up with a distorted picture of how they’re performing.
Proper tracking is also a requirement if you find you need to provide detailed information to the ATO regarding your tax return. As we outlined above, you need to be able to show the fine details of transactions to substantiate capital gains, losses and income that you’re claiming in a tax return.
While you can pull this information together using data from exchanges and wallets, Navexa allows you to consolidate your crypto portfolio data even if you trade across multiple platforms.
Remember the 50% capital gains discount the ATO offers on crypto investments held longer than 12 months? If you’re filing a tax return containing 100 trades off various sizes across 100 different dates within the financial year, calculating which qualify for the CGT discount could quickly become a headache.
With Navexa’s tax reporting tools, this calculation is completely automated — your account gives you a detailed breakdown of which holdings qualify and which do not in a single click (so long as all your portfolio data is accurate and up to date!).
We’ve built (and are constantly) developing Navexa’s analytics and reporting tools to empower investors in stocks and crypto to get powerful insights into their portfolio performance and make calculating and reporting tax details fast and easy.
If you invest in Australia, the Australian Taxation Office requires you pay tax on both capital gains and dividend income. Here are some basic things to know about paying tax on your investments in Australia.
Paying a portion of our income to our government has long been a fact of life — the phrase ‘certain as death and taxes’ stretches back more than 300 years.
In Australia as elsewhere, this goes for income we earn from employment, a rental property, and other sources. It also applies to investment income.
Below, you’ll find information (general, of course, and not in any way to be considered financial or taxation advice!) about:
The Australian tax year and cycle.
Capital gains tax (CGT) events for investments (long and short term).
Taxable investment income from dividends.
Different ways you can report on your investments for tax purposes.
Tax benefits from ‘franked’ dividends.
Let’s start by explaining the Australian tax cycle.
Tax Time: Key Australian Dates
These are the key dates to keep in mind for calculating your portfolio tax and filing your tax return in Australia.
The income year for tax purposes — otherwise known as the ‘financial year’ — goes from July 1 to June 30.
This is the period for which you’ll need to collect and collate your financial information for assessment during the period known as ‘tax season’.
Australian Tax Season
Tax season runs from the start of the next financial year (July 1) to October 31 — a period of four months.
If you’re lodging your own tax return, you have until October 31 to do so. If you use a registered tax agent, you have a little longer — usually May 15 the following year.
Check with your accountant or the Australian Taxation Office (ATO) to ensure the key dates for your specific situation.
If you’re an investor, you’ll need to report on your portfolio’s activities during the relevant financial year. Here are the main things you’ll need to consider as an individual.
Capital Gains Tax On Investments In Australia
Australian tax law specifies that you must pay tax on any assets you own when you sell them, or when another ‘CGT event’ happens to them.
At its most basic, this refers to selling shares. But it covers many other events, too, including switching shares in a managed fund between funds and owning shares in a company which another company takes over (or merges with).
What Is The Capital Gains Tax Rate?
Australians pay CGT on their investments at the same marginal tax rate they pay on their personal income for the financial year.
So, for example, if someone earned $100,000 from their employment and also made $20,000 from selling shares they’d held for more than 12 months, their marginal tax rate would be 32.5% — meaning they would need to pay $6,500 in tax on the capital gains from their investments.
The CGT rate differs for individuals, companies and self-managed superannuation funds.
If someone sell some shares for a capital loss, this may result in tax benefits, since they can deduct that loss from any gains they may have realized on other assets. If they didn’t make any capital gains (only losses) in a given financial year, they can carry a capital loss over to other financial years!
Long Term & Short Term Capital Gains
Australian tax law makes a distinction between long term and short term capital gains. This is effectively an incentive for investors to hold investments for more than a year at a time.
In the example above, where someone makes a combined $120,000 in the financial year from their employment and selling some shares, they’ve held those shares for less than 12 months.
This means they pay the same tax on their investment profits as they do their personal income (for tax purposes, capital gain profit gets added to other income to determine the marginal tax rate).
But if that person held the shares for more than 12 months, they’d qualify for a 50% CGT discount. Instead of paying $6,500 of their $20,000 capital gain, they’d only need to pay $3,250.
How To Calculate Your Portfolio’s Capital Gains Tax Obligations In Seconds
Bearing in mind we’re only talking about the capital gain side of portfolio tax, it’s easy to understand why so many of us don’t exactly look forward to tax time.
Navexa’s tax reporting tools are powerful ways to remove the need for someone to have to manually calculate — or pay someone to manually calculate — their portfolio tax obligations.
Navexa’s CGT Reporting Tool
Navexa’s Capital Gains Tax Tool
What you see above is Navexa’s CGT Report.
Once you track your investment portfolio in a Navexa account, you can access a suite of analytics about everything from individual holding performance through to portfolio contributions, and of course tax analysis.
Provided the portfolio data in your account is correct and up to date, you can run an automated tax report in literally a few seconds.
The CGT Report Breakdown
As you can see in the sample image above, Navexa calculates your taxable capital gain and displays a detailed breakdown.
Under ‘Non Discountable Capital Gains’ you have:
Short Term Gains: The capital gains you’ve made on assets sold within 12 months of buying them.
Capital losses available to offset: Any capital loss you’ve realized by selling assets for less than you paid for them.
Under ‘Discountable Capital Gains’ you have:
Long Term gains: The capital gains you’ve made on assets sold after holding them for 12 months or more.
Capital losses available to offset: Any losses realized from assets you’ve sold after holding longer than 12 months.
Then you have your CGT Concession Amount and, finally, your total Capital Gain for the portfolio (for the financial year and tax settings you’ve selected).
It’s important to note that Navexa doesn’t provide tax advice. But as long as your account information is accurate and up to date, this should be all you need to file your return.
At the top right of the report, you’ll find buttons for exporting the report as both an XLS and PDF file.
So now you understand the basics of capital gains tax for investments.
Let’s dive into the income side of the portfolio tax equation.
Intelligent Portfolio Performance Tracking
Track Australian & US trades, cryptos, cash accounts, currency gain, dividend income and more with the Navexa Portfolio Tracker.
Capital gains isn’t the only form of investment income people pay tax on in Australia. Just like income from a rental property, dividends count, too. You must declare investment income.
Dividends, of course, are payments made to shareholders as a percentage of an investment’s profits. These profits have generally already been subjected to Australian company tax. Thus, the ATO doesn’t tax shareholders again on the already taxed profits when they’re distributed as dividends.
Franking Credits
This is where ‘franking’ credits come in. If a dividend is ‘fully franked’, it means the ATO judges it has already been taxed appropriately.
Depending on where an investor’s personal tax rate falls relative to the rate at which their dividends have been taxed (and had the appropriate franking credits distributed with them), they’ll either pay less than their personal tax rate (a tax offset) or, in some cases, a tax refund.
If someone receives new shares instead of a cash dividend, they need to pay tax on them as though they did receive cash.
Like a cash payout, reinvested dividends may be partially or fully franked, since they still represent investors receiving a portion of profits.
How To Calculate Your Taxable Investment Income Obligations In Seconds
Navexa doesn’t just allow you to skip the hassle of working out your portfolio’s capital gain for a financial year.
It also lets individuals drastically accelerate the process for determining their taxable investment income, too. Take a look:
Navexa’s Taxable Income Reporting Tool
Navexa’s Taxable Income tool
When you automate your portfolio tracking in Navexa, the taxable investment income tool gives you everything you need to know when preparing your tax return.
You can see unfranked and franked amounts of investment income across your portfolio and the actual franking credit amount.
In the ‘Supplementary’ section, you’ll see six other fields:
The Taxable Income Report Breakdown
Share of net income from trusts, less capital gains, foreign income and franked distributions
Franked distributions from trusts
Share of franking credits from franked dividends
And in the ‘Income from foreign sources and assets section’:
Assessable foreign source income
Other net foreign source income
Foreign income tax offset
Below the return fields you’ll see a holding by holding breakdown of your taxable investment income, like this:
This shows you subtotals for payments from each holding, and grand totals for each column at the bottom.
At the top right of the report, you’ll find buttons for exporting the report as both an XLS and PDF file.
This is the automated way to fast-track preparing to declare investment income for assessment.
Trading Stocks? Track Them With Navexa
Import your portfolio in seconds. Track your investment performance. Automate your tax reporting & more.
We hope you’ve enjoyed this guide to the basics of portfolio tax in Australia.
We’ve covered the main points of tax implications for both capital gains and investment income (including franking tax offset).
There are, of course, many more scenarios and details than what we’ve had time to cover today.
As always, consult your accountant or seek other professional advice, and ensure you manage your tax obligations and tax return responsibly.
Try Navexa Today
Navexa empowers investors to build brighter financial futures with simple, but powerful, automated investment analytics and reporting tools.
The CGT and Taxable Income reporting tools we’ve detailed here are just two of the tools at your disposal when you automate your portfolio tracking with Navexa.
Powerful ideas on building life-changing wealth — from passive income investment strategies to staying calm through stock market crashes and financial crises.
How much do you think a person needs to invest to make a million dollars?
$100,000? $250,000?
Try $1,525.
If you invested $1,525 today in a fund that tracked the Australian stock market’s growth over the next 20 years — and you committed to investing that much every month — your portfolio would grow to just over $1 million.
While past performance is never any guarantee of future returns — and this post most definitely does not qualify as financial advice — going by that historical return, a meagre $352 a week is all it would have taken to build a million-dollar portfolio in those 20 years.
When you consider that putting that much into a savings account would have yielded not even half that over the past 20 years, it’s clear why some of us are prepared to accept more risk when we’re considering which long term investments we want to put our money in.
It seems simple, doesn’t it? Creating a significantly brighter future financial situation for yourself (and your family) is a matter of socking away money on a regular basis — personal circumstances permitting, of course — and letting the market work its magic.
As you’re about to see, executing a successful long term investment strategy isn’t as easy as it may seem.
You need some key ingredients: Financial education and literacy, clear investment objectives, a solid grasp of personal finance, and a specific investment timeframe or horizon, to name a few.
This post introduces some key ideas around investing for long term success and financial freedom.
Read on to discover some of the fundamental ideas and factors for those looking to build long term, life changing wealth through consistent and patient investing.
Examples Of Long Term Investment Strategies’ Epic Performance (Despite Multiple Stock Market Crashes)
Seth Andrew Klarman is a billionaire. The private investment partnership he founded in 1982 has realized a 20% compounded return for the past 40 years.
Let that sink in for a moment.
Twenty percent a year. For 40 years.
What started as a $270 million fund has grown to be worth around $270 billion.
In that time, the US stock market has, according to Wikipedia, crashed 10 times.
The 1987 Black Monday crash alone was enough to inflict serious, lasting financial damage to someone in my own family. The rest of their life they had to live with consequences of having sold in panic as investors all over the world rushed to get out.
But over Klarman’s 40 years running his investment portfolio, none of the 10 crashes have, in the long term, impeded him from racking up what most of us would agree is insane wealth.
According to him:
‘The daily blips of the market are, in fact, noise — noise that is very difficult for most investors to tune out.’
‘Klar’, by the way, is German for ‘clear’.
Whether or not Klarman’s name had any bearing on the way he viewed the markets during his four decades (so far), it’s certainly clear that ignoring the so-called ‘noise’ in favour of a long term strategy has been immensely profitable for him and his investors.
Noise: The Enemy Of Successful Long-Term Investing
When we talk about market noise, we’re talking about a lot of things.
Daily price movements, economic changes that impact the markets, like interest rate rises, and news flow are three common examples.
Even the talk of interest rate rises — amplified of course by the media — has been causing market jitters in early 2022.
Here’s a quick example of just how useless most noise is — and why smart investors like Seth Klarman ignore it, preferring instead to focus on their strategy.
The chart shows you the S&P500 index between 2009 and mid 2017. As you can see, annotated along the line is every time the financial media claimed ‘the easy money has been made’.
In other words, nine times they claimed the good times were over for the S&P500…
That things were about to get tough for investors…
That you should perhaps be scared about what was about to happen to the stock market.
And yet, while in the short term the S&P500 did indeed fluctuate — sometimes severely and abruptly — over the seven-and-a-half years this chart shows, it still doubled in value.
We can’t know how many people were scared into selling their stocks each time they read a ‘the easy money…’ headline. But, you can bet there were quite a few.
I know people who won’t even get into the stock market on account of the fact values can fall, let alone stay in stocks they own through volatile or uncertain times. Such is their appetite for investment risk (zero).
Getting back to Seth Klarman’s point…
Successful Long Term Investing Demands That You Can Stomach Volatility, Noise & Risk
‘Get rich quick’ has become virtually synonymous with ‘scam’. You read those words and you know there has to be a catch.
While it’s true that some investors do bag huge gains from speculative investments like penny stocks, it’s very rare that they’re able to repeat those successes by applying any sort of discipline or formula.
Getting rich quick, we could say, depends on luck. You have to be in the right investment at precisely the right time and you have to sell it before it plummets back down to earth (as many do).
Getting rich slowly, on the other hand — building financial freedom and exponential wealth by investing like the Seth Klarmans and Warren Buffets of this world — depends on something else.
Building financial freedom through investing depends on discipline.
As you’re about to see in this post, you have to cultivate discipline around your saving, spending and investing habits. You have to be honest with yourself about your goals. You have to understand how much risk, volatility and stress you’re prepared to tolerate. You have to start thinking in decades, not years — and certainly not months or weeks.
In other words, you have to find or create a long term investing strategy that you feel comfortable and confident is going to result in the financial freedom you seek.
And, of course, you have to get wise to short-term market noise like attention-grabbing headlines about the easy money having already been made.
What follows are some generally-agreed upon solid ideas and approaches from both the investment industry and the financial freedom (or FIRE) community.
(Again, NOT financial advice 🙂)
Find Your Investing Mindset & Bring Order To Your Finances 🔥
If you’re yet to begin investing, or you’ve started but are still caught up in the idea of getting wealthy fast, then you need to lay the groundwork for your strategy.
A solid long term wealth building strategy can’t exist without a strong foundation of financial literacy, discipline and clarity.
This means you need to get into the weeds on every aspect of your financial life.
You need to have a firm grasp on your whole financial position as it stands: Income, debt, expenses, savings, everything. Why? Because successful investing — no matter whether you’re aiming to make $100,000 or $100 million — depends on a few key principles.
Three Rules For Investing Long Term
Here are three tenets the FIRE community generally accepts as foundations for building wealth:
Spend less than you earn.
Invest the difference.
Continuously look to widen the gap between what you spend and what you earn.
If you don’t fully understand your personal finances, you’re not going to be able to confidently and consistently spend less than you earn.
And consistency, as many in the investing world can attest, is crucial to successful long term investment strategies.
The Power Of Investing Consistently Over The Long Term
Take a look at this:
Source: https://www.lynalden.com/build-wealth/
This table shows you how much your portfolio would be worth 25 years from now based on different monthly investments, which you can see on the Y axis, at different annual rates of return, which you can see along the X axis.
As you can see, just $750 a month ($9,000 a year) has the power to become more than $1 million.
That works out at $173 a week. So when you see a table like this, ask yourself:
How much money are you prepared to commit to become a millionaire?
If you’re not — or if you don’t have $173 a week at your disposal — then you need to assess your goals, priorities and your financial position.
Remember, the first rule is that we should spend less than we earn and invest the difference.
The Australian stock market returned an average 9.7% between 1991 and 2021, according to Canstar.
Going by the 25-year table above, a monthly investment of $1,500 would hit $1 million at that rate.
As you can see, the most powerful factor here is time. Remember Seth Klarman’s portfolio performance and opinions regarding ignoring market noise.
And consider this:
The stock market is extremely efficient at transferring wealth from the impatient to those who are patient
While there’s lots to learn and much to gain from following in the footsteps of great investors, it’s important your investment strategy suits you first, not someone else.
(If I had a dollar for every person who says they subscribe to ‘the Benjamin Graham method’, I wouldn’t need my own investment strategy.)
Idea #1: Buying Exchange Traded Funds
Exchange traded funds, or ETFs, have been growing in popularity in recent years — particularly among the FIRE community.
You can buy an ETF like you would any shares on the stock market. The difference is these funds are structured to track indexes, sectors and other specific market themes.
For example, I recently bought shares in an ETF that tracks the Dow Jones technology index. This means I’m exposing my capital to the progress of that entire market, as opposed to picking out a particular company to invest in.
Many long term investors and financial freedom seekers favour ETFs as they are relatively ‘low touch’ — you can buy them easily and bypass the need to conduct research into individual securities.
Think of ETFs as a door through which you can access different parts of the markets and financial system. You might choose an ETF than tracks growth stocks in Asia. Or, you could choose one that tracks a particular commodity or currency pair. Index funds, while different investment vehicle, can service a similar function, as do mutual investment funds.
Idea #2: Buying Growth Stocks & Value Stocks
While you can bypass researching individual stocks using ETFs or index funds, you might actually prefer to invest directly in particular stocks.
One thing you’ll need to understand when building and managing your investment portfolio is diversification. This is a good place to start.
If the risk tolerance, strategy and investment timeline allow for it — and if an investor can commit to doing in-depth market and company research — they may choose to invest in companies.
While there’s a lot of different types of companies trading on the stock market, from the miniscule (speculative penny stocks) to the mammoth (Tesla, for example), across all sorts of criteria and risk profiles, let me introduce you to two types you might find in a long term investment portfolio.
Pocket Rockets For Your Portfolio 🚀
Growth stocks are the jet boats of the stock market. They’re exciting, attention-grabbing companies that carry both higher promise and higher risk relative to more established, stable companies.
These stocks often tend to be technology companies, and are often smaller companies that are in the midst of capturing market share. According to Bankrate, these companies ‘generally plow all their profits back into the business’, since they’re in the process of expanding. This means they may be less likely to pay dividends to their shareholders, who rely instead on rising valuations to generate returns on their investments.
Growth stocks don’t necessarily have to be small-cap companies. Generally speaking, investors probably need to be prepared to be more active when it comes to owning a growth stock, since their value can rise and fall faster than blue chip companies. This means a ‘set and forget’ strategy which may be appropriate for ETF investing may not apply to riskier growth stocks.
Trading Stocks? Track Them With Navexa
Import your portfolio in seconds. Track your investment performance. Automate your tax reporting & more.
Value stocks, on the other hand, present a very different prospect for an investing strategy. If growth stocks are jet skis, value stocks are a cruise ship.
In basic terms, a value stock is a company that is trading at less than their ‘true’ value. How you determine that value isn’t an exact science. There are several methods you can use to calculate whether a company’s share price is trading at a discount on its fundamental value (one of the most common methods is the discounted cashflow calculation, which you can run in our portfolio tracker for free).
Value stocks often display high dividend yields and low price-to-earning ratios. They tend to be big companies that don’t have much room left to grow relative to their smaller, more dynamic counterparts, but which can also produce higher long-term returns (even if they may not deliver spectacular short term gains like a growth stock).
Value stocks might suit more of a low-touch, buy-and-hold type of investment strategy. For many seeking financial freedom, the prospect of lower share price volatility and a steady stream of dividend income makes value stocks a sensible inclusion in their portfolio.
It’s worth noting as well, that there are ETFs on the market that track value stocks — meaning you don’t necessarily have to approach value investing company by company.
Idea #3: Dividend Stocks & Passive Income 💵
For many on the financial freedom trail, dividends are king. Here’s why.
What you see here is the power of income in a long term investing strategy.
The red bars represent the annual returns over 40 years of holding a stock that rises an average 8% a year and collecting the dividend payments as cash.
The blue bars show you the same investment with reinvested dividends over the same time period.
If you held the stock and pocketed the dividend cash, after 40 years a $50,000 investment would have grown to around $1 million.
But if you reinvested those dividends — meaning you opted to receive additional shares as opposed to cash — you would end up with more than $3 million.
That’s a substantial difference. Of course, the example doesn’t account for what you could have done with the cash if you’d taken it instead of reinvesting it (more on that below).
Why Income Investing Suits Long Term Investment Strategies
Remember the three points from the start of this post:
Spend less than you earn.
Invest the difference.
Continuously look to widen the gap between what you spend and what you earn.
You can understand why income investing is so attractive for those seeking financial freedom.
Dividend reinvestment hits all three of these action items. This is why so many investment strategies include income investments.
Once I’ve bought your shares and committed to leaving them for a long period, I don’t need to put any more of my regular income into the stock.
As the stock pays me dividends in the form of more shares, I automatically invest the difference.
And, even better, the more shares I accumulate through dividend reinvestment, the more I widen the gap between what I spend and what I earn (remember that in the example above I start with just $50,000 and end up earning nearly $3 million through capital gains and reinvested income).
Intelligent Portfolio Performance Tracking
Track Australian & US trades, cryptos, cash accounts, currency gain, dividend income and more with the Navexa Portfolio Tracker.
Einstein’s Theory Of Compounding Investment Returns 🔬
Income investing is popular for good reason. Especially with those looking to invest for long term wealth.
If you decide to make dividend stocks (or ETFs — remember ETFs exist for most markets and sectors, and you can find plenty of income-focused funds on the market) part of your long term investment strategy, you’ll be in good company.
Legend has it that someone once asked Albert Einstein what he thought was the eighth wonder of the world.
His response: ‘Compound interest’.
‘He who understands it’, Einstein said, ‘earns it. He who doesn’t, pays it’.
Wise words worth keeping in mind as you assemble your plan to build long term financial freedom!
Aim For ‘Infinite’ Investment Returns ♾️
If this sounds a little ‘hidden secrets of the rich’, that’s because it is.
Infinite returns are ultimately what you should aim for if you aspire to the sort of financial freedom the world’s wealthiest long term investors are able to enjoy.
The idea behind the term is that you buy an investment, which makes you money (either through capital gains, income, or both) and then you sell your initial stake at a certain point.
For example, say you buy $50,000 worth of shares in an ETF that tracks relatively stable, income-paying companies. You leave it alone for five years. Between capital gain and reinvested dividend income, your position grows to be worth $100,000. Then, you take out your initial $50,000, and leave the investment to run on profits alone.
If you consider the dividend reinvestment illustrations above, just imagine that the $50,000 you start with in the 40-year example was the result of profit from a previous investment.
The, imagine you do it again. What started as $50k profit becomes the capital for a new investment. Then that investment generates its own profit, allowing you to free up the $50k and continue ‘cycling’ through new opportunities.
This is the essence of infinite investment returns. Of course, this explanation makes it sound super straightforward. Like everything in the investing world, this strategy carries risk.
But when you adopt the long term investing mindset…
And you’ve learnt to ignore the market noise that triggers so many into FOMO buying and panic selling (I literally saw this in the course of writing this post)…
And you’ve structured your personal finances in such a way that consistently investing in the assets you want your money in for the long term without adversely impacting your day to day…
Then the prospect of infinite investment returns becomes more and more attainable the longer you stick to your plan.
If buying a lotto ticket is one extreme of the investing world, then infinite returns are the opposite extreme. They don’t happen overnight and they take time and sacrifice to create.
As Blake Templeton, of Forbes, points out, building wealth is a long term game.
‘Those dreams of hitting it big in the stock market are exciting, but they rarely come true. Instead, focus on building long-term wealth that grows consistently over time, like the super-rich. When you use their same strategies for wealth-building, you set yourself up for exponential gains that you can pass down to future generations.’
Takeaways: Continuously Invest In Knowledge — And Track Everything As You Go 📈
Perhaps the most important investment you’ll ever make on your journey to financial freedom through long term investing is in yourself.
(Yes, you’ve probably read versions of that a thousand times on Twitter. But it’s for a reason!)
At a high level, you have to back yourself to create the discipline, strategy and trajectory that will allow you to realize your vision of financial freedom.
Once you’re making progress though, it’s not only financial assets you need to invest in. You should also make time to build your knowledge of finance, investing, economics and useful information about the wider world (as opposed to ephemeral, short-lived ‘noise’).
That means making connections, reading books, listening to podcasts and following blogs (like this one, obviously). Like everything in life, the investment world never stays still. Change is constant and often dramatic.
Trends shift and investment strategies that work today may no longer work next year — see the ructions over the US Federal Reserve’s announcement about (finally) raising interest rates in early 2022.
Make sure you have good sources of information to keep building your financial literacy and stay informed of the deep themes and trends at play in the world and its markets.
Track & Analyze Your Portfolio Consistently
Most of all, make sure you have good sources of information about your own financial position and portfolio progress. As Peter Drucker points out:
‘What can’t be measured, can’t be improved.’
As so many people have found when they start tracking their fitness, their diet or their personal finances, you start behaving differently when you can fully grasp your long term progress.
Long term investing is no different.
Whether you’re investing $500, or $1,000, or $5,000 a month towards financial freedom decades down the line, you’re going to need to accurately track your progress.
This is what we specialise in here at Navexa — advanced investment analytics for everyday people looking to build long term wealth.
The Navexa Portfolio Tracking Platform
If noise is the enemy of long term investing, then proper portfolio tracking is one of your best defences against it.