Categories
The Benchmark

Unskilled 24-year-olds running Wall Street

July 22, 2024


‘Cynical bastard’ exposes Wall St. excesses

Dear Reader,

Shortly after his book Liar’s Poker came out in 1989, Michael Lewis took his seat on a flight to the US.

He was travelling to begin the book tour, and he intended to spend the flight re-reading his part-biographical, part-journalistic, dive into the wild world of Wall Street bond trading in the 1980s.

Within seconds of pulling the book out of his carry-on, the passenger next to him turned and spoke:

I’ve read that book,’ he said.

Lewis went to answer, but before he could:

Cynical bastard!’

This was a seven-hour flight. A long seven-hour flight.

This would not be the first time Michael Lewis published something that exposed aspects of the investing world which provoked reaction.

From the history of art to the mystery of money


Michael Lewis in his office (source)

Michael Lewis wanted to be an art historian.

He graduated from Princeton University having written a 166-page thesis on Italian Renaissance sculptor Donatello, and promptly realized that not only where there few jobs for art historians, but that the few available paid poorly.

He did a 180.

He enrolled at the London School of Economics and earned an MA in economics, then landeda role at the legendary Salomon Brothers investment bank in New York, and then in London.

It was this experience, on the cutthroat trading floors of the 1980s, that led Lewis back to the arts.

As he learned the trading game and navigated the ruthless, opaque hierarchy of what was at that time one of the world’s most influential investment banks, Lewis read The Economist and the Wall Street Journal.

He began to write. But rather than copy the somewhat dry, professional style of the writers he admired…

Lewis chose to explore Wall Street economics and culture through people.

If you can attach the reader to a person,’ Lewis says, they’ll follow that person anywhere‘.

Liar’s Poker: Rising Through
the Wreckage on Wall Street


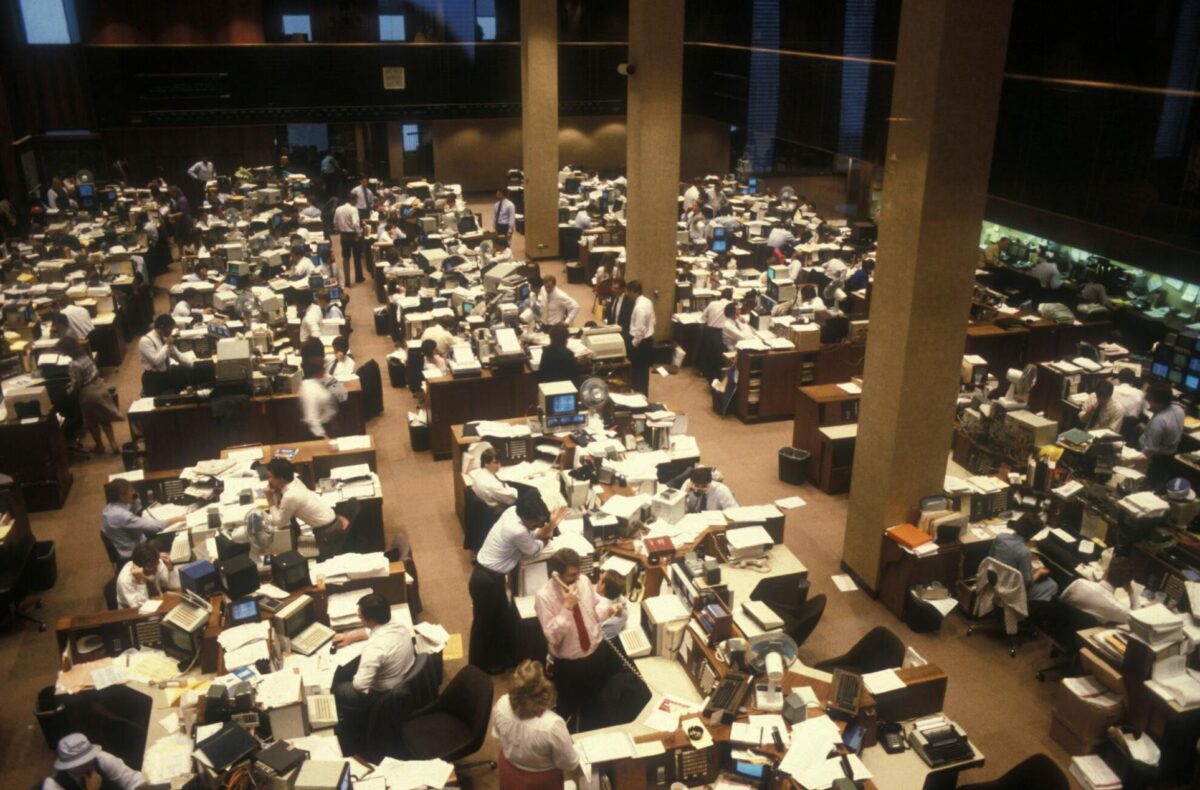
Salomon Brothers trading floor in 1986 (source)

Full disclosure here — I’ve not finished reading Liar’s Poker yet. I’m a few chapters in. But I can tell you now I will 100% finish it. It’s that good.

This book is to investment banking what Anthony Bourdain’s Kitchen Confidential is to the restaurant and fine dining industry; a gritty insight more concerned with truth than protecting people’s reputations.

Here’s a selection of revelations Lewis makes from his time rising at Salomon Brothers.

On the ‘zero sum game’ of trading:

If there was a single lesson I took away from Salomon Brothers, it is that rarely do all parties win. The nature of the game is zero sum. A dollar out of my customer’s pocket was a dollar in ours, and vice versa.’

On how traders see themselves as kings of the financial jungle:

Corporate finance, which services the corporations and governments that borrow money, and that are known as clients, is, by comparison, a refined and unworldly place. Because they don’t risk money, corporate financiers are considered wimps by traders.’

On the lack of correlation between skill and earnings:

That was somewhere near the middle of a modern gold rush. Never before have so many unskilled twenty-four-year-olds made so much money in so little time as we did this decade in New York and London.’

You get a sense, even from these few excerpts, of the hubris and arrogance to which Lewis was exposed (and, as he admits, participated in and profited from).

Salomon Brothers no longer exists.

CEO John Gutfreund left in 1991 facing a $100,000 fine from the SEC and being barred from holding a CEO role of a brokerage firm.

Why?


Ryan Gosling in the film adaptation of Lewis’ later Wall Street book, The Big Short. (source)

The bank became embroiled in a scandal involving illegal treasury bond auction manipulation.

Several of its traders had submitted false bids to the Treasury Department in order to gain an unfair advantage.

The scandal shattered the bank’s reputation.

Salomon Brothers was eventually acquired, then merged into Citicorp, and now no longer exists.

There was, believe it or not, a brief period post-Gutfreund in which Warren Buffett held the CEO position.

Michael Lewis called time on his bond trading career at the bank in 1988, and began writing about his experiences.

One wonders whether the man sitting next to him on the trans-Atlantic flight perhaps worked on Wall Street himself, or perhaps even had some connection to Gutfreund, who told Lewis later in life:

Your fucking book destroyed my career, and it made yours.’

Feedback: Appreciated

Over the past couple of weeks, I’ve received a stack of emails from readers letting me know how much they’re The Benchmark.

Thank you.

I try to write an investing email that I would enjoy reading.

So I’m stoked to hear you enjoy reading The Benchmark.

As I said to one Chief Investment Officer who wrote me last week; please feel free to send through any ideas or stories you’d like me to write about.

Quote of the week

A man who can tell a good story can make a good living as a broker.’

Michael Lewis, Liar’s Poker

That’s it for this week’s The Benchmark email.

Forward this to anyone you know who enjoys growing their investing knowledge.

If someone forwarded this to you, subscribe here.

Invest in knowledge,

Thom
Editor, The Benchmark

Unsubscribe · Preferences

All information contained in The Benchmark and on navexa.io is for education and informational purposes only. It is not intended as a substitute for professional financial or tax advice. The Benchmark and any contributors to The Benchmark are not financial professionals, and are not aware of your personal financial circumstances.
Categories
The Benchmark

Dead at 63: The original Wolf of Wall Street

July 15, 2024


The Original Wolf (and Great Bear) of Wall Street

Dear Reader,

In 1929, as the Great Crash destroyed investors and heralded the beginning of the notorious Great Depression, one man made $100 million.

Jesse Livermore, who’d grown up in poverty in Massachusetts, had been observing the market’s behaviour throughout the 1920s.

He noticed that stock prices were rising rapidly, driven by speculation and excessive leverage. He recognized that the market was in a bubble, and reasoned it was due for a correction.

So, Livermore began shorting stocks.


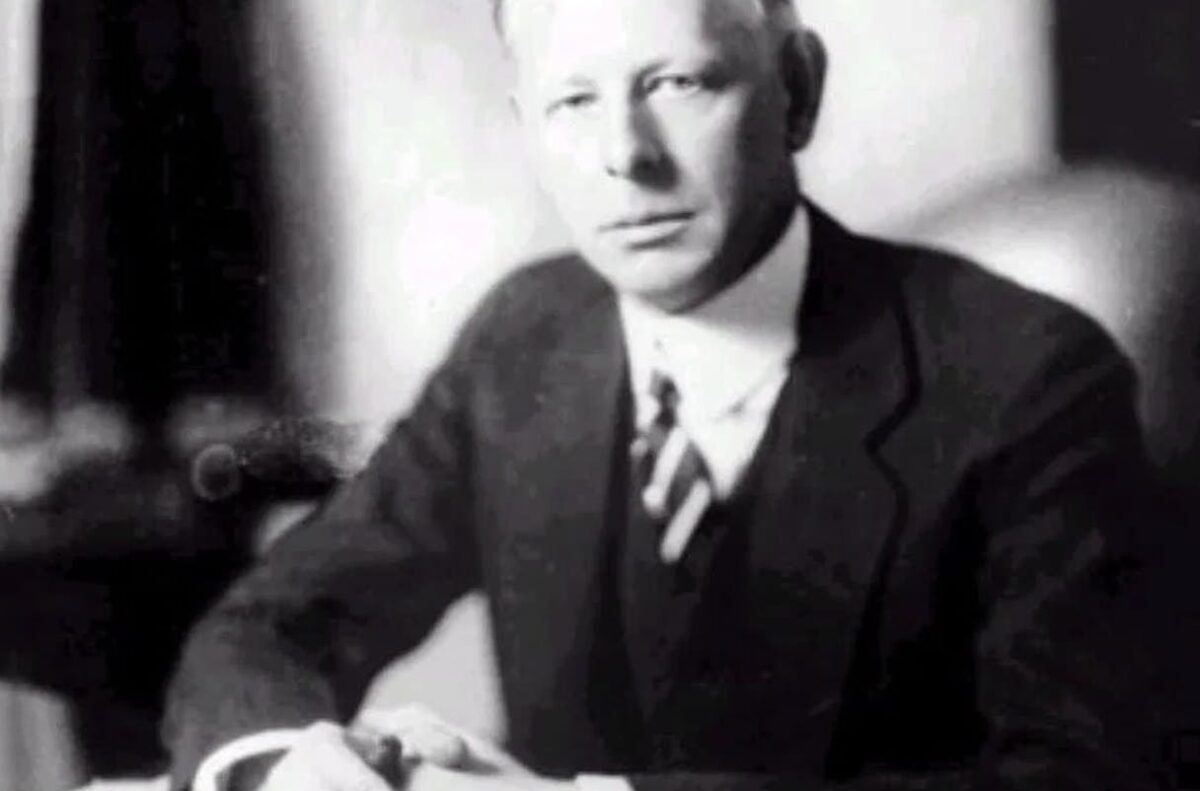
Jesse Livermore

In early 1929, he started building his short positions quietly to avoid drawing attention. By spreading his trades across multiple brokerage houses, he managed to keep his activities under the radar.

As the market showed signs of weakness in September and October 1929, he increased his short positions.

Then, on October 29, 1929, or ‘Black Tuesday’, the stock market crashed. The Dow Jones Industrial Average plummeted by 12% in a day, wiping out about $14 billion in value.

The market then collapsed lower and lower for three years, ultimately taking about a quarter of a century to reclaim its previous highs:


Source

But the picture was far from bleak for Livermore, whose profits were astronomical. He likely made around $100 million (equivalent to more $1.5 billion today) during the crash.

His foresight and execution made him one of the few individuals who thrived financially during one of the most devastating periods in stock market history.

Revered for the foresight, reviled for the profit

Livermore’s gargantuan win from the 1929 crash cemented his reputation as one of the greatest traders of all time. His ability to predict the market downturn and profit from it became legendary.

But it was also bad news, in that a series of newspaper articles declared him the ‘Great Bear of Wall Street’ and ‘The Wolf of Wall Street’, which gave the public someone to blame for the crash.

Livermore received death threats, and spent some of his profits on hiring an armed bodyguard.

But how had he come to be able to make such a forecast, and profit by betting against a market pretty much everybody else thought would never stop going up?

If you’re into fascinating investor and trader biographies, they don’t come much more rock ‘n’ roll than Jesse Livermore’s.

Volatility personified: A tale of windfall and woe


NYSE trading floor in 1929

Livermore’s journey from humble beginnings to financial titan was marked by dramatic success and equally spectacular failure.

At 14, he ran away from home to Boston, where he started working as a board boy in Paine Webber, a brokerage firm.

This involved posting stock prices on a chalkboard, and gave him an opportunity to observe market trends and price movements up close, in detail. Livermore soon placed his first trades and quickly accumulated a small fortune.

By his twenties, he had moved to New York City, the epicenter of the financial world. His aggressive trading style, characterized by leveraging significant amounts of capital, earned him nicknames like the ‘Boy Plunger’.

Livermore’s most notable successes came during times of market turmoil. He made a substantial profit during the Panic of 1907 and solidified his legendary status during the Great Crash in ’29.

Despite these triumphs, Livermore’s career was marred by numerous bankruptcies and personal tragedies. His speculative methods, while capable of generating enormous wealth, also exposed him to tremendous risks.

He declared bankruptcy three times, each instance a result of over-leveraging and miscalculation. Livermore’s personal life was equally volatile, with happy, harmonious periods punctuated by tragedy and turmoil.

Divorces. Armed robberies. One of his wives shot his son. A lawsuit from a Russian mistress.

Livermore was an all-or-nothing operator, both in the stock market and in his personal life. He had it all, and lost it all, several times over.

On November 28, 1940, just after 5:30pm, in the cloakroom of The Sherry-Netherland Hotel in New York City, Jesse Livermore shot himself dead.

‘To see if I could…’


Livermore’s story is one of volatility.

Predicting it, observing it, betting on it and profiting from it.

He was a trader through and through, and openly admitted he wasn’t in the business of investing for the long term.

While his trading style and lifestyle would be too much for most of us to handle, you can’t deny that some of the highs were truly remarkable.

After World War I, Livermore secretly cornered the cotton market. President Woodrow Wilson, prompted by a call from the United States Secretary of Agriculture, summoned the trader to the White House.

During this meeting, Livermore agreed to sell back the cotton at break-even, averting a potential surge in cotton prices.

When President Wilson inquired about his motives, Livermore candidly replied, ‘to see if I could, Mr. President‘.

Quote of the week

There is nothing new in Wall Street. There can’t be because speculation is as old as the hills. Whatever happens in the stock market today has happened before and will happen again.’

Jesse Livermore

That’s it for this week’s The Benchmark email.

Forward this to anyone you know who enjoys investing stories and market insights.

If someone forwarded this to you, subscribe here.

Invest in knowledge,

Thom
Editor, The Benchmark

Unsubscribe · Preferences

All information contained in The Benchmark and on navexa.io is for education and informational purposes only. It is not intended as a substitute for professional financial or tax advice. The Benchmark and any contributors to The Benchmark are not financial professionals, and are not aware of your personal financial circumstances.

Categories
The Benchmark

1.5% of every listed company on earth?

July 8, 2024


There will be wealth

Dear Reader,

Resources have long been a key factor in determining a nation’s wealth.

Timber, coal, precious metals, natural gas, rare earths, and, of course, oil.

On August 21, 1969, Ocean Viking found oil in Norway’s sector of the North Sea. By the end of that year, it was clear the Norwegians were sitting on massive oil and gas reserves.

About a decade later, the first Norwegian oil field, Ekofisk, was, was producing 427,442 barrels of crude oil a year.


The Ekofisk oil field in 2010

Today, Norway is one of the world’s leading exporters of both oil and natural gas. The country makes between US$50 billion and $100 billion a year from these resources.

But, this is just the start of Norway’s modern wealth saga.

Norway established the Statens pensjonsfond, or Government Pension Fund, in 1990. The fund contains two distinct entities: the Global fund (GPFG) and the Norway fund (GPFN).

The Global fund, known as the Oil Fund, is the world’s largest sovereign wealth fund at more than $1.6 trillion in assets. It invests the surplus revenues Norway generates from its resource exports.

Why: To provide a financial buffer against volatile oil prices and secure the nation’s wealth long after its oil reserves have been depleted.

How: Through robust ethical, socially responsible and sustainable investments in stocks, bonds and real estate all over the world.

As for what, exactly, the Oil Fund invests in?

A piece of (almost) everything


Norges Bank — the central bank of Norway

Norway is on a mission to convert its (finite) oil wealth into long-term, multi-generational wealth for its citizens.

To give you a sense of just how much invested wealth they’re managing, Norway could liquidate the Oil Fund and give each of its 5.5 million citizens almost $300,000 in cash.

From that relatively modest Oslo building in the photo above, the GPFG deploys its $1.6 trillion (and growing) portfolio across pretty much the whole world (with some exceptions, which I’ll explain shortly).

Here’s a breakdown of its main investment categories:

Stocks

Allocation: Around 70% of the fund.

Geographical spread: Investments are made globally across developed and emerging markets.

Sectors: The fund invests in a broad range of industries, including technology, finance, healthcare, consumer goods, and more.

Examples: Major holdings include shares in large multinational companies like Apple, Microsoft, Nestlé, and Alphabet.

Fixed Income

Allocation: Approximately 25% of the fund.

Types: Investments include government bonds, corporate bonds, and inflation-linked bonds.

Geographical spread: Fixed income investments are also globally diversified, with significant holdings in U.S. Treasuries, European government bonds, and bonds from other stable economies.

Real Estate

Allocation: Around 2-3% of the fund.

Types: Investments in commercial real estate, including office buildings, retail spaces, and logistics properties.

Geographical spread: Key markets include major cities in the United States, Europe, and Asia.

Examples: Properties in cities like New York, London, and Tokyo.

Renewable Energy Infrastructure

Allocation: A relatively new and growing segment, though still a small portion of the overall fund.

Types: Investments in renewable energy projects such as wind farms and solar power plants.

Geographical spread: Global investments with a focus on regions with strong renewable energy potential.

The GPFG’s allocation is all about maximizing returns while — and you won’t believe this — maintaining manageable risk levels.

According to Norges Bank (my emphasis added):

‘The fund has a small stake in about 9,000 companies worldwide, including the likes of Apple, Nestlé, Microsoft and Samsung. On average, the fund holds 1.5 percent of all of the world’s listed companies.’

With 2.33 percent of European stocks in its portfolio, the Oil Fund is the largest stock owner in Europe. It participates in thousands of shareholder meetings and proposals every year.

Building wealth by beating benchmarks

The chart below shows you how the Oil Fund’s value has grown over the past three decades.

$23 billion to $1.6 trillion in 26 years


The GPFG‘s growth since 1998

So that’s the value, but what about the performance?

Since its inception in 1996, the GPFG has averaged annual return of about 6%.

Given the fund’s conservative investment strategy aimed at long-term stability and growth, this is a solid, albeit not spectacular, return.

The fund’s returns can vary significantly from year to year due to market fluctuations.

For example, in 2021, the GPFG achieved a return of 14.5%, driven by strong equity markets. However, in years of economic downturn or market stress, returns can be negative, such as during the 2008 financial crisis.

Last year, the Oil Fund logged a mega 16.1% return and $213 billion in profit.


Source

Generally, the fund aims to outperform its benchmark indices. The returns are compared against a custom benchmark based on global equity and bond indices. Historically, the fund has often managed to exceed these benchmarks, adding value through active management and strategic asset allocation.

But it’s not just the fund’s size or returns that make it remarkable.

New: Follow The Benchmark‘s brand new 𝕏 account!

I post & reply over on X

The Oil Fund also seeks to build wealth for Norway by investing only in ethical, socially responsible and sustainable assets.

The fund’s ethical guidelines mean it cannot invest money in companies that directly or indirectly contribute to killing, torture, deprivation of freedom or other violations of human rights in conflict situations or wars.

Here’s a small sample of investments excluded by the Oil Fund, and the reasons for doing so:


Full list here

You won’t find companies that produce tobacco, manufacture nuclear arms, or contribute to severe environmental damage or humans rights abuses in the fund’s holding list.

So that’s a quick primer for you on the largest sovereign wealth fund on the planet.

The Norwegian Ministry of Finance forecast that a worst-case scenario for the fund value in 2030 was $455 billion.

Best case? $3.3 trillion.

Oh, and one more thing.

The Oil Fund is perhaps the most transparent such organization in the world — you can tune into In Good Company, their podcast, in which Norges Bank CEO Nicolai Tengen interviews CEOs of the companies the fund has invested in.

Quote of the week

The fund’s role is to ensure that our national wealth lasts for as long as possible. Its investments have an extremely long-term perspective, enabling it to cope with big swings in value in the short term. Our goal as manager of the fund on behalf of the Norwegian people is to generate the highest possible return with only moderate risk so that the fund grows and endures.’

Norges Bank Investment Management

That’s it for this week’s The Benchmark email.

Forward this to anyone you know who needs to read it.

And, if one of our awesome subscribers has forwarded it to you…

Subscribe here for weekly emails with ideas, stories and content about long-term, high-performance investing!

Invest in knowledge,

Thom
Editor, The Benchmark

Unsubscribe · Preferences

All information contained in The Benchmark and on navexa.io is for education and informational purposes only. It is not intended as a substitute for professional financial or tax advice. The Benchmark and any contributors to The Benchmark are not financial professionals, and are not aware of your personal financial circumstances.

Categories
The Benchmark

Stock market’s secret ’90s AI boom 📈

July 1, 2024


ChatGPT = tip of the iceberg

Dear Reader,

Artificial intelligence has exploded into the mainstream consciousness in the past couple of years.

AI is changing pretty much every aspect of the world we live in. How we produce and consume media, how we do business, receive healthcare, you name it — it’s changing faster than ever.

So it comes as no surprise that AI is changing the investing world, too.

At a basic, individual level, you can now feed a company’s financials into an AI tool and get it to read and analzye everything for you in seconds — like having your own Warren Buffett poring through numbers so you don’t have to.

But the stock market’s relationship with tech goes back way further than the current AI acceleration.

Dawn of the algos


Algorithmic — or ‘algo’ — trading began back in the early 1970s.

Financial institutions began experimenting with primitive automated trading systems that executed trades based on predetermined criteria, such as price movements or volume indicators, with limited computing power.

In the 1980s, stock exchanges went electronic, massively increasing the amount, and speed, of market data and execution capability. Trading algorithms evolved, too.

Broker Thomas Peterffy programmed a PC with a stock data feed to search for options relative to fair value — pioneering options trading in the process. Peterffy went on to found Interactive Brokers — one of the largest electronic trading platforms in the world.

The 1990s brought Direct Market Access (DMA) and electronic communication networks (ECNs). DMA enabled traders to interact directly with exchange order books, bypassing traditional brokerage channels and reducing execution times. ECNs provided electronic platforms for matching buy and sell orders, fostering competition and driving down transaction costs.

$1 trillion in 36 minutes

In 1998, the Securities and Exchange Commission relaxed regulations on alternative trading systems. This paved the way for a boom in computerized high-frequency trading.

In 2010, an algorithmic trading program went haywire, triggering a 36-minute ‘flash crash’ that wiped about a trillion dollars off the major U.S. markets before they quickly recovered.


The 2010 ‘flash crash’

In the early 2000s, algorithmic trading grew further, fuelled by advancements in computing technology and quantitative finance.

Hedge funds and proprietary trading firms led the charge, leveraging complex algorithms to exploit market inefficiencies and generate alpha.

The growing prevalence of algorithmic trading also raised concerns about market stability and fairness. Critics argued that HFT algorithms could exacerbate market volatility and contribute to flash crashes, prompting regulators to introduce stricter oversight and regulatory measures.

The algorithmic trading market is today valued at $14.42 billion USD.

That’s projected to explode about $10 billion higher to $23.74 billion in the next five years.

So while the AI boom has only captivated mainstream consumer attention as of late 2022, the investing world has been hard at work on using machines to interpret data for profit for more than half a century.

AI for investors, according to BlackRock


The current AI acceleration is making automation accessible to many more people, across many more areas of society. Trading algorithms powered by AI can enhance trading accuracy and efficiency, while also suggesting strategies based on unique goals and trading styles for improved performance.

But now it’s about more than just trading. ChatGPT’s explosion (which is really the large language model explosion) has drastically changed investment research, strategy and portfolio management.

BlackRock, the world’s largest asset manager (with $10 trillion FUM) is big into AI, and has been for a long time.

For decades, we’ve been applying natural language processing (“NLP”) techniques across a wide range of text sources including broker analyst reports, corporate earnings calls, regulatory filings, and online news articles. When analyzed at scale, each individual insight can be combined into an aggregate view that helps inform our return forecasts. The more effectively we’re able to extract and understand these insights, the more of an investment edge they may be able to provide.

(From BlackRock’s How AI is transforming investing.)

What this means is that BlackRock uses artificial intelligence to ‘listen’ to earnings calls, and predict how the market will react to them.

In other words, predicting the future to profit from it.

According to them, they have the most accurate model for doing so:


BlackRock’s earnings call AI destroying ChatGPT

The ChatGPT hype is the tip of the iceberg.

The rise of the machines in investing and trading began long ago.

But now it’s hitting full stride and everyone from the bedroom value investor to the biggest asset manager on the planet is harnessing it.

To summarize?

Well, let’s ask AI, shall we?

Here’s what ChatGPT told me about how AI changes the game for investors:

Beyond mere data analysis, AI excels in predictive analytics, leveraging historical data to forecast market trends with remarkable accuracy. This predictive prowess enables investors to discern opportunities and anticipate risks, optimizing investment strategies accordingly.

AI’s utility extends to portfolio management, where it orchestrates optimized investment portfolios, dynamically adjusting to market dynamics while balancing risk and return. This systematic approach ensures portfolios remain aligned with investors’ objectives amidst evolving market conditions.

AI represents a paradigm shift in investment methodologies, offering unparalleled analytical capabilities and strategic insights. As stewards of capital, let us embrace this technological frontier with vigilance and adaptability, leveraging AI to enhance investment outcomes responsibly.

Quote of the week

AI will be the most transformative technology of the 21st century. It will affect every industry and aspect of our lives.’

— Jensen Huang, CEO, NVIDIA

That’s it for this week’s The Benchmark email.

Forward this to anyone you know who needs to read it.

And, if one of our awesome subscribers has forwarded it to you…

Subscribe here for weekly emails with ideas, stories and content about long-term, high-performance investing!

Invest in knowledge,

Thom
Editor, The Benchmark

Unsubscribe · Preferences

All information contained in The Benchmark and on navexa.io is for education and informational purposes only. It is not intended as a substitute for professional financial or tax advice. The Benchmark and any contributors to The Benchmark are not financial professionals, and are not aware of your personal financial circumstances.
Categories
The Benchmark

History is against US dollar domination

June 24, 2024


One currency to rule them all…

Dear Reader,

The drachma, the ducat, the denarii.

Such words might befit characters or kingdoms in Game of Thrones or Lord of The Rings.

But fictional monikers they are not.

You’d be forgiven for not knowing what these things really are; past reserve currencies of the world.

As we’ve covered, humans are prone to short-term thinking — in both directions.

We don’t think far into the past or future.

Our sense of the financial world is very much prone to such short-term thinking.

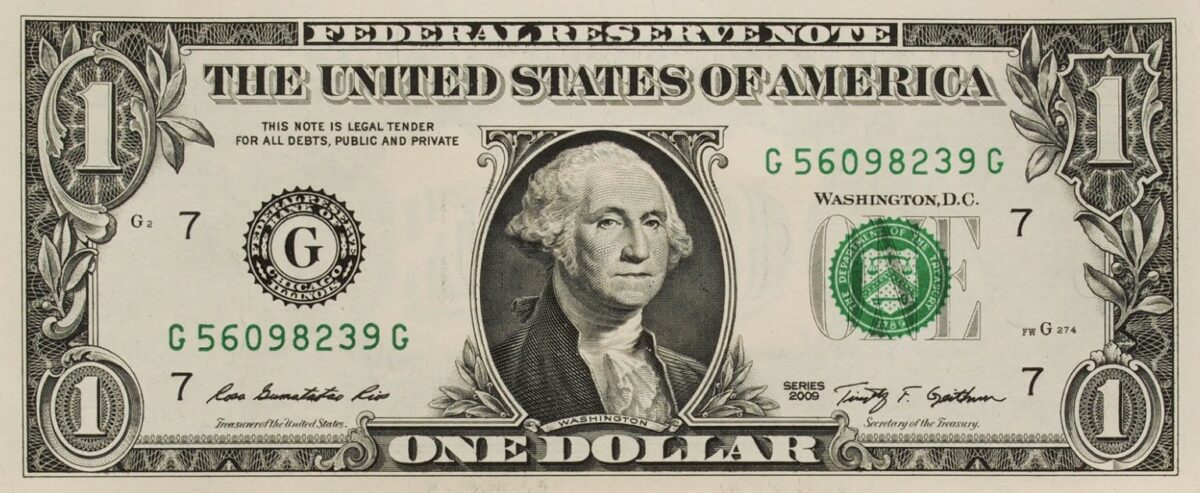
Most of us wouldn’t have a problem naming the world’s reserve currency — the US dollar.

But what about the previous reserve currency? And the one before that?

This edition of The Benchmark takes you back further than the recent past, revealing the three currencies that ran the world before the US dollar…

And speculating about what might replace the reserve currency we take for granted in the current economic status quo.

Reserve status: Safe, strong, stable


Let’s start with a reserve currency’s general definition:

A reserve currency is a foreign currency, held in large amounts by central banks and monetary authorities.

It can be used for international transactions and investments.

It’s often considered a ‘safe haven’.

Historically, reserve currencies have shared several key characteristics that secured their status, among them:

Strength and stability: A reserve currency typically originates from a nation with a robust and influential economy.

Power: Stable and reliable political institutions are crucial, as they ensure continuity and predictability in economic policies and governance.

Historically, the issuing country often possessed significant military strength, which helped protect its economic interests.

Trade: The nation behind a reserve currency usually has extensive and well-established trade networks.

This facilitates widespread use of the currency in international trade and finance.

Confidence: Institutions like central banks and stable legal frameworks help build trust in the currency’s stability and reliability.

Acceptance: The currency must be widely accepted and used in international transactions and held by governments and institutions as part of their foreign exchange reserves.

US dollar dominance: 1944-?


Right now, the US dollar fits these criteria.

The US is the largest economy on the planet in terms of nominal GDP.

Its political and military influence both have massive international influence.

Its trading networks are extensive.

Its central banks virtually determine global monetary policy.

And despite challengers rising to threaten its acceptance, generally speaking, the US dollar goes a long way in most places on earth.

Our current global reserve currency ascended to its dominant position at the tail end of the World War II with the Bretton Woods Agreement — which created a system in which the 44 signing nation states agreed to guarantee convertibility to the US dollar.

In other words, the allied nations prepared for a post-war world in which they’d do business in dollars.

Eighty years hence, the US dollar remains the global reserve currency.

But what about before that?

1800s to 1900s: British Pound Sterling (GBP)


The British Pound Sterling rose to prominence as the world’s primary reserve currency during the 19th and early 20th centuries.

This period coincided — no surprises — with the height of the British Empire, which spanned continents and facilitated extensive global trade.

The industrial revolution, which began in Britain, further solidified its economic dominance. London was the world’s financial hub, with the City of London the heart of finance and trade.

The Pound was directly linked to a specific amount of gold, which provided stability and confidence in the currency.

Two World Wars and their subsequent economic strain significantly weakened the British economy, setting up the Bretton Woods system outlined above.

1700s to 1800s: French Franc (FRF)


The French Franc was a prominent reserve currency during the 18th and early 19th centuries, particularly under Louis XIV and Naploleon. France’s significant influence in European politics, military power, and economic strength during this period underpinned the Franc’s status.

Like the Pound, the Franc drew much of its power from international trade and finance facilitated by France’s extensive colonial empire, which spanned Africa, the Americas, and Asia.

Under Louis XIV, France pursued policies of economic centralization and standardization, including issuing a stable currency, which helped bolster the Franc’s credibility.

Napoleon established the Banque de France in 1800. This further strengthened the country’s financial system and the Franc’s international standing.

The Napoleonic Code, which reformed legal systems across Europe, also promoted the use of the Franc in international dealings.

The French Revolution and the Napoleonic Wars caused economic instability and significant fluctuations in the value of the Franc, which managed to remain a key currency in Europe until the rise of the British Empire in the mid-19th century.

1600s to 1700s: Dutch Guilder (NLG)


The Dutch Guilder was a dominant reserve currency during the 17th and 18th centuries. This period was the Dutch Golden Age.

The Netherlands, particularly through the influence of the Dutch East India Company, emerged as a leading global trading and financial power.

The Bank of Amsterdam, established in 1609, was one of the first central banks and played a crucial role in stabilizing and promoting the use of the Guilder for international trade.

The Guilder’s prominence was closely tied to the Netherlands’ strategic maritime position and its control over critical trade routes. Dutch merchants and bankers established extensive networks that spanned from the Americas to Asia, where the Guilder grew to be widely accepted.

The Dutch’s innovative financial practices, including modern banking, stock exchanges, and insurance, further strengthened the Gilder as reserve currency, with Amsterdam the centre of the financial world.

What weakened it? You can probably guess:

The Dutch started fighting wars against the English and the French. The Dutch Golden Age reached its end, and the guilder lost its reserve status as the French, then the English, took their turns at the centre of the financial world.

As you can see…

No reserve currency has ever retained its status


What’s a common theme in the three previous reserve currency mini-histories above?

War is not good for maintaining stability and influence.

Nor is political upheaval.

While the past isn’t necessarily a guide to the future, it’s true that those who forget the past are, probably, doomed to repeat it.

Which begs the question: When the US dollar does lose its place at the top of the world financial pecking order, what’s going to take its place?

Here are some of the main contenders:

The Euro (EUR): The Eurozone collectively represents one of the largest economies in the world. The EU has extensive trade relationships, advanced financial markets and institutions.

Chinese Yuan (Renminbi, CNY): China is the world’s second-largest economy and the largest trading nation. It has been actively promoting the international use of the Yuan. Reserve banks around the world are now increasingly including it in their reserves.

Cryptocurrencies (e.g., Bitcoin): Cryptocurrencies operate on decentralized networks, offering an alternative to traditional fiat currencies. They’re increasingly becoming used for global transactions and stores of value, and represent a potential paradigm shift away from fiat as a reserve currency in the future.

For now, though, the US dollar remains dominant.

It has the established trust, liquidity, and influence backing it up despite significant macroeconomic and geopolitical factors threatening its position.

Only one thing is certain: No reserve currency in history has ever maintained its dominance indefinitely — they have all failed and been replaced.

Maybe this time its different?

Love to know your thoughts — reply to this email with your take/predictions!

Quote of the week

The greatest remaining power that the United States has is the reserve currency, which gives us — I mean, you print the world’s money… And then simultaneously, it is at risk because we’re printing a lot of money. We’re creating a lot of debt. And so if you look at the cycles, that becomes an issue.

Ray Dalio

That’s it for this week’s The Benchmark email.

Forward this to anyone you know who needs to read it.

And, if one of our awesome subscribers has forwarded it to you…

Subscribe here for weekly emails with ideas, stories and content about long-term, high-performance investing!

Invest in knowledge,

Thom
Editor, The Benchmark

Unsubscribe · Preferences

All information contained in The Benchmark and on navexa.io is for education and informational purposes only. It is not intended as a substitute for professional financial or tax advice. The Benchmark and any contributors to The Benchmark are not financial professionals, and are not aware of your personal financial circumstances.
Categories
The Benchmark

Insane stock picker’s 13-year rampage

June 17, 2024


The investor who outperformed
Buffett (for 13 years in a row)

Dear Reader,

Warren Buffett is the undisputed King of Investing in the modern age.

But he didn’t win his crown without facing his challengers.

Buffett’s now-legendary 19.8% annualized return was, for more than a decade, beaten fair and square by a lesser-known benchmark-beating legend.

Peter Lynch is the investor, mutual fund manager, author, and the man who took Fidelity Investment’s Magellan Fund on a 13-year rampage between 1977 and 1990 to beat the benchmark S&P 500 by more than 2X every year.

Coining the ‘ten bagger’


Peter Peter Benchmark Beater (source)

A ‘ten bagger’ is a 10X return on an investment.

It turns a $10,000 investment into $100,000.

Peter Lynch invented the phrase, because he needed something to describe what kept happening to the stocks he bought during his time running the Magellan fund.

All told, Lynch invested in more than 100 ten baggers including:

  • Fannie Mae
  • Ford
  • Phillip Morris International
  • Taco Bell
  • General Electric

He even bagged a 900%+ gain on, of all things, Dunkin’ Donuts.

Let me just repeat the fact:

Peter Lynch successfully invested in more than 100 stocks that went up 10X or more.

That’s not luck. That’s strategy.

And it’s this supreme strategic approach that drove the Magellan Fund up 29.2% for 13 years straight.

$1,000 in, $28,000 out


S&P 500 = obliterated (source)

In 1977, Peter Lynch assumed leadership of the then little-known Magellan Fund, which managed a modest $18 million in assets.

By the time Lynch stepped down as the fund manager in 1990, the fund had skyrocketed to more than $14 billion in assets, encompassing more than 1,000 individual stock positions.

This remarkable growth can be attributed to Lynch’s unique approach to investing. Operating with minimal restrictions — except for regulatory limits, such as not being able to hold more than 5% of his total portfolio assets in a single company at the time of purchase — Lynch was free to explore a wide array of investment opportunities.

Which meant he was pretty free to focus on individual stocks.

He initially targeted large US companies but progressively shifted his attention to smaller and international stocks, thereby diversifying the fund’s portfolio and enhancing its growth potential.

And grow it did.

Between 1977 and 1990, Lynch’s Magellan Fund boasted an average annual return of 29.2%, securing its place in history as the mutual fund with the best 20-year return as of 2003.

One thousand dollars invested the day Peter Lynch took over the fund, and sold the day he quit, would have turned into $28,000 — a 2,700% total return.

So, how exactly did he pick the 10 baggers that propelled the fund to such insane returns?

Lynch loved ‘story stocks’

Peter Lynch was renowned for his ‘story’ investing approach.

He anchored many of his stock picks in a well-founded expectation of the company’s growth prospects.

These expectations stemmed from the company’s ‘story’ — a clear narrative about what the company planned to do or what events were anticipated to drive its success.

Lynch emphasized that familiarity and a deep understanding of a company’s business and competitive environment significantly enhanced the likelihood of identifying a compelling ‘story’ that would materialize.

As he famously put it, he preferred investing in ‘pantyhose rather than communications satellites,’ and ‘motel chains rather than fiber optics’.

As mentioned, Lynch picked more than 100 ten baggers — many of them ‘story stocks’.

But, a story was far from the only criteria he used on Magellan’s 13-year, 29.2% p.a., run.

10 benchmark-beating commandments


Lynch’s One Up On Wall Street (source)

The following are just some of the tenets Peter Lynch used to turn $1,000 invested into his Magellan fund into $28,000 in little more than a decade.

  1. Invest in What You Know: Lynch liked investing in companies he understood. He did not, however, understand Apple, and thus did not invest — to his regret.
  2. Bottom-Up Stock Picking: Lynch focused on the fundamentals of individual companies rather than getting overly concerned with macroeconomic trends.
  3. Prediction Is Futile: Lynch believed that trying to predict macroeconomic trends or interest rates was a waste of time. Instead, he focused on analyzing individual companies.
  4. Take Time to Identify Exceptional Companies: Lynch advised patience and taking the time to thoroughly research and understand a company before investing.
  5. Avoid Long Shots: Lynch warned against investing in high-risk, speculative stocks with unproven business models or uncertain futures.
  6. Good Management is Paramount: Lynch looked for companies with competent, honest, and shareholder-friendly management teams who can execute their business strategies effectively.
  7. Be Flexible and Humble, Learn from Mistakes: Lynch emphasized the importance of being adaptable and willing to change your mind based on new information. He also advised learning from investment mistakes and not being afraid to sell a stock if the original investment thesis no longer held.
  8. Explain Why You Buy: Investors should have a clear rationale for buying a stock. This includes understanding the company’s business, growth prospects, valuation, and how it fits into their overall investment strategy.
  9. Tune Out The Noise: Lynch pointed out that there will always be negative news or reasons to be cautious. Successful investors learn to tune out the noise and focus on the fundamentals of their investments.
  10. Invest for the Long Term: Lynch was a strong advocate of long-term investing. He believed in holding stocks for extended periods to allow the underlying businesses to grow and compound value. This approach also helps to ride out market volatility and benefit from the long-term appreciation of well-chosen investments.

Quote of the week

Actually, Wall Street thinks just as the Greeks did. The early Greeks used to sit around for days and debate how many teeth a horse has. They thought they could figure it out by just sitting there, instead of checking the horse.

Peter Lynch, in One Up On Wall Street

That’s it for this week’s The Benchmark email.

Forward this to anyone you know who needs to read it.

And, if one of our awesome subscribers has forwarded it to you…

Subscribe here for weekly emails with ideas, stories and content about long-term, high-performance investing!

Invest in knowledge,

Thom
Editor, The Benchmark

Unsubscribe · Preferences

All information contained in The Benchmark and on navexa.io is for education and informational purposes only. It is not intended as a substitute for professional financial or tax advice. The Benchmark and any contributors to The Benchmark are not financial professionals, and are not aware of your personal financial circumstances.

Categories
The Benchmark

World’s wealthiest families laid bare!

June 10, 2024


Unpacked: 2024 UBS Global Family Office Report

Dear Reader,

The world’s wealthiest families have laid it all bare.

They’re worried about wars (both military and economic), real estate crashes, and, of course, what might happen to stocks over the coming few years.

What are they doing about it?

Lots.

They’re shifting where they invest, and changing how they choose to manage those investments.

How do we know this?

Because the UBS Global Family Office Report 2024 reveals several key trends and insights from 320 family offices worldwide.

A family office, if you didn’t already know, is a privately held company that handles wealth and investments for a wealthy family.

These private companies generally have one goal — to effectively grow and transfer wealth across generations.

320 family offices w/$2.6B average net worth

According to UBS:

The latest Global Family Office Report is the largest to date bringing together the insights of 320 single family offices across seven regions of the world. Representing families with an average net worth of USD 2.6 billion and covering over USD 600 billion of wealth, it confirms the report as the most authoritative analysis of this influential group of investors.’

I don’t know about you, but I don’t know that many billionaire families.

So, let’s take a look at what this most authoritative report reveals about what the world’s wealthiest family offices are doing with their money, and why.

What do they want right now?

The family offices surveryed have been rebalancing their portfolios, increasing allocations to developed market fixed income, and reducing real estate investments.

What’s driving this? Higher bond yields and the desire for greater portfolio stability​.

This means that family offices are seeking more stable and predictable returns in response to current economic conditions.

The higher bond yields offer attractive returns, leading to a preference for fixed income over the potentially more volatile real estate sector. This strategic move aims to mitigate risks and enhance portfolio resilience.

In brief: Moving away from risk and toward resilience.

What is keeping them up at night?

The family offices report a long list of concerns. Chief among them? War.

Geopolitical conflicts dominate these families’ worries, both over the next 12 months and the next five years.

Also weighing on their minds: Inflation, interest rates, a real estate correction, global recession, and climate change.

Check out the chart:

What the smart money’s worried about


Source

The takeaway here is that family offices are highly sensitive to global political and economic instability.

They anticipate continued geopolitical tension, environmental challenges, and financial volatility.

These concerns are shaping their investment and wealth management decisions.

In brief: Conflict #1 concern over both next one year, and five years.

Where are they investing?

According to the report, these families ‘appear to be strong believers in American exceptionalism, as US tech companies lead the generative AI revolution and occupy a growing share of global equity markets‘.

North America and Asia-Pacific (excluding Greater China) are the top regions for future investments.

UBS expects family offices to increase allocations to these areas due to attractive investment opportunities and growth prospects​.

This is an absolute return game


Source

This suggests that family offices see significant growth potential in North America and the Asia-Pacific region. The focus on these regions highlights confidence in their economic stability and innovative sectors, positioning these areas as favorable destinations for capital investment over the coming years.

Part of the reason for this, is the artificial intelligence trend.

In brief: US markets still the #1 investing destination.

What are they investing in, and how?

There is a renewed focus on active management as a strategy for diversification and enhanced returns.

Additionally, the report identifies generative AI as a significant investment theme (no surprises there, right?).

Many family offices plan to invest in this technology in the near future​.

AI investments most attractive


Source

As you can see, tech features strongly in the top nine investing themes among the family offices surveyed in the report.

Family offices are shifting towards more hands-on investment strategies to capitalize on market inefficiencies and emerging trends.

The interest in generative AI reflects a broader trend of embracing cutting-edge technologies that promise transformative impacts across various industries, signaling a forward-looking approach to asset management.

In brief: Disruptive tech the clear leading investing theme.

Where do they stand on sustainability?

Sustainability is becoming increasingly important for family offices.

They’re integrating ESG considerations into their investment strategies and businesses.

Healthcare and climate change are top sustainability themes, reflecting a broader commitment to positive environmental and social impacts​.

But, to be clear: Such issues are essentially matters of risk and reward to these family offices.

Climate change: Risk & reward


Source

The report finds that climate change ‘is an increasingly important topic affecting not just family offices’ investment portfolios, but also the long-term outlook of operating businesses. This is consistent with the finding that almost half (49%) of family offices view climate change as a top risk over the next five years‘.

In brief: Climate change high among risk and opportunity considerations.

So there you have it; the five major insights from the 2024 UBS Global Family Office Report.

Quote of the week

The only question with wealth is, what do you do with it?

— John D. Rockefeller

That’s it for this week’s The Benchmark email.

Forward this to anyone you know who needs to read it.

And, if one of our awesome subscribers has forwarded it to you…

Subscribe here for weekly emails with ideas, stories and content about long-term, high-performance investing!

Invest in knowledge,

Thom
Editor, The Benchmark

Unsubscribe · Preferences

All information contained in The Benchmark and on navexa.io is for education and informational purposes only. It is not intended as a substitute for professional financial or tax advice. The Benchmark and any contributors to The Benchmark are not financial professionals, and are not aware of your personal financial circumstances.

Categories
The Benchmark

$2.62T: France, Nvidia, Italy (in that order)

June 3, 2024


The heavy implications of Nvidia’s
AI-fuelled market domination

Dear Reader,

Every year, ARK Invest publishes its Big Ideas research report.

You won’t be surprised to know what leads 2024’s edition.

Perhaps wary of AI fatigue, they characterize their main big idea as ‘Technological Convergence‘, explaining that:

‘Catalyzed by breakthroughs in artificial intelligence, the global equity market value associated with disruptive innovation could increase from 16% of the total to more than 60% by 2030. As a result, the annualized equity return associated with disruptive innovation could exceed 40% during the next seven years, increasing its market capitalization from ~$19 trillion today to roughly $220 trillion by 2030.’

Disruptively innovative stocks — ARK’s specialty — could explode in value by more than 1,000%.

In other words, the AI revolution might still be in its infancy.

A thousand percent boom, after these past two years? Come on.

That prediction, of course, presumes the AI story continues to go from strength to strength.

Which means…

This time has to be different?

If you hadn’t heard, Nvidia is now the eighth biggest country in the world.

The chipmaker’s market capitalization at the time of writing is $2.62 trillion.

That’s more than every country bar France, the U.K., India, Japan, Germany, China and the U.S.A.

In other words, the AI powered ‘disruptive innovation’ ARK refers to has catapulted a single listed company among the top 10 wealthiest nations.

Last month, Nvidia’s share price made another new all-time high on the back of its latest blockbuster earnings announcement.

Ever since Open AI’s ChatGPT launch vaulted the promise of this technology into the mainstream consciousness, Nvidia, and as you can see in the chart below, the broader semiconductor market, has been on a relentless tear higher.

‘Catalyzed by breakthroughs…’

NVDA stock price and semiconductors indexc
Source

But that brings us to the topic — or perhaps its more of a question — of this week’s email.

Is it really possible that the AI story has only just begun?

That Nvidia and other ‘disruptive innovation’ companies can continue to break earnings and valuation records for quarters and years to come?

Or is this simply the latest version of the stock market and economy’s favourite cynical quip; This time, it’s different.

Take a look at this:

Stock market concentration
Source

This shows you 100 years of stock market concentration — the extent to which the market’s biggest companies make up the its total valuation.

The Kobeissi Letter explains the chart:

According to Goldman Sachs, the market cap of the largest stock is now 750 TIMES the market cap of a 75th percentile stock.

To put this in perspective, even at the peak of the 2000 Dot-com bubble the metric only hit 550x.

We officially have a higher stock concentration than the peak of the Great Depression in 1932. The top 10% of stocks in the US now reflect ~75% of the entire market.

Big tech IS the stock market
.

You see the implication. The chart shows that high market concentration roughly lines up with bubbles, crashes and/or geopolitical disturbance.

But if you listen to some of the market’s most respected commentators and analysts, this is not a problem.

ARK’s Big Ideas report makes clear that they think AI will only compound Big Tech’s power to expand valuations from here.

Citi sees Nvidia’s record-breaking performance continuing:

AI bubble headline

Goldman Sachs takes it a step further:

Goldman market prediction

They claim:

While investors usually think of elevated concentration as a sign of downside risk, during the 12 months after past episodes of peak concentration the S&P 500 rallied more often than it declined.’

History never/sometimes/always repeats

This email is not about swinging your opinion or influencing your investment decisions.

We write it merely to give you ideas you might not otherwise discover or consider, because we believe — like Benjamin Franklin — that knowledge pays the best interest.

It’s with this in mind that we close this week’s edition with some knowledge that many living and investing today have perhaps forgotten.

Astounded, distracted and swept up in the novelty, promise and seemingly limitless future that AI represents, we call all-too-easily allow ourselves to think ‘this time it really is different‘.

In September 1929, what’s now known as The Great Crash began on Wall Street. The broader economic crash that followed, of course, was The Great Depression.

Here’s a selection of newspaper headlines from 1929 — before and during The Great Crash:

Wave of Buying Sweeps Over Market as Stocks Swing Upward
Radio Flashes High; General Motors and Steels Soar

The World, March 15, 1929

Stocks Soar As Bank Aid Ends Fear of Money Panic

New York Herald Tribune, March 28, 1929

Banker Says Boom Will Run Into 1930

The World, March 30, 1929

Very Prosperous Year Is Forecast

The World, December 15, 1929

More headlines and articles here.

That’s it for this week’s The Benchmark email.

Forward this to anyone you know who needs to read it.

And, if one of our awesome subscribers has forwarded it to you…

Subscribe here for weekly emails with ideas, stories and content about long-term, high-performance investing!

Invest in knowledge,

Thom
Editor, The Benchmark

Unsubscribe · Preferences

All information contained in The Benchmark and on navexa.io is for education and informational purposes only. It is not intended as a substitute for professional financial or tax advice. The Benchmark and any contributors to The Benchmark are not financial professionals, and are not aware of your personal financial circumstances.

Categories
The Benchmark

Wall Street’s ‘fear gauge’ goes haywire 🌡️

May 27, 2024


The volatility of volatility

Dear Reader,

The CBOE Volatility Index is one of the most interesting market charts you’ll see.

Because it’s an indicator designed with a specific, ambitious goal:

To predict the near-term future of the stock market.

The Volatility Index, or VIX, ‘provides a measure of market volatility on which expectations of further stock market volatility in the near future might be based. The current VIX index value quotes the expected annualized change in the S&P 500 index over the following 30 days, as computed from options-based theory and current options-market data‘.

In other words, the VIX tracks options to determine the stock market’s chances of being volatile (or not) over the coming month.

Here’s an historical example:

The VIX over the past five years


Chart source

For reference, values above 20 are considered ‘high’, below 12 considered ‘low’, and in between considered ‘normal’.

The past five years, as you can see, have been highly volatile, no more so than when the pandemic hit in early 2020 and stocks took a dive.

The S&P 500 over the past five years


Chart source

You don’t have to look too close to see the relationship between these two charts.

Generally speaking, when volatility is up, stocks are down.

Simple, right?

Not quite.

This Practitioner’s Guide To Reading VIX explains how the relationship between the index and the options market it uses to produce its volatility reading muddies the water:

‘One common misconception is that VIX levels correspond directly to the volatility observed 30 days later — assuming that a VIX level of 25 means an anticipated volatility of 25%, for instance.

‘Instead, because there has typically been an excess of demand from market participants seeking the insurance-like characteristics that options can provide, there has been a discernable “premium” in VIX — otherwise said, VIX today more often than not overstates the level of actual volatility experienced in the next 30 days‘.

The paper finds that the VIX tends to predict S&P 500 volatility at a 4-5% premium.


VIX’s 2024 ‘red streak’

Volatility is in focus right now.

In fact, the VIX just broke a nine-year-old record:


Low VIX = higher stock prices, right?

Again, not quite.

Even a casual look at the economy, markets and world events tells you we’re far from stable territory for stocks right now.

There’s multiple, compounding sources of uncertainty: Wars between nations and on inflation, stocks teetering near all-time highs, living costs pressuring investors’ buying power and in many cases suppressing appetite for risk.

So why has the VIX been plunging?

According to The Bank for International Settlements in Switzerland, the low VIX of late is likely the result of investors piling into yield-enhanced exchange traded funds.

What does that mean?

It means a new breed of actively-managed ETFs are using short-term options trading to deliver investors ‘enhanced’ income.

Which means that their appetite for longer-term options has waned.

Which the VIX reads as a decreased chance of market volatility over the coming 30 days.

Moral of the story here? Don’t always take VIX chart at face value. Understand what’s behind the trend lines and apparent correlations on the screen.

And understand that even a market indicator designed to predict volatility, can be volatile in its prediction of the, er, volatility.

Quote of the week

My interest is in the future… I am going to spend the rest of my life there.’

— C.F. Kettering

That’s it for this week’s The Benchmark email.

Forward this to anyone you know who needs to read it.

And, if one of our awesome subscribers has forwarded it to you…

Subscribe here for weekly emails with ideas, stories and content about long-term, high-performance investing!

Invest in knowledge,

Thom
Editor, The Benchmark

Unsubscribe · Preferences

All information contained in The Benchmark and on navexa.io is for education and informational purposes only. It is not intended as a substitute for professional financial or tax advice. The Benchmark and any contributors to The Benchmark are not financial professionals, and are not aware of your personal financial circumstances.

Categories
The Benchmark

Ignoring crypto: More difficult than ever

May 21, 2024


Crypto’s quiet global domination

Dear Reader,

Crypto has long since escaped a quiet corner of the internet, visited only by drug dealers, money launderers and unscrupulous speculators.

Between the original decentralized currency’s arrival in 2009 and today, Bitcoin and the constellation of other blockchains and tokens it has spawned has spread further and deeper into the world than many would have expected.

Today, the crypto industry (if you want to call it that — an interesting debate in itself) and the ‘tradfi’ or ‘legacy’ systems of finance, business and government are more interconnected than they’ve ever been.

For investors — whether pro or anti-crypto — that means many things.

Like, for instance, that it’s more plausible than ever before that one might own, or at least have exposure to, crypto without realizing it.

This edition of The Benchmark reveals the extent to which crypto, for good or ill, is now ensconced in pretty much every branch of the economy.

The stock market’s ‘stealth’ crypto stash

If you own stocks — particularly U.S.-listed tech stocks — there’s a fair chance you’re exposed, albeit indirectly, to crypto.

According to Bitcoin Treasuries data, about 12% of all Bitcoin in circulation belongs to publicly traded companies (and exchange traded funds), private firms, and nation states.

Some of the NASDAQ’s giant companies hold gargantuan Bitcoin stashes on their balance sheets:

  • MicroStrategy Inc (NASDAQ:MSTR): 205,000 BTC.
  • Marathon Digital Holdings Inc (NASDAQ:MARA): 16,930 BTC.
  • Tesla Inc (NASDAQ:TSLA): 9,720 BTC.
  • Hut 8 Corp (NASDAQ:HUT): 9,110 BTC.
  • Coinbase Global Inc (NASDAQ:COIN): 9,000 BTC.

A decade ago, the idea that some of the biggest companies in the world would include Bitcoin miners (Hut 8), crypto exchanges (Coinbase), a software and consulting firm that’s transitioning into ‘the world’s first Bitcoin development company‘ (MicroStrategy), and electric car markers whose CEOs can move crypto markets with a single social media post (see Elon Musk’s Dogecoin proclamations), would have seemed unlikely — maybe even unhinged.

Today, this is the new status quo.

Of course, it’s not just individual companies becoming increasingly involved with crypto.

ETFs that invest in the NASDAQ, or U.S. technology, for example, hold shares in these companies. And these companies hold crypto.

So, say a self-proclaimed ‘crypto sceptic’ owns some of these stocks, or a fund with these stocks in it, they’re indirectly investing in an asset they perhaps don’t have conviction in.

These holdings aren’t really ‘stealth’, of course. Statements and filings reveal exactly which companies and funds hold exactly how much crypto. Hence the phrase, do your own research.

Institutional money floodgates open

The crypto/tradfi collision has only accelerated with the U.S. Securities and Exchange Commission’s (SEC) approval for Bitcoin ETFs in January 2024.

In just a few months, these funds have stacked up about 4% of all of the Bitcoin in the world.


Among them, you have massive investment firms like BlackRock, Fidelity, ARK and VanEck.

These firms are gargantuan players in the institutional investing world, capable of influencing vast sums of capital (BlackRock alone is the world’s largest asset manager, with about $10 trillion in funds under management).

In Q1, alone, net $12B flowed into these newly available funds, allowing institutional investors exposure to Bitcoin without having to buy directly.

The Bitcoin ETFs were a long time coming. But it’s not just the money flowing into them that’s bringing the crypto and traditional finance worlds closer together — it’s the precedent they set for further possible fund launches.

Many in the crypto industry are arguing — and lobbying — for Ethereum ETFs next. Some expect these could become a reality within the next 12 months.

Added to the fact you have institutional money (legally) flooding into Bitcoin now, and multiple listed companies holding significant sums and trading on major exchanges, it’s worth noting that governments, too, now hold serious crypto stashes.

The U.S. Government, having started seizing crypto in the course of prosecuting cybercriminals and illegal ‘dark’ markets, currently has about 200,000 Bitcoin tucked away — roughly the same stash as MicroStrategy.

As of 2021, El Salvador has used Bitcoin as legal tender. While not a major player in the world economy, this is of course a significant development in crypto going mainstream.

Which brings us to a central crypto question — one which becomes more and more difficult to answer the more intertwined crypto and fiat currencies become.

The end of the ‘inflation hedge’ story?

A central tenet of cryptocurrency’s promise is the inflation hedge narrative.

With a fixed supply of 21 million, Bitcoin maximalists tout the original crypto as an antidote to rampant inflation — created courtesy of rampant central bank money printing.

This scarcity narrative underpins the argument that Bitcoin could serve as a safeguard against inflation’s progressive erosion of your buying power.

But, with the crypto and traditional markets increasingly colliding and integrating, thanks to the reasons outlined above, this narrative is under threat.


As more crypto holdings flow into the companies trading on the stock market, and more institutional money flows into crypto courtesy of the newly-launched (with more possibly to come) ETFs, crypto and stocks start might behaving more similarly — which presents problems for those trying to hedge against dollars with crypto.

According to Investopedia:

‘Bitcoin has come a long way from its meagre beginnings as a payment method. Regulatory and classification debates between regulators, fans, and investors continue — but the cryptocurrency keeps demonstrating it is an investment asset, a currency, and a novelty all at the same time.

‘Its price loosely correlates to stock market prices, likely because traders and investors treat it the same way they would any other asset — as a way to store value, protect capital, generate income from small trades, speculate on price actions, and more.

‘The longer it survives in the market, the more investors will use it in their strategies.’

Know what you own (and what they own)

While it’s convenient to think of the stock market and cryptocurrency world as two separate things, the reality is that they’re becoming more intertwined.

One of Peter Lynch’s most memorable quotes is: ‘Know what you own and why you own it‘.

Given the evolution of the crypto/tradfi relationship, investors might want to dig even deeper, to understand what the stocks they invest in hold on their own balance sheets.

And, of course, why.

That’s it for this week’s The Benchmark email.

Forward this to anyone you know who needs to read it.

And, if one of our awesome subscribers has forwarded it to you…

Subscribe here for weekly emails with ideas, stories and content about long-term, high-performance investing!

Invest in knowledge,

Thom
Editor, The Benchmark

Unsubscribe · Preferences

P.S. To make sure you don’t miss our weekly emails, be sure to drag this email into your main inbox, and save The Benchmark languishing in your spam folder!

All information contained in The Benchmark and on navexa.io is for education and informational purposes only. It is not intended as a substitute for professional financial or tax advice. The Benchmark and any contributors to The Benchmark are not financial professionals, and are not aware of your personal financial circumstances.