Categories
Financial Literacy Investing

How to Calculate Dividend Yield

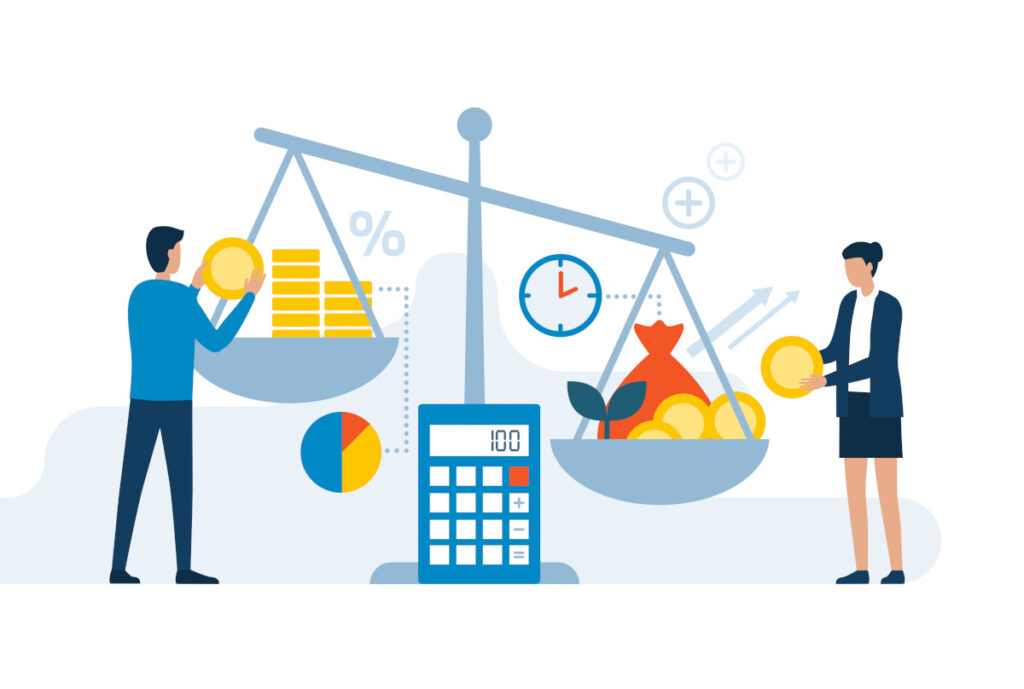
Dividend yield is what drives income investors to buy shares. It’s what companies pay their shareholders as both reward and incentive. We explain dividend yield and how to easily calculate it.

Dividend-paying stocks form part of many portfolios for a good reason; they pay investors to hold shares. Owning dividend stocks means investors need to be able to easily determine their dividend yield — and the impact this income has on their broader portfolio performance. 

Dividend yields are important for investors. By analyzing dividend yields, they can gain insight into how profitable and generous to shareholders a company may be. Being able to accurately calculate dividend yields can help investors predict how much a particular investment might pay annually. 

Receiving dividend yield from companies can help portfolios grow and balance the risks of a volatile share market.

However, calculating dividend yield might seem tricky. Luckily, we’re here to help you figure out how to calculate dividend yield. Keep reading to learn more about the value of dividends, how share price affects the yields, and what to look out for.

Dividend yield is simple to calculate, yet quite a complex metric when you dive into the details.

What Are Dividends?

Dividends are defined as the distribution of a company’s earnings to its shareholders. Once they invest in a company that pays out dividends, investors can earn money for holding that stock.

The board of directors usually decides whether the company pays dividends or not. Dividends can be paid in cash, or in additional shares.

What About Dividend Yields?

Yield is defined as the amount of money an investment generates over the period of time while an investor holds it. Yield is usually expressed as a percentage based on:

  • The invested amount
  • The current market value of the security
  • The face value of the security

Yields might be classified as known or anticipated, depending on the valuation of the security.

How and Why Do Dividends Generate Yield?

When a company decides to pay out dividends, it’s rewarding its investors for buying the company’s shares. By paying a dividend, it creats a yield for investors in the form of cash or additional shares. The company may also incentivize investors to keep holding the stock. 

Dividends might also make the company attractive to other investors. When new investors buy into the stock, the stock price could rise.

Dividend income contributes to overall investment performance.

Dividend Yield Stocks to Consider

Some common dividend yield stocks traditionally include companies in the following industries:

  • Electricity, water, natural gas supply
  • Consumer staples
  • Telecommunications
  • Real estate

A well-established business may be more likely to pay dividends than a smaller company. Larger companies tend to have more income, and be more financially stable, so they can pay part of their income to investors.

Still, companies may decide to stop paying dividends in the future. There are a variety of reasons why dividends may decrease or stop altogether.

Are There Different Types of Dividends?

There are many types of dividends. For example:

  • Cash dividend
  • Bonus share
  • Property dividend
  • Scrip dividend
  • Liquidating dividend

A cash dividend is paid in cash per share terms. It’s the most common type of dividend paid to investors.

Bonus shares are additional shares awarded to investors.

A property dividend is a payment in the form of an asset.

A scrip dividend is a promise that an investor will be paid later.

Finally, liquidating dividends are paid when the company shuts down, and represent the return of the original investment to the shareholders.

Dividends can come in many different forms.

Other Dividend Types

There are other dividend forms you might see when exploring how to generate dividend yield. For example:

  • Ordinary dividend
  • Qualified dividend

The main difference between ordinary and qualified dividend is the tax investors have to pay. Ordinary dividends are generally taxable as income. Qualified dividends may be taxed at lower capital gains rates.

Different Types of Dividend Yield

 A high dividend yield isn’t always the best single reason for investing, especially long-term. When companies pay high dividend yields, it can sometimes be unsustainable.

A good dividend yield is generally considered to be between 2% and 4%. This range is considered safe and strong. On the other hand, a dividend yield above 4% may appear like an attractive opportunity — but it may carry more risk.

Low dividend yield may be a sign of poor company health. Generally, income investors want to avoid low dividend yield stocks.

They should, however, consider other stock attributes besides the dividend yield alone. For example:

  • Stock price
  • Earnings per share
  • Price to earnings ratio
  • Frequency of dividend yield

How Often Is Dividend Yield Paid to Investors?

Dividends are usually paid out quarterly or annually. Shareholders know ahead of time exactly when to expect their payment. Some dividend payouts can be paid monthly, but those tend to be rare.

Advantages of Dividend Yield

There are several advantages of dividend yield for shareholders, including higher ROI (than simply profiting through capital appreciation alone).

High Return on Investment

Dividends can grow steadily over time — larger companies, especially, may increase their dividend payout annually. For example, some companies have increased their dividend payout for 25 years. This generates a higher compound annual growth rate, which benefits long-term shareholders.

Of course, stocks’ values rise and fall. One stock our founder held, for example, went nowhere for many years. This is where dividend yield can be so vital to investment performance. In his case, he nearly earned back in dividend yield what he bought his shares for, despite the lack of capital appreciation. 

High dividend yields can prove attractive for those seeking income as a priority.

Dividend Yield Is Useful for Equity Evaluation

Dividend yield can be a good signal of how stable a business is.  Investors may see high dividend yield as a sign of strong earnings.

Disadvantages of Dividend Yield

One of the main disadvantages of annual dividends for individuals is that they are observed as taxable earnings.

For companies, the pressure to pay or maintain a high dividend yield may put pressure on the business’s finances, or even inhibit reinvestment and growth.

Does a Stock Price Affect Dividend Yields?

There’s a direct correlation between dividend yield and stock price. Dividends can change as a company’s stock price changes. Plus, companies can change the size of the dividend yield, regardless of stock price.

A company that’s committed to paying dividends will generally be expected to increase the payout if its stock price rises. This both benefits the investors and can make the company more appealing to potential investors.

How to Calculate Dividend Yield

Dividend yield = annual dividends divided by current share price.

Calculating dividend yield is not that difficult. All you need to do is use the dividend yield formula. Divide the annual dividend by the current share price and you’ll get the dividend yield.

Keep in mind that dividend yield is not calculated by using quarterly, semi-annual, or monthly payments.

If you get stuck, find the company’s annual report which lists the annual dividend per share.

Calculating Dividend Yield From Quarterly/Monthly Dividends

If you find a company that pays dividends quarterly, you’ll have to convert the quarterly payments into annual payments to calculate the dividend yield. Meaning, you’ll have to multiply the most recent dividend by four to get the annual dividend.

If your dividend yield is inconsistent, you’ll have to add the last four quarterly dividend yields to get the annual dividend yield. Then you can use the yearly dividend yield formula.

The same goes for calculating monthly dividends — you’ll have to find the annual dividend per share to be able to calculate your dividend yield.

Of course, you don’t need to worry about calculating your dividend yield manually. When you use Navexa to track your portfolio, the platform automatically records your dividend payments and calculates their impact on your portfolio performance.

The Importance of Dividend Payout Ratio

Besides the annual dividend payment, you’ll also want to take a look at the dividend payout ratio. It’s defined as the total amount of dividends that’s paid to shareholders, relative to the net income of the company.

Payout ratio = dividends paid/net income.

You can also calculate it based on the retention ratio, which is equal to earnings per share divided by dividends per share.

This number tells you more about the company’s maturity and whether it can continue to pay out dividends. For example, a company might reinvest all its earnings, which results in a 0% payout ratio.

On the other hand, the payout ratio would be 100% for organizations that pay all of their income as dividends each year.

Potential Dangers of High Dividend Yield

Here are some things to consider about high dividend yields.

A yield trap is a stock offering a high yield despite problems with the underlying business.

The Yield Trap

Just because a stock’s dividend yield is high, that doesn’t guarantee the business is stable or growing. A yield trap, or dividend trap, is when investors fail to do their due diligence and invest purely for an attractive dividend yield. 

In an extreme scenario, an investor might buy shares of a stock based on its attractive dividend yield, only to find the value of their investment plummeting, negating any gain they might have hoped to realize from the dividend income. 

This is why it’s always important to look at both long-term performance for any potential investment, and to research the company’s underlying financials, rather than just skim headline numbers like dividend yield. 

Track Your Dividend Yield Automatically

Understanding how dividends work, and how they’re tied to share price is just a small piece of the investing puzzle. By understanding dividends, you’ll understand part of what to look for when you dig deeper into a company’s financials.

It’s generally best to analyze the whole company, the current market conditions, the stock’s value and long-term performance, and many other factors. Plus, in some cases, you can earn dividends you can reinvest for greater compounding returns over the long term.

The Navexa portfolio tracker
The Navexa portfolio tracker — free to try for 14 days

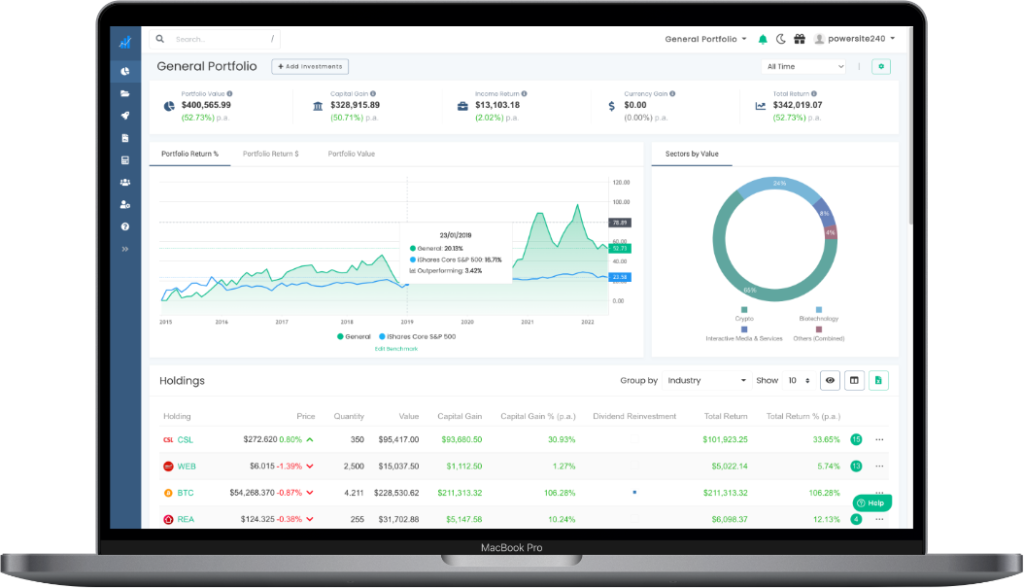
The Navexa portfolio tracker tracks every trade and transaction for your portfolio. It automatically records and calculates an investments dividend or staking income, and shows the total yield at both the individual holding and portfolio level.

It’s simple and free to start using. Once you join Navexa, you can add your portfolio in minutes and begin tracking your performance.

Categories
Financial Literacy Investing

11 Key Stock Market Sectors For Investors

Different market sectors offer unique opportunities and risk for investors, as well as ways to diversify a portfolio. These are the 11 key market sectors, and the pros and cons of each.

The US stock market is packed with different types of companies, focused on a massive range of products and services. This market is broken down into 11 sectors. This creates a lot of different options for investors in terms of which sectors and industries they want to get exposure to by buying shares.

Each sector has its own advantages and disadvantages. We’ll introduce each and then examine the pros and cons. 

Why Invest in Different Sectors?

Investing in different sectors allows for portfolio diversification and can be a key element of wealth management. A diversified portfolio, with a variety of stocks, dividends, and ETFs, offers exposure to different parts of the market. This, in turn, exposes the portfolio to both the potential risks and returns of each sector. The key idea of diversification is that the risks associated with one sector are balanced by the returns of the other.

If you own or plan to own a diversified portfolio, Navexa can help you track it. Our platform helps you map your financial goals and automates tax reporting. You can start using it today for free, and upload your holdings in minutes.

The US stock market is broken into 11 key sectors.

What Is the GICS System and Why Is It Important?

The Global Industry Classification Standard (GICS) divides the investment market into 11 sectors further comprising24 industry groups, 69 industries, and 158 sub-industries. This is a common system that investors use to learn how companies are classified, and what ETFs and mutual funds consist of.

The GICS was created in 1999 by MSCI and Standard & Poor’s. This classification system includes the following groups:

  • Sectors
  • Industry groups
  • Industries
  • Sub-industries

It’s occasionally revised, following the growth and developments of certain industries. For example, the latest addition was the real estate sector. This sector was included in 2016, due to the increasing growth and importance of real estate and equity REITs. 

This change had a powerful effect on the real estate sector. For example, it drove more money to real estate companies. Additionally, large fund companies had to purchase more real estate stocks to offer them in index funds. Adding the real estate sector to the GICS opened doors for other changes and introduced investors to new options.

However, the GICS is not the only method of classifying industries and sectors. The Industry Classification Benchmark (ICB) is one alternative. The ICB schema was developed in 2005 by Dow Jones and FTSE. It divides the market into 11 industries and 20 supersectors, which are further divided into sectors/sub-sectors. The ICB standard is used in many international markets, including NASDAQ and NYSE.

Today, we’ll focus on the Global Industry Classification Standard and its 11 stock market sectors.

The GICS was created by Standard & Poor’s in 1999.

Key Information on the 11 Sectors Plus Pros and Cons

These 11 stock market sectors represent 11 groups of public companies that share similar business activities, products, services, or features.

1. Energy: Exposure to Different Stocks

The energy sector includes companies that focus on the exploration and production of energy products. However, with COVID-19, there has been a change in how energy resources are seen and utilized. The pandemic increased interest in renewable energy sources due to the energy pressures it exacerbated. Renewable energy infrastructure has shown potential to address some of those pressures. Still, investments in the clean energy sector are generally not as stable as investments in oil and gas. 

Some of the top categories in this sector are:

  • Oil and natural gas stocks
  • Pipeline and refining stocks
  • Mining stocks
  • Renewable energy stocks

Companies in the energy sector aren’t limited to just one category. Instead, they’re often focused on several operations around one energy product.

Additionally, the energy sector is vast. It accounts for trillions of dollars annually, and will always be in demand. Companies that increase the prices of their services tend to have more money to set aside for dividend payments. This sector also offers a variety of investment opportunities, from ‘traditional’ like oil and gas, to solar and wind energy stocks.

However, there are certain risks involved in investing in this sector:

  • Can be a highly volatile market
  • Companies involved in this sector often need to make huge investments into research and development and might lose money
  • There’s a chance of regulatory risk regarding limitations on the production of some energy sources
  • New technology may reduce long-term demand

2. Materials: Performs Well When the Economy Grows

The materials sector refers to companies that take raw materials or natural resources and turn those into useful products. Companies that produce chemicals, paper, glass, metals, packaging, construction materials, and so on.

This sector usually does well when the economy is growing and there’s a high demand for certain products. However, many things affect this sector, such as:

  1. Changes in the supply chain
  2. Cyclical demand for materials
  3. Changes in the economy that affect companies
  4. Legislation
  5. Inflation

3. Industrials: Essential for the US Economy

The industrial sector is one of the essential sectors of the US economy. It performs three functions:

  • Producing and distributing capital goods
  • Offering commercial services
  • Providing transportation services

The companies operating in these sectors are often related to aerospace, construction, transportation, waste management, and similar.

As with any other investment, recognizing the best company in the market is challenging. Investors often check whether the company has diversified operations, low operating costs, and solid credit ratings.

The industrial sector has a cyclical nature. Thus, it’s more suited for risk-tolerant investors. The sector is strong during economic growth. However, economic downturns directly reduce the demand for industrial goods and services, which may cause stock prices to drop.

The industrial sector includes construction, transportation and waste management.

4. Consumer Discretionary: Another Cyclical Sector

This sector deals with goods and services that aren’t considered essential for people. Usually, these include items and offers people can purchase if they have enough income. For example:

  • Cars
  • Durable goods
  • Leisure equipment
  • Household items
  • Media production
  • Apparel
  • Services like hotels and restaurants

This sector is the most sensitive to economic cycles. The companies that offer consumer discretionary products will grow quickly in a good economy, but slow down when the economy contracts.

Gross domestic product (GDP) is one metric to consider when investing in this sector. If GDP is on the rise, people are more likely to afford these items and services and the demand will increase.

5. Consumer Staples: Low Stock Decline During Bear Markets

In contrast to the consumer discretionary sector, the consumer staples sector includes companies involved in the production of foods, drinks, tobacco, and non-durable household items. The consumer staples sector tends to generate consistent revenue even during recession periods. Companies involved in the consumer staples sector may face lower stock declines during bear markets.

What’s more, it might happen that the demand for consumer staples increases during economic downturns. Those who invest in this sector usually benefit from dividend income, depending on their investment decisions.

The volatility in consumer staples is generally lower. This industry matures with modest growth.

The healthcare sector is one to watch right now, with record numbers of people reaching old age.

6. Healthcare: Essential for Aging Demographics

This sector includes companies that provide healthcare services and manufacture healthcare equipment and technology. These companies are present at all stages of pharmaceutical and biotech research, including development and production.

This is a highly interesting sector, with quickly growing companies and overall above-trend growth. Companies in the healthcare sector are often considered a hedge against market downturn.

These are the common healthcare stocks:

  • Drug stocks
  • Medical device stocks
  • Payer stocks (like insurers)
  • Healthcare provider stocks

There are several things to consider when looking into healthcare sector companies:

  • The company’s growth data
  • Growth strategies
  • Potential mergers and acquisitions
  • Financial statements
  • Valuation
  • Dividends

When it comes to risks, the primary issue is competition. A competitor discovering better products and services may drive another company down. The healthcare sector is also highly regulated, but any new regulation and/or FDA decision can drastically affect the company and its stock.

Additionally, drug companies are exposed to litigation risks. 

Still, aging demographics and technological advancements should, generally speaking, positively affect the healthcare sector long-term.

7. Financials:  Banking, Insurance, Finance

The financial sector includes companies involved in providing products and services around mortgages, banking, consumer finance, insurance and similar. This is one of the most important market sectors for the economy.

Types of financial sector stocks include:

  • Bank stocks
  • Insurance
  • Stocks from companies involved in other financial services
  • Mortgage REITs
  • Blockchain and cryptocurrencies
  • SPACs

The financial sector dictates how the economy functions, since it ensures the free flow of capital and liquidity in the marketplace. When the financial sector is strong, many other market sectors follow suit. Generally, this sector has shown robust growth and profitability. Still, it can be affected by changes in interest rates and other economic factors.

The financials sector includes banks, brokers and blockchain companies.

8. Information Technology: Offers Four Mega Sectors

The information technology sector involves companies that produce software and IT products and services. This includes the manufacturing of hardware, mobile phones, computers, and similar. Therefore, some experts divide this sector further, into four ‘mega sectors’:

  • Semiconductors
  • Software
  • Networking and internet
  • Hardware

The information technology sector is also widely used by many other industries. It’s one of the fastest growing stock market sectors in the last decade and contains some of the largest companies in the market (think Microsoft, Adobe, Oracle Corp, and so on).

Still, many new companies in this sector don’t produce cash flow right away. Competition is fierce in the space, and investors often use guesswork instead of calculated valuation to invest in a company.

9. Communication Services: New vs. Old

The communication services sector includes companies involved in everything from traditional media to the internet. This also includes entertainment-oriented companies, products like interactive games, communications services and so on.

The usual methods of analyzing communications stocks are:

  • Comparing companies that operate in the same industries
  • Comparing companies that are at similar stages of growth
  • Analyzing user base size and engagement trends
  • Paying attention to the company’s expenses

The communications sector offers growth opportunities for companies that focus on online services. On the other hand, companies that work with traditional communication services and products may face challenges as the industry evolves rapidly.

10. Utilities: Attractive Even in a Bad Economy

This is one of the stock market sectors that’s also essential for the economy. Companies in this sector provide electricity, gas, and water to commercial and retail users. Generally, this sector offers steady performance.

The utilities sector usually offers dividends to the company’s shareholders. Additionally, economic downturns can make utilities attractive for long-term investing. This sector generally has lower volatility.

On the other hand, the utilities sector is intensely regulated. Regulatory change can negatively impact these businesses. Organizations in this sector may also have to invest in expensive infrastructure to provide their services. This can place them in debt, which in turn can be sensitive to interest rate changes.

Real estate goes far beyond physical property, with REITs, development companies and other property-adjacent market opportunities.

11. Real Estate: Great for Portfolio Diversification

The real estate sector includes several indirect investment opportunities:

  • Companies that work in real estate services
  • Real estate developers
  • Equity REITs

Besides purchasing stocks from companies involved in this sector, investors also make money by renting and flipping properties (direct investing). This sector generally has steady growth. Depending on the type of investment, it can offer quick returns (flipping) or steady income (renting).

Investing in the real estate sector is a popular way to diversify one’s portfolio. This sector is not closely correlated to stocks, bonds, or commodities. Still, there are some limitations of directly investing in this sector:

  • Managing tenants
  • Potential property damage
  • Reduced income from vacancies
  • Requires deep market knowledge

When purchasing real estate stocks, investors should be careful about:

  • Management costs
  • REIT’s low growth
  • Interest rate changes
  • Possible market downturns

The 11 Stock Market Sectors and Ways to Invest

There are many different ways to invest in each of these market sectors. Some of the most common ones include ETFs, investment trusts, and index funds. Here’s how investors usually get in:

  • Energy sector: The easiest way to get into the energy sector is via mutual or index funds. There are many funds to choose from, and each is managed according to a strategy or energy index.
  • Materials, industrials, consumer discretionary, and consumer staples sectors: These sectors usually offers dividends, so buying individual stocks is one way to go. Some ETFs invest in companies in this sector as well.
  • Healthcare sector: Utilizing ETFs and healthcare mutual funds is the popular way to enter this market.
  • Financials, communication services sector and information technology and utilities: The most common way to get involved with these is through individual stocks.
  • The real estate sector: This market comes with several investment opportunities beyond property itself, such as REITs, real estate stocks (via a brokerage account or a tax-qualified retirement account), ETFs, index funds, and Real Estate Investment Groups (REIGs). 
The Navexa portfolio tracker
The Navexa portfolio tracker helps you track & analyze investments across every sector, asset class and multiple trading accounts.

These 11 Sectors Offer Unique Market Exposure And Diversification Opportunities

These market sectors are key to portfolio diversification. From products and services essential to everyday life, through to more speculative technology projects, diversifying across these sectors can expose a portfolio to a variety of potential risks and rewards.. 

For example, the materials sector, utilities sector, and services sector are key components of the economy, regardless of whether it’s growing fast or slow. Still, companies in these stock market sectors are often affected by market downturns, interest rates, and economic changes — some more than others.

However you invest or diversify, whether you’re into high-growth tech stocks, or slower, steadier opportunities like consumer staples and real estate, you must always track your trades, transactions and investment performance. 

Why? Because it’s essential to both optimizing your investment journey through data-driven decision making, and meeting reporting requirements at tax time.

Navexa helps you do all of this in an easy-to-use, accurate portfolio tracker currently being used by thousands of investors around the world. With detailed performance analytics and reporting on diversification, portfolio contributions, income and more, Navexa gives investors actionable insights on their portfolio. 

Create an account free today and see your portfolio like you’ve never seen it before.

Categories
Financial Literacy Investing Tax & Compliance

Tax Implications For Australians Investing in Foreign Stocks

Foreign investment taxes can be complex. Generally, investors will pay capital gains tax or income tax, depending on the conditions. Here’s how to deal with Australian taxation on foreign investments.

Many Australians want to know how and where to invest in foreign stocks, property, bonds and other investments. This means they need to understand the tax implications of doing so. Australian taxation rules might seem complex when it comes to investing in foreign stocks.

The Australian government has signed many tax treaties. These provide benefits to Australian residents who invest in foreign stocks in countries that have tax treaties with Australia. Such treaties sometimes mean Australian residents may be exempt from paying tax. However, they may have to pay it in the foreign country.

If there’s no tax treaty, Australian residents may have to pay tax on every type of investment gain. Some might be eligible for a discount, depending on how long they have held the investment.

Generally speaking, foreign investments are taxable, be it in the source country or Australia. If you’re an investor, you’ll most likely pay capital gains tax or income tax. Keep reading to learn about Australian tax on foreign investments and how easy it is to track them using the Navexa portfolio tracker.

Overseas Investing From Australia

Australian residents are free to invest in foreign assets. They can own overseas property, offshore bank accounts, businesses, and stocks. Owning foreign investments requires that Australians comply with the latest rules and regulations regarding tax.

foreign investment tax
Australians can invest overseas, but need to understand their domestic and foreign tax obligations.

Interacting with the Australian Tax System

Every Australian resident is subject to tax on their income. This includes investment income such as dividends as well as capital gains from foreign investments. However, the Australian government has signed more than 40 tax treaties with other countries, including the US.

The US-Australia tax treaty gives Australian investors certain benefits. For example, there’s a reduced tax rate for US-sourced income (dividend payments) if certain conditions occur. Investors can also fill out specific forms that drop the rate of withheld tax from 30% to 15%. But, they may have to pay taxes in the US.

Australian investors might be able to claim US withholding tax from their dividends as a Foreign Income Tax Offset (FITO). FITO helps reduce taxes on foreign earnings.

But FITO rules are complex. It may be useful to seek professional guidance around this. Both the Inland Revenue Service (IRS) and US tax advisors can provide in-depth information for individual situations.

W-8BEN-E: A Key Form For Foreign Investors

The US government requires Australian investors fill out certain forms when investing in the country. A W-8BEN-E is a common form. It determines which investors are subject to paying 30% of their gross income earned in the US to the IRS. This form defines:

  • Interest
  • Royalties
  • Annuities
  • Rent
  • Premiums
  • Compensation for services
  • Substitute payments, if applicable

It’s required for all US holdings and remains valid for three years. If your information changes, you’ll be required to submit an update.

foreign investment tax
Australian residents for tax purposes have to declare all worldwide income.

Do Australian Residents Pay Tax on Gains and Income from Foreign Investments?

Australian residents for tax purposes have to declare the income they earn regardless of where that income came from. This is called the ‘worldwide income’ and it includes:

  • Pensions
  • Annuities
  • Business activities
  • Employment
  • Assets
  • Investments
  • Dividends from shares
  • Capital gains on overseas assets
  • Interest from bank deposits or bonds
  • Rental income from real estates
  • Royalties from intellectual property

If you have a temporary resident visa, you won’t pay tax on income. In case you receive income from a country that hasn’t signed a tax treaty with Australia, you’ll likely pay taxes in both countries. However, the tax you pay in a foreign country may make you eligible for FITO.

Australia also receives and exchanges information on all financial accounts with many foreign tax authorities. 

How Is Foreign Investment Taxed?

Australian investors who have foreign assets and receive income from overseas will usually have to pay capital gains tax once they sell that asset. However, there could be other forms of taxes they are required to file (such as income from dividends). This is why it’s important to keep all the records on transactions, regardless of the country in which you invest.

Here’s where Navexa makes life easier. Our smart portfolio tracker lets you track foreign investments in both their local currency, and your tax residency’s currency, too.

This makes it super simple to monitor the performance of your foreign shares and keep records of all transactions for tax and compliance purposes.

Foreign investment tax
The way dividends are taxed depends on the tax treaty between Australia and the source country.

Types of Investments and Their Taxation

Australian investors have access to several investment opportunities abroad. These are the most common ones.

Buying & Selling Stocks

Australians can own foreign stocks. Any individual who holds shares for more than 12 months may be eligible for the CGT discount. If they make a gain when they sell, Australian investors are required to notify the Australian Taxation Office. Investors are also advised to consult with the foreign tax authority to check the taxation process on capital gains.

Receiving Dividends From Foreign Investments

The way dividends are taxed depends on the tax treaty between Australia and the source country. In many cases, the source-country dividend tax is limited to 15%. Receiving dividends from companies that satisfy certain public listing requirements may result in tax exemption.

Depending on the conditions, some investors may be eligible for ‘franking credits’. That’s a form of tax credit that can offset against tax on dividends. Generally speaking, those who hold shares for a certain holding period (45 or 90 days) may be eligible.

Cryptocurrencies

In recent years, cryptocurrencies have become a major investment theme for Australian residents. When it comes to paying tax, Australian investors have to pay capital gains tax on crypto. On the other hand, professional traders pay income tax.

P2P Lending

Peer-to-peer (P2P) lending is a form of investment that’s accessible globally. Australians can access P2P lending platforms and lend money to borrowers without an intermediary. Peer-to-peer lending income listed in an investor’s loan portfolio will be included in the tax return form. For most people, this income is taxed like income from other investments. Australians who earn via P2P lending in foreign countries should consult their accountant.

Property Income

Australians who realize a gain when they sell foreign property are required to pay capital gains tax. However, if they held the property for 12 months or longer, they might be eligible for a 50% capital gains tax discount.

Additionally, investors who are subject to an overseas tax after selling their property will receive tax credits in the form of a foreign tax offset. Rental income may also be taxable in Australia or a foreign country, depending on the location of the property and current tax treaties.

Purchasing Bonds

Bonds can be highly tax efficient, since there are some benefits for those who hold them for 10 years. Otherwise, bonds are subject to the corporate tax rate of 30%. Investing in bonds means investors might not be eligible for tax credits and some other benefits.

Foreign Investment Capital Losses

Investors may sell a foreign investment for a lower price, and end up with a capital loss. In some cases, investors can use capital losses to reduce capital gains tax. Capital losses must be used at the first opportunity, unless there are restrictions. Capital losses can’t be used to reduce income, and should be reported to ATO just like capital gains.

The Navexa portfolio tracker
Navexa lets you track foreign investments in both your tax residency’s currency and the local currency of the asset.

Foreign Investments: Track Everything Correctly

If you’re an Australian resident for tax purposes, you’ll be required to pay some form of Australian tax on foreign investments.

In general, all your worldwide income will be subject to tax, it’s just a matter of where you pay that tax. It’s always a smart idea to get familiar with the laws around this, and to consult professionals regarding your personal financial situation.

Further to this, serious investors should always track their transactions and portfolio performance for the purposes of both compliance and optimizing their investment strategy.

The Navexa portfolio tracker does exactly this. Track Australian and overseas investments, access detailed performance analytics on income, currency, trading fees and more.

And, most importantly, ensure your foreign investment gains and income are reported accurately at tax time.

Sign up to Navexa now for a free 14-day trial to see how easy tracking and reporting on foreign investments can be!

Categories
Financial Literacy Investing

How to Calculate Total Stock Return

Total Stock Return is an investment performance metric that measures capital gains & income together. Here’s how to calculate it, use it, pros & cons, and more.

It’s vital to understand how your investments are performing. This is especially true for stocks that provide a dividend, which can have a significant impact on value and performance.

This is why it’s useful to know how to calculate total stock return. Knowing this allows investors to determine the real value they receive from their stocks, and better plan their investment strategy.

The Total Return, or Total Shareholder Return (TSR), also called the Total Stock Return, is the number that shows the amount of value gained for an investment. TSR includes dividends, and capital gains.

Here are some of the ways to calculate total stock return, including using the Navexa portfolio tracker, and its Modified Dietz Method.

Total Stock Return shows the amount of value gained for an investment.

What Are Total Returns?

Stocks can give returns in a couple of ways:

  • Through the increase of the stock price.
  • Through dividends.

Total stock return reflects all returns from capital gains, dividends paid, plus any other gains.

It’s measured for a specific time period, and helps the investor see performance over that period. The metric can be expressed as a percentage, or a dollar amount.

The Importance of Total Return

There are several reasons investors should keep track of their total returns. Primarily, this number shows how well the investment performs. It’s also handy for comparing stock performance to each other, or the wider stock market.

Some investors tend to ignore the total returns of their holdings, and only focus on how the individual stocks move day to day, or week to week. This can create confusion about investment performance and strategy.

Since TSR accounts for the initial and ending stock price, plus dividends, it gives clarity over total investment performance.

Finally, knowing the total return helps with dealing with taxes and authorities, and possibly minimizing tax on investments.

It’s important to understand total stock return, not just capital gains alone.

Terms Investors Should Know

When dealing with the total stock return, investors should understand key investment terms, and concepts. Understanding the following ideas can help shareholders improve their financial literacy.

  • Annualized return: Return on investment over a 12-month period.
  • Simple returns: Returns that are based on the initial investment only.
  • Compound return: Return that’s paid for the initial investment plus accumulated income.
  • Compounding frequency: The rate at which an investment compounds — it could be annually, quarterly etc.
  • Dividend reinvestment: Receiving dividends as additional shares instead of cash.
  • Internal rate of return (IRR): Similar to total returns, only includes a future profitability metrics.
  • Expected total return: Same as total return, but using future assumptions instead of actual earnings.
  • Unrealized capital gains: Gains that are yet to be converted into cash by selling out of an investment.
  • Realized capital gains: Financial gains after an investment is sold.
  • Risk-adjusted return: Metric that includes investment risk levels while calculating returns.

How to Calculate the Total Return for a Stock?

There are several ways of calculating total stock return. The shareholder may use the formula below, an online calculator, or a next-generation tool like the Navexa portfolio tracker.

TSR Formula

There are a few steps to take before working with the TSR formula.

First, investors should calculate the capital gain on their investment since they purchased it.

For example, if the initial investment was at $100 a share, and the share is now trading at $150, capital gains are $50 per share.

Then, add all the dividends, and other earnings that the investment has paid during the entire holding period. This will show the total stock return, expressed in dollars.

The simple formula goes like this:

TSR = (capital gains + dividends) / purchase price

The purchase price is the amount of money the shareholder invested in the stock.

To get the TSR as a percentage, use the dollar amount of the total returns, divide it by the price paid for the investment, and multiply the result by 100.

TSR Annualized Formula

To annualize their total return, investors should:

  • Take the percentage calculated in the previous step and add 1.
  • Then raise that number to the power of 1 divided by the number of years they held the investment.
  • And finally subtract 1.

This is a more complex formula, and it looks like this:

Annualized total return = (total return + 1) ^ 1/years – 1

Furthermore, this formula assumes annual compounding. Some shareholders may use monthly or continuous compounding, but this calculation should be enough.

TSR Calculated in Excel Sheet

Besides using the total return formula, some investors use Excel to get their numbers. The “Rate” formula can help out, but the shareholder still has to manually enter the details of their overall performance to get the correct data.

There are many ways to track total stock return, from manual to automated.

TSR Calculator

Those who want to calculate their total return can also use online TSR calculator forms. They can select their currency, fill in the starting and ending stock price, enter the total amount of dividends, and run the calculation.

TSR Calculated in Navexa Portfolio Tracker

Investors can use Navexa to get deeper insights into their holding and portfolio performance. 

The method behind Navexa’s calculation is called the Modified Dietz Method. It provides a dollar-weighted analysis of the returns. It’s known as one of the most accurate methods to calculate investment performance, and gives investors a detailed view of their total stock returns.

Plus, our tracker accounts for the frequency, and size of cash flows, providing a complete picture of performance. 

Total Shareholder Return Example

Here’s a simple example of TSR:

Let’s say an investor purchased 100 shares, each of them for a price of $10. This makes their total investment $1,000.

The shareholder decided to hold this number of shares for a certain period of time. During this time, the company paid a $2 per share dividend, while the share price hit $12.

The TSR for the time period equals ($12 – $10) +$2 / $10 = 0.4

To get the percentage, the investor should multiply this number by 100, which equals 40%.

Advantages and Disadvantages of Total Shareholder Return

There are many benefits of using Total Shareholder Return:

  • It’s a solid tool for performance analysis.
  • TSR is highly valued as a performance metric because of its simplicity.
  • The calculation offers a clear idea of an investment’s overall performance.

On the other hand, TSR is not a perfect methodology. Some of its disadvantages include:

  • It’s limited to the past performance of the stock and dividends paid per share.
  • Any market volatility, and market fluctuations will affect TSR numbers.
  • It only evaluates performance for a single period.
The total stock return formula has advantages and disadvantages.

Total Return With Reinvested Dividends

For shareholders who reinvest their dividends, calculating total return is a bit more complicated. This is because each of the reinvestments, including the capital gains, can easily become its own TSR calculation.

The formula we mentioned won’t work with this type of investment, as the new shares accumulate at the current trading price. This causes investors to end up with more shares than when they received the dividend. Plus, those shares will also start paying dividends on their own, and the numbers will start piling up.

The best solution to this issue is to simplify the approach — observe the overall investment, instead of looking at it on a per-dividend basis.

Using Navexa is an ideal way of keeping tabs on real returns and investment performance. The platform supports tracking for cryptocurrency ROI, so investors can view all their investments’ performance in a single account.

How to Use the TSR Formula in Investing?

There are many uses of TSR in investing. As we stated above, it’s a great way of comparing the total performance of different investments over time.

This is especially true for shareholders who would like to know which of their stocks (that pay dividends) are performing the best. With TSR, investors get a metric that tells them the past performance of an investment.

TSR can also help in improving investment strategy

Benefits of TSR in Investment Strategy

When it comes to stocks and investments, knowing the total and expected returns is crucial for making the right decisions.

The total return formula helps people who want to understand how their investments are performing. The calculation accounts for all gains, dividends, and other earnings This gives investors a clear picture of how their investment strategy has been performing.

The Navexa portfolio tracker is a powerful way of keeping track of total stock return.

A Useful — But Not Perfect — Investment Performance Metric

Being actively invested in the stock market means one should be keeping track of every share and dividend in one’s portfolio. 

One of the easiest ways to do this is with the Total Stock Return formula. The TSR calculation includes all gains, and dividends earned per share received over a given period.

However, this calculation is limited to the past value of the dividend, and stocks. Plus, it can be affected by market volatility.

Still, it’s a great way of evaluating investment performance. 

For a fuller, clearer picture of investment and portfolio performance, try Navexa. We’ve developed an all-in-one portfolio tracking platform that shows the true performance of stocks, crypto and unlisted investments. 

Navexa’s advanced performance calculation accounts for capital gains, dividend income (including reinvested dividends), currency gain and other key factors that impact true performance.

Try Navexa free for 14 days — create your account now.

Categories
Financial Literacy Investing

How to Use the Discounted Cash Flow Model to Value A Stock

The discounted cash flow (DCF) method can help you calculate the current value of an investment. DCF can be used to value companies, stocks, and bonds. Keep reading to learn how to use it.

Determining the current value of a stock is a key part of investment research. One method for doing this is the discounted cash flow (DCF) method, which values a stock — or any other investment — based on predicted future cash flows. 

The DCF model involves several steps, each calculating different data, to estimate the present value of stocks, bonds, or businesses.

The DCF model relies on the weighted average cost of capital as the hurdle rate. However, you’ll also likely have to calculate a terminal value, intrinsic value, free cash flow (FCF), and a few other metrics before employing the DCF formula. Here’s what you need to know.

How do Investors Determine the Value of a Business?

The discounted cash flow method is one of the best ways of valuing a business.

Investors generally evaluate a business before they invest in it. Luckily, there are several methods to determine whether an investment’s current price represents fair value or not. 

They may use comparable financials to identify similar companies in an industry or sector. They may access databases which provide financial information and a value range for companies. 

The discounted cash flow method is one of the best ways of evaluating established companies with a good track record of revenue and costs.

However, the discounted cash flow model is quite complex to work with. It involves multiple calculations related to cash flows, rate of return (RoR), equity, and so forth. The discounted cash flow calculation can be used for stocks, businesses, bonds, and other business projects.

Navexa provides a powerful discounted cash flow calculator. You can use this to estimate a stock’s value by inputting key financial metrics — a handy addition to Navexa’s automated portfolio tracking and tax reporting tools for stock and crypto investors. 

Introduction to the Discounted Cash Flow Model

Anyone who understands the basics of DCF can use it to evaluate a business.

The discounted cash flow model is helpful in determining a company’s ‘intrinsic’ value. It’s used to determine the value of an investment based on estimated future cash flows. The DCF method is the standard in evaluating privately-held companies, although it could be used for publicly-traded stocks, too.

For many, DCF is a complex mathematical and financial equation, most commonly used by Wall Street experts. However, anyone who understands the basics of DCF can use it to evaluate a business.

The first thing to look into is the weighted average cost of capital (WACC). The WACC represents the hurdle rate for this model, and it’s the minimum RoR required for the project or the investment. Riskier projects have a higher hurdle rate, and vice versa.

Related Terms

These are some of the related terms you should know about if for DCF:

  • Time value of money — a core principle in finance. This refers to the fact that a sum of money is worth more now than in the future due to its earning potential.
  • Discount rate — in terms of DCF, discount rate refers to the interest rate used to showcase the current value.
  • The risk-free rate of return — a theoretical term that refers to interest received from a risk-free investment.
  • Terminal value — the value of the asset/business/project that goes beyond the forecast period. It assumes the business will have a set growth rate forever. It’s used as an indicator of future cash flows.
  • Earnings per share — shows the amount of money a company earns for each share. It’s often used for determining the value of a business.
  • The intrinsic value of a business — observes the value of a business on its own. Represents the present value of all expected future cash flows with an appropriate discount rate.
  • Internal rate of return (IRR) — a discount rate used to estimate the profitability of an investment.
  • Net present value of a company — a method of calculating your ROI.
  • EBIDTA — earnings before interest, taxes, depreciation, and amortization; represents a measure of a company’s overall financial performance.

Formulas You Might Need

Calculating discounted cashflow relies on multiple other formulas.

There are several formulas you might need to perform a DCF calculation. 

Time value of money

PV = FV / (1 + r)

Where:

PV is the present value

FV is the future value

r is the rate of interest

Besides the formula, you can use an online calculator to get these numbers if necessary.

Terminal value

(FCF x (1 + g)) / (d – g)

Where:

FCF represents free cash flow for the last forecast period

g is the terminal growth rate

d is the discount rate (usually the weighted average cost of capital)

Earnings per shares outstanding

EPS = net income of company – preferred dividends / common shares outstanding

Free cash flow FCF

FCFt = OCBt- It

Where:

FCFt is a Free Cash Flow

OCBt is Net Operating Profit After Taxes

It is an investment during the period

DCF is adjusted for the ‘time value’ of money.

The discounted cash flow formula

DCF = CF1 / (1+r)^1 + CF2 / (1+r)^2 + CFn / (1+r)^n

Where:

​CF1 is the cash flow for year 1

CF2 the cash flow for year 2

CFn the cash flow for additional years

r is the discount rate

If the results are above the current cost of the investment, the opportunity will likely result in a positive ROI.

What Can Discounted Cash Flow Tell You?

DCF helps calculate how much money one could receive from the investment if they invested in it today. It’s adjusted for the time value of money, which further helps determine whether future cash flows will be equal to or higher than the value of your investment.

Furthermore, DCF can be used for calculating:

  • The cost of purchasing an investment
  • Rental income
  • Expenses like mortgage, utility bills, cost of debt
  • Estimated sales proceeds

Where to Find the Necessary Data?

The DCF calculation is highly sensitive to the data used in it.

In order to successfully do the DCF valuation, you’ll need to find specific rates. These are:

  • The growth rate of the cash flows.
  • The discount rate that you’ll use to discount future cash flows.
  • Terminal rate to determine the final value of the DCF.

Growth Rate for Cash Flows

Since the DCF calculation is highly sensitive to the data you enter, it’s best to start within a reasonable range. Check the company’s balance sheet for past growth rates and use those to predict future cash flows. Remember that any number you choose is an estimate, and will affect your final result.

To calculate the growth rate, subtract year 1 cash flows from year 2 cash flows. Then divide the result by year 1 cash flows.

Discount Rate of Return

Next, you should find the discount rate of return for cash flows. To do this, use the WACC method. As we said before, the WACC is fundamental for discounted cash flow calculation.

To get WACC numbers, you should find the cost of debt and cost of equity first. Then, you should calculate the weights of both.

The formula for the weight of debt is:

WD = Total debt / (Market cap + total debt)

The formula for the weight of the equity is:

WE = Market cap / (Market cap + total debt)

Then, you calculate the WACC. The formula goes as follows:

WACC = (E / V x Re) + [D/V x Rd x (1 – Tc)].

Where:

E is the market value of the firm’s equity

D is the market value of the firm’s debt

V is E + D

Re is the cost of equity

Rd is the cost of debt and

Tc is the corporate tax rate.

Lower WACC is considered better than higher WACC.

Terminal Rate

The terminal rate is also one of the key inputs of the DCF calculation. It influences the value you’ll calculate for the future.

If you’re hoping to stay consistent in calculations, you should use the same rate you used for calculating the discount rate, WACC, or the rate at which the company grows.

Now that you have these numbers, it’s time to move on to the DCF calculations.

Value Investments Using the DCF Method: Companies, Stocks, and Bonds

The DCF model is great for evaluating different kinds of investments, including bonds and stocks. Here’s how you can use it to see whether a certain investment is worth its current price.

How to Use DCF to Value a Company?

There are two common methods for working out a company’s future cash flow.

There are certain steps to make to successfully calculate discounted cash flow for companies:

  1. Analyze the income
  2. Determine terminal value
  3. Calculate enterprise value
  4. Include additional assets
  5. Subtract all debt and non-equity claims

Since the DCF model reflects the value of a company’s future cash flows, the first step is to understand and analyze the income of the organization. There are two common methods for this:

  1. Unlevered DCF approach — forecast and discount entire operating cash flows, then add non-operating assets and subtract liabilities.
  2. Levered DCF approach — forecast and discount cash flows that remain available to shareholders after non-equity claims have been deducted.

At a certain point, you’ll stop calculating unlevered free cash flows and move to determine the lump sum or terminal value. The terminal value represents the value of a company beyond the final explicit forecast period. For this, you’ll usually use the estimate numbers.

The next step is to determine the enterprise value. This number represents the value of a company’s operations to all stakeholders.

If a company has any money sitting around, you should include that money into the present value of unlevered free cash flow.

The final step is to subtract all debt and non-equity claims to calculate what’s left for the equity owners.

How to Use DCF to Value Stocks

The DCF method is useful for evaluating stocks.

The DCF method is also handy for evaluating stocks. Here’s how:

  1. Take the average last three years of the company’s cash flow.
  2. Multiply the FCF with the expected growth rate to get the FCF for the future.
  3. Calculate the value of that cash flow by dividing it by the discount factor.
  4. Repeat the process for the next X amount of years to get the net present value (NPV) of the FCF.
  5. Calculate the terminal value of the stock by multiplying the final year FCF with a terminal multiple factor.
  6. Add the values from steps 4 and 5 and adjust the total cash and debt (find these in the company’s balance sheet) — this gives you the market value of a company.
  7. Divide the market value of a company by the shares outstanding to find the intrinsic value per share.

How to Price Bonds with DCF?

Determining the fair value of the bond involves calculating the bond’s cash flow.

Finally, you can use DCF to value bonds, as their price is based on a model close to the DCF one. Typically, determining the fair value of the bond will involve calculating the bond’s cash flow (current value of a bond’s future interest payments) and its face value (the value of a mature bond).

Both these values are fixed, which helps you determine the bond’s RoR.

Here’s what to look at:

  • Maturity date: Short or long-term, when reached, the bond’s issuer must repay the bondholder the full bond value.
  • Discount rate: Interest payments that go to the bondholder, usually a fixed percentage of the face value.
  • Current price: Bond’s current value, dependent on several factors such as market condition.

Pricing a bond is relatively simple, and can be done in the following way:

Calculate face value, annual discount rate, and maturity date

Collect the basic information about the bond; face value, on-par value, and the bond’s annual coupon rate. Also, note the maturity date. You’ll need these numbers to continue the DCF valuation method.

Calculate expected cash flows with the formula:

Cash Flow = annual coupon rate x face value

Discount the expected cash flows to the present

Cash Flow ÷ (1+r)^t

Where:

r is the interest rate

t the number of years for each cash flow

Value individual cash flows

To calculate the cash flows, use the following formula for each year:

Cash Flow Value = Cash Flow / (1+r) ^ 1 + 30 / (1+r) ^ 2… + 30 / (1 + r) ^ 30

Calculate the final face value that you’ll receive at the bond’s maturity date

Final Face Value Payment = Face Value / (1+r) ^ t

Add the cash flow value and the final face value and you’ll get the value of the bond.

Benefits of Discounted Cash Flow

The main pros of DCF:

  • Highly detailed
  • Includes all major assumptions about the company/project
  • Determines the intrinsic value of a business
  • Includes all future expectations about the business
  • Suitable for analyzing mergers and acquisition
  • Can be used to calculate IRR

Limitations of the DCF Model

The main cons of this model:

  • Involves a large number of assumptions
  • Prone to errors
  • Too complex for novice investors
  • Sensitive to changes in assumptions
  • Isolates the company’s value
  • Doesn’t include competitor’s value
  • Terminal value TV is hard to estimate
  • WACC is hard to estimate

Is DCF the Same as Net Present Value?

Even though these two methods are related, the DCF is not the same as net present value (NPV). NPV is actually the fourth step in calculating the DCF. It’s used to deduct the upfront costs of the investment from the investment’s DCF.

Final Word On The Discounted Cash Flow Model

The Navexa portfolio tracker provides an automated discounted cash flow valuation calculator.

The discounted cash flow valuation method projects a series of future cash flows and earnings, which it discounts with the time value of money. It’s one of the best ways to assess the present value of stocks, bonds, or businesses.

The DCF method is most suitable for experienced investors since it’s complex. 

So, now you know how to analyze a potential investment’s value using the discounted cash flow method. And, since you’ve landed here on the Navexa blog, we have good news:

You can skip the complex calculations by using the automated discounted cash flow valuation calculator we’ve built into Navexa.

Navexa is a portfolio performance tracking and tax reporting platform that allows you to track your stocks and cryptos together. 

Sign up to Navexa free today, and run value calculations on as many stocks as you like!

Categories
Financial Literacy Investing

The 12 Key Metrics of Dividend Investing

Discover the twelve key metrics investors use to assess dividend-paying stocks and the companies behind them.

Investing in dividend stocks is one of the proven, long term methods of building wealth and passive income. Investors can enjoy compounding investment income for many years, and even build enough income that they can live on dividend yields alone.

Researching dividends can be a complex process. So in this post, we’re going to walk through 12 of the key metrics investors can use when analyzing a dividend paying stock or company. 

Dividends: The Basics

Dividends are a company’s payments to its shareholders. Many investors prefer to hold dividend stocks, since they can collect cash dividend payments, or collect additional shares through dividend reinvestment programs. 

There are different types of dividends available to shareholders:

  • Cash dividend — the company shares a portion of its net income with shareholders.
  • Stock dividend — instead of paying cash, the company issues more shares.
  • Property dividend — the organization offers its assets to shareholders.
  • Liquidating dividend — not taxable, the company pays it from liquidating its assets.
  • Special dividend — contains additional cash profit, and is higher than regular dividends.
  • Interim dividend — paid before issuing the actual dividend.

Dividend stocks are sometimes less volatile than growth stocks. This can make them preferable for investors with lower risk tolerances.

Dividends are often paid quarterly, but some companies pay them out annually. A consistent dividend payout might be a sign of a healthy company, but that’s not always the case.

Companies might sometimes offer high dividend yield to entice further investment, when in reality, the business is failing. This is called the dividend trap.

This is why it’s crucial to learn how dividends work, and understand how to analyze the key metrics of dividend-paying stocks.

How do Dividend Stocks Work?

Income investors look for stocks that pay a portion of their profits in dividends.

These types of stocks can deliver returns in two ways:

  1. Dividend income from dividend payments
  2. Growth of the stock price

Additionally, the dividend payouts can compound when they’re reinvested into shares. Stocks can pay dividends despite the share price fluctuating.

Investors can use the money to:

  • Reinvest in the shares of the same company
  • Buy stocks of different organizations and diversify the portfolio
  • Save the money
  • Spend the money

Dividend Investing: How to Start

Dividend investing means buying stocks because they pay out regular dividends. Investors seek these stocks by looking for companies that offer stocks with a stable, regular dividend payout. 

The usual steps of investing in dividend stocks include:

  • Opening a brokerage account — best and fastest option is opening the account online.
  • Funding the account — verifying the identity, and connecting the bank account usually lasts a few days.
  • Buying the right stock — this decision should be based on knowing the investment goals and proper research.
  • Collecting the dividend yield — once someone holds the stocks for a certain time, they’ll receive the first dividend payment.

Top 12 Key Metrics for Dividend Stock Analysis

Researching dividend stocks involves different layers of company and share price analysis.

There are many metrics to follow in dividend investing. These help to build an understanding of how well the company operates, how stable its earnings are, and possible future growth.

  1. Dividend Payout Ratio

The dividend payout ratio is one of the most common financial ratios investors check. It measures how much of a company’s earnings (after tax) is paid out in dividends. It also shows how stable the dividends are and how much the business is growing. High dividend payout ratios tend to be regarded as riskier — since most of the company’s earnings go into dividends, they might not be sustainable.

Dividend payout ratio is calculated by dividing dividends paid by earnings after tax, and multiplying the result by 100.

  1. Free Cash Flow

Investors can see the business’s cash flow from the company statements. Free cash flow shows how much expenditure a company has and how much free cash remains to be given to shareholders through dividends. The better the free cash flow, the more cash is available for dividend payouts.

Free cash flow is calculated using three factors:

  • Operating cash flow
  • Sales revenue
  • Net operating profits
  1. Return on Invested Capital

Shareholders will usually invest in companies that can grow their capital quickly. Return on invested capital is a similar measurement to return on equity, only it shows a company’s return on both equity and debt. 

It’s calculated by dividing the net operating profit after tax by the amount of invested capital.

  1. Operating Profit Margin

The company’s operating profits show the earnings before interest and taxes. The operating profit margin is a ratio of income to profits from sales. The higher the ratio, the stronger the dividend income prospects (in theory).

The operating profit margin is calculated by dividing the operating income (earnings) by sales (revenues).

  1. Asset Turnover

This is a less known financial ratio, but still equally important as others. It measures how many dollars of sales were generated by each dollar of assets. Organizations that have more sales usually generally offer stronger returns.

This metric is calculated by dividing net sales (revenue) by the average total assets.

  1. Sales Growth
Using a dividend reinvestment plan, investors can compound their holdings by accumulating additional shares.

Sales growth is one of the best metrics to see whether the company has a good business model driving higher revenue. Good sales growth trends show potential for growth. 

It’s calculated by first subtracting net sales of the previous period from the current period. Then, the result should be divided by the net sales of the previous period and multiplied by 100 for a percentage.

  1. Net Debt-to-Capital

Businesses also go into debt. This is why net debt-to-capital is crucial for understanding how the organization deals with its finances. Overall, a net debt-to-capital ratio below 50% is considered good.

This metric is calculated by dividing the company’s net debt by its capital.

  1. Net Debt / Earnings before interest, taxes, depreciation, and amortization (EBITDA)

EBITDA compares a company’s debt to its earnings. It’s often used to compare different businesses. Net debt divided by EBITDA shows how many years the business will take to eliminate debts with cash on hand and annual cash flows.

  1. Price-to-Earnings Ratio

P/E is another popular calculation to know. It divides a company’s stock price by the earnings per share, revealing to the market how much the company is worth. In general, the P/E ratio of less than 20 is considered good.

  1. Total Shareholder Return

TSR helps investors observe both the stock price and dividend yields. It accounts for both the price and the dividends paid. It’s a way to see where a stock sits relative to the wider market.The formula is:

TSR = ( (current price – purchase price) + dividends ) / purchase price

If you want to see how your investments are really performing, you must factor in portfolio income. Navexa makes it easy to see your complete returns for all your stocks and crypto.

  1. Dividend yield

Dividend yield represents the percentage of annual dividend payments to shareholders. This number shows what the investor can expect to get in the future from the stocks they hold, if the dividends remain the same. However, the dividend yield can change over time, depending on the market conditions and company developments.

This metric is calculated by dividing cash dividend per share by the current price per share. To get the percentage, multiply the result by 100.

  1. Dividend Growth Rate

Besides looking into dividend yield, investors also observe the dividend growth rate. This metric shows how much a dividend has increased each year. Those businesses that offer an annual dividend increase could be more appealing.

A steady, long-term increase in dividends shows that the company is (in theory) generating enough cash flow to fund that growth. The formula for dividend growth rate is:

Dividend Growth Rate = (D2/D1) – 1

What Is Considered a Good Dividend Payout Ratio?

Dividend payout ratios between 30% and 50% are generally considered healthy.

Investors often look for the best possible dividend payout ratio. Overall, a ratio of 30% to 50% is considered healthy. Payout ratio numbers above 50% may appear unsustainable.

Additionally, the dividend payout ratio varies from industry to industry. For example, you might notice different dividend yields in the tech sector versus among utility companies.

How Are Dividends Taxed?

In Australia, investors must pay taxes on both capital gains and dividends.

However, companies pay out dividends that have already been subject to taxation. Australian laws recognize that shareholders shouldn’t be taxed again on the same profits, so investors receive a rebate for the tax that companies have paid. These dividends are known as “franked”. They also have a tax credit.

On the other hand, ‘unfranked’ dividends don’t have a tax credit, as the company didn’t pay taxes for them, so investors will have to.

The financial year in Australia goes from July 1 to June 30. This is the period when shareholders should collect all the financial information and go through an assessment.

In Australia, dividend reinvestments are treated the same as cash dividends. This means that if you receive shares instead of cash, you’ll still need to pay taxes.

If you struggle to calculate portfolio gains for the fiscal year, Navexa is here to help. Once you upload your portfolio, Navexa’s taxable income reporting tool automatically calculates your obligations and provides a detailed breakdown for reporting purposes.

What’s more, you can download this data in XLS or PDF and easily report your capital and other gains.

What Is a Good Dividend Strategy?

Some investors time their buying and selling based on a stock’s dividend activity.

Dividend strategy refers to planning around when to buy and sell shares in a dividend-paying stock. The dividend capture strategy is one of the common ways investors get into dividend stocks.

To do this, investors keep track of the dividend timeline:

  • Declaration date — when the company announces dividends.
  • Ex-dividend date — when the stock starts trading without the value of the dividend.
  • Date of record — when current shareholders receive dividends per share.
  • Pay date — when dividends are paid.

In this strategy, the best moment to purchase the stock is right before the ex-dividend date. Then, investors would receive the dividends, and sell the shares right after they’re paid. The main purpose of buying and selling is to get the dividend, then exit the position.

This is the opposite of long-term investing, where the investor keeps the stocks and allows for compound growth.

What Is Dividend Analysis?

Dividend analysis is when investors to analyze dividend-paying stocks over a long period. The data is presented in graphs and shareholders can easily see if the company pays regular dividends per share, and if it increases them. Dividend analysis also shows how sustainable dividend payouts are for the company based on current earnings.

Pros and Cons of Dividend Investing

Many investors get into dividend stocks to boost their passive income through dividend yield. Still, there are some pros and cons to consider when it comes to investing in dividends.

Pros:

  • Great source for passive income.
  • Dividend stocks may be less risky than smaller, speculative companies.
  • Long-term dividend stocks may be relatively stable.
  • Many ways to utilize the annual dividend per share.

Cons:

  • Investors need a lot of capital to create significant income.
  • The business may change the dividend policy.
  • Dividend taxation may confuse new investors.
  • Requires careful research.
Navexa’s portfolio tracking platform automatically tracks all dividend income, reinvested dividends, and breaks down how it impacts a portfolio’s performance.

Final Word On Key Dividend Metrics

Investing in dividend stocks can be a solid strategy — or part of a strategy — for building long-term wealth in the stock market. However, experienced dividend investors know there’s more to it than just picking out the first company they come across.

The dividend payout ratio is one of the most important metrics to consider. The other 11 metrics we’ve detailed here are also important in analyzing a dividend stock. These key metrics can help to analyze not just the stock price, dividend yield, or payout ratios.

They also tell a story about how the company operates and whether purchasing a specific stock could provide a long-term dividend yield or perhaps indicate a dividend trap.

Keep in mind that dividend investing carries both risk and tax obligations. This is where Navexa can help.

We’ve built a powerful automated tracking tool that allows you to track all your stock and crypto performance in one place. Navexa tracks and records all dividend income and calculates its impact on your total performance.

At tax time, our Australian customers can run automatic reports to calculate and optimize both their CGT and taxable income activity.

Sign up for free today and test out Navexa’s powerful automated investment performance tracking and tax reporting tools.

Categories
Financial Literacy Investing

How to Calculate Compound Annual Growth Rate

Compound annual growth rate, or CAGR, is one of the key methods for calculating investment performance. Here’s how to calculate it manually — and a fast way to automatically see an investment’s compound annual growth rate.

CAGR, or compound annual growth rate, is a method investors use to measure the annual growth rate of an investment.  Generally it’s only used for portfolios that compound their growth by generating income which is in turn subject to capital appreciation.

While it’s not the only method of determining an investment’s long-term annual returns, it is one of the most popular. As we’ll show in this explainer, CAGR has advantages and disadvantages — which is why the Navexa portfolio tracker allows you to compare CAGR-measured performance with other calculation methods. 

What Is Compound Interest?

To understand CAGR and its possibilities, you should first understand how compound interest works. Compound interest is what happens when money accrues interest, and that interest then accrues more, and so on. Basically, it’s an interest you earn on interest.

On the opposite end, there’s simple interest. This type of interest represents financial gains an investor earns just on the principal portion of the loan or their initial investment. In other words, simple interest is limited to one earning cycle — it leaves out interest earning more interest. 

Compound interest is what happens when money accrues interest, and that interest then accrues more.

Definition of Compound Annual Growth Rate

Compound annual growth rate is defined as the rate of return required for an investment to grow from its starting balance to the ending value. It’s used when profits are reinvested at the end of each period.

With CAGR, investors can compare the present value of two or more stocks, and see which one has performed better over a certain timeframe.

CAGR calculates past performance. Furthermore, the compound annual growth rate isn’t the same as the true rate of return. Instead, CAGR is a metric used to determine how an investment may perform in the future, based on past performance.

Investors use CAGR as an estimate, rather than the exact measurement of the portfolio performance. It’s important to understand that neither CAGR, nor any other performance calculation methods, are any guarantee of future performance.  

Other Growth Metrics to Know

Here are some other metrics investors use to help measure their journey.

  • Year-over-Year (YoY) Growth compares the changes in annualized metrics at the fiscal year-end date.
  • Month-over-Month Growth (MoM) compares the changes in the value of a metric at the end of the current month compared to the past month.
  • Last Twelve Months (LTM) is the timeframe of the immediately preceding 12 months, often used to evaluate a company’s performance.
  • Reinvestment Rate is the expected return that occurs after the reinvestment of the previous gains.

What Is CAGR Used For?

The CAGR is used to calculate an investments’ performance when compounding gains, or interest, are taken into account. It presumes profits or income will be reinvested, and gives a representational figure, which, as you’ll see shortly, has benefits and limitations as far as understanding performance.

CAGR is useful for understanding long-term performance in that it smooths out the effects of volatility. If an investment is up 10% one year and down 5% the next, then up 4% the next year, CAGR shows the long-term trend. 

CAGR presumes profits or income will be reinvested, and gives a representational figure

Benefits and Downsides of CAGR

There are many advantages of using the compound annual growth rate formula:

  • It’s one of the most reliable ways of calculating ROI for compound interest.
  • Helps compare stock performance in different time periods.
  • Can be used for each investment separately.
  • Fixes the limitations of the average return calculation.
  • Works better for short-term calculations.

Some of the CAGR calculation’s limitations:

  • Doesn’t account for investment risks.
  • Implies a constant growth rate, which is not always the case.
  • Can’t be used to measure the profitability of an asset’s inflows and outflows.
  • Ignores market volatility.

CAGR Formula

To calculate CAGR, investors divide the value of the investment at the end of the period of time (EV) by the value of the investment at the beginning of the period (BV).

The next step is to raise the result to an exponent of 1 divided by the number of years (n).

Then, subtract one from the result.

To get the percentage, investors multiply the result by 100.

The complete formula looks like this:

CAGR = (EV / BV) ^ 1/n – 1 x 100

Modification of the CAGR formula

Investors have to modify the CAGR formula to get the correct data on their investments.

They need to know how long they’ve been holding a particular asset. To get this number, investors calculate how many days they held an asset for the beginning and the end of the period, then take into account all the other “complete” years, shown in days.

For example, someone held the investment for 300 days during the first year, plus three years (equals 1,095 days), then exited the position after 200 days in the last year. Their total holding period is 300 + 1,095 + 200 = 1,595 days.

To get the years, divide by 365, which makes 4.369.

They can then use this number in the CAGR formula, where n = 4.369

CAGR Calculated via Excel Spreadsheet

Some investors like to track their stock performance via an Excel spreadsheet. It’s possible, but not as easy — Excel requires that they use “RATE” (used for calculating the rate of return), and the “COUNTA” function (counts the number of years) to get the desired value.

However, there’s an easier way to calculate compound annual growth rate, using the CAGR calculator online.

CAGR Calculator

An online calculator is a simple solution to calculate an investment’s compound annual growth rate. Online calculators are straightforward, and investors get results immediately.

But, if you don’t want to deal with any calculations, Navexa is here to help.

Navexa: Automatic CAGR Calculations

Sometimes, calculating CAGR requires collecting a lot of data from your portfolio. The Navexa portfolio tracking platform can calculate investment performance using multiple formulas. Just upload your portfolio, and Navexa will do all the work for you.

Once you finish uploading your holdings, you can toggle between “Simple” and “Compound” and the platform will provide you with detailed performance metrics.

With Navexa, there’s no need to question whether the CAGR calculator is correct. You’ll get the data instantly within the app, so you know how your portfolio performs.

Example of CAGR Formula

If you’re still struggling to understand how compound annual growth rate works when using a formula, here’s an example.

Let’s say a company has a revenue of $100 million at the end of year 0.

Three years from then, the company is projected to reach a revenue of $150 million.

To start calculating, you should ignore the initial year (year 0), as the formula only takes into account the compounded revenue. To get the initial balance, subtract the beginning period (year 0) from the ending period (year 3).

Proceed to enter the following data into the compound annual growth rate formula:

Beginning Value = $100 million

Ending Value = $150 million

Number of Periods = 3 years

In this case, the annual growth rate CAGR formula looks like this:

CAGR = (150 million / 100 million) ^ 1/3 – 1 x 100

Based on this example, the compound annual growth rate is 14.47 %

CAGR vs. IRR

CAGR shows the return of an investment over a specific time period. However, there’s one more calculation you should know about — the Internal Rate of Return (IRR).

IRR also measures growth rate and performance, but in a more flexible way compared to CAGR.

One of the key differences between CAGR and IRR is that CAGR is used for simple calculations. Additionally, investors can calculate CAGR by hand, or with a CAGR calculator.

IRR, is used to show the growth rate of complex investments. IRR is used with portfolios with various cash inflows and outflows. If you want to measure IRR, you’ll likely need a powerful calculator or an accounting system.

IRR is often used for an investment that can’t be managed with a CAGR calculation.

CAGR shows the return of an investment over a specific time period. IRR also measures growth rate and performance, but in a more flexible way compared to CAGR.

CAGR vs. AAGR

Average Annual Growth Rate (AAGR) is another performance calculation. While CAGR accounts for the compound annual growth rate, AAGR doesn’t. Instead, it’s a linear measure that shows the average annual return.

What is Risk-Adjusted CAGR?

The risk-adjusted formula helps the investor determine whether a certain investment is worth the risk. With this method, investors measure and compare the generated returns and risks. This gives them an idea of the potential ending value of their portfolio.

Risk-adjusted CAGR requires a bit more calculation, and is more advanced. This is because it takes into account the standard deviation figure — a measure of volatility, which is different for every asset.

Calculating risk-adjusted CAGR is done by multiplying the CAGR by 1 and subtracting the standard deviation. In case the volatility number is 0, CAGR remains the same. However, with a higher standard deviation, CAGR gets lower.

This formula helps investors compare multiple investments and decide which one can provide the highest likelihood of returns for the desired time period. Again, no calculation method is ever going to protect against investment risk or predict future performance reliably. 

How Investors Use CAGR

There are many ways to use CAGR in investing. The first is to determine the rate of return and likely future value of an investment. 

Additionally, CAGR helps investors set objectives and calculate the rate they need to successfully grow their investment. This is especially true for risk-adjusted CAGR. This formula includes the risks related to a specific investment, which helps determine future growth rates.

The CAGR formula is also an ideal way of comparing multiple investment opportunities. Using it to forecast future value helps investors make strategic decisions.

The Importance of CAGR for Companies

Investors aren’t the only ones calculating growth rates and dealing with CAGR. Business owners and CEOs also utilize CAGR to determine company performance.

Finally, CAGR is crucial for companies that plan to give out dividends to shareholders, as it shows the company’s (positive or negative) performance between two different years.

What is Considered Good CAGR?

Generally speaking, a CAGR of 15% to 25% for the period of five years would considered a good compound annual growth rate for stocks and mutual funds.

However, if the CAGR were lower than 12% for stocks and mutual funds, investors might gravitate towards other opportunities, such as real estate or other securities.

See Your CAGR & Simple Returns in Navexa

Compound annual growth rate (CAGR) is one of the methods investors measure the performance of their holdings. The formula is fairly simple, but it doesn’t account for market volatility and investment risks, unless you use a risk-adjusted one.

The CAGR formula can only be used for compounding investments.  Compound annual growth rate is different from AAGR, which simply shows the average change for one year. Many investors prefer CAGR since it smoothes out the year-by-year volatility in growth rates.

Among many other features, Navexa also offers CAGR calculations based on uploaded portfolio data. Simply toggle between ‘Simple’ and ‘Compound’ to get accurate data instantly. To check out how it works, register today and start your free trial.

Categories
Financial Literacy Investing

How To Calculate Time-Weighted Return

Time-weighted return is one of the most popular ways of measuring investment performance and calculating returns. We explain how to calculate TWR and explore other key methods of tracking portfolio performance.

It can be challenging for investors to find the best method of measuring portfolio performance and investment returns. The time-weighted return is on of the most common ways of doing so.

Besides a simple rate of return, there’s the time-weighted return (TWR) method. It’s among the most common formulas used to track investment performance. In short, it accounts for moments when cash flows occur, and creates sub-periods to help investors track growth rates.

Keep reading to learn how bankers, investment professionals, and portfolio managers use a time-weighted rate of return to evaluate investment performance.

Impact of Inflows and Outflows of a Portfolio

Cash flows are vital to time-weighted returns

Before diving into the time-weighted return, it’s crucial to understand cash flows. Cash flows are an important part of calculating portfolio performance. They also make a difference in which method experts use, because each performance calculation treats inflows and outflows differently.

Cash flows, or inflows and outflows, represent the total money transferred into and out of one’s portfolio — deposits and withdrawals. The example of inflows includes proceeds from the selling the asset. Outflows can be payments for buying a stock.

Cash flows can be used to define a sub-period, and the method that will be used to calculate the rate of return — the money-weighted rate of return, or time-weighted rate of return formulas.

If someone invested money and never made any withdrawals from their portfolio, calculating the rate of return on their investments would be easy. Any method would give the same result, since there were no outflows and inflows to observe across the sub-periods.

Still, this rarely happens in practice, and cash flows are always present. Investors may make changes in their portfolios daily, and calculating the weighted rate of return can be challenging. Since each method (TWR, RoR, MWRR) handles these cash flows differently, each will give a different performance number.

Here’s what you should know about the time-weighted return.

What Is the Time-Weighted Return?

Time-weighted returns are one measure of compound growth.

Time-weighted return (TWR) is a method of measuring the compound growth rate of one’s portfolio. This method is designed to help investors eliminate the distorting effects of deposits and withdrawals.

TWR breaks up the investment performance into sub-periods, based on the moment when the money was added to, or taken out of, the account. Then, it provides the rate of return for each interval with cash flow changes.

Is Time-Weighted Return Correct?

By isolating the intervals based on these inflows and outflows, TWR provides more accurate numbers than simply subtracting the beginning balance from the final value of the portfolio.

Additionally, the time-weighted rate of return formula multiplies the returns for each sub-period, links them together, and shows how the returns have compounded.

The time-weighted rate assumes all gains are reinvested in the portfolio.

This method is also more commonly used by fund managers, or bankers, and not private investors. This is because fund managers usually don’t have control over cash flows, but still need some way to calculate portfolio performance and returns for their clients.

Can Time-Weighted Return Be Used to Compare Investments?

Some experts argue that TWR shouldn’t be used to compare investment performance, and that the money-weighted rate of return formula (equal to IRR) is a better measurement for comparison. This is mainly due to the complexity of its formula, which is not ideal for regular investors.

However, TWR remains preferred among fund managers and finance experts who don’t have control on the cash flows in the portfolios they manage.

Time-Weighted vs. Basic Rate of Return

The rate of return is one of the simplest ways of calculating the rate of return over a certain period. RoR is shown in percentage and represents the change from the beginning of the holding period until the end.

RoR is not always an accurate measurement, since it doesn’t account for cash flows. However, the time-weighted return calculation is there to eliminate the effect of cash flows, and create intervals based on when the money was added or withdrawn from one’s portfolio.

By isolating each time period, TWR provides more accurate results. In practice, the sub-periods between cash flow events are treated as constituent performance units, which are then combined to give the total performance for the overarching period. 

However, there’s another method to compare it with.

Time-Weighted vs. Money-Weighted Rate of Return

Money-weighted rate of return accounts for timing and size of a portfolio’s cash outflows.

Money-weighted rate of return (MWRR), which is equal to an internal rate of return (IRR) is another performance measurement method.

While the time-weighted method factors in the moment of change, creates the period for each change, and calculates period return, MWRR accounts for both the timing and sizes of cash outflows, such as:

  • The cost of a purchased investment
  • Withdrawals
  • Reinvested dividends

It also accounts for inflows:

  • Received dividends
  • Deposits
  • Sale proceeds
  • Contributions

The key difference between TWR and MWRR is that MWRR doesn’t create time periods based on cash flows like the TWRR. This means that any cash flow within a time period can impact MWRR. If there’s no cash flow, both methods should provide similar results.

 Money-weighted rate of return is a more complicated, but more accurate measurement of investment performance. This is also the most appropriate way to measure the return on investment.

The Importance of the Time-Weighted Return

Since the time-weighted return is based on cash flow, but used to calculate the period return for each interval, it’s usually used as a reflection of the investment strategy. Investors find it’s easier to calculate returns once the performance is broken down into sub-periods.

The TWR method helps them further isolate cash flows for each period and gain more accurate results. Plus, the TWR multiplies each sub-period, and shows how the returns compound over time.

This performance method is crucial for investment managers, since they don’t have control over cash flows in the portfolios they manage.

What Does the Time-Weighted Return Tell?

Since TWR is used to generate sub-periods and link them, it’s one of the best methods to see how the returns compound over time. When calculated correctly, TWR also shows the results of an investment strategy. It strips the impact of cash flows, and reveals pure investment performance.

How to Calculate Time-Weighted Return

Investors and fund managers who calculate time-weighted return start by calculating the rate of return for each sub-period. This is done by subtracting the ending balance from the initial value.

Then, they divide that difference by the initial value of the holding period.

The key is to create a new sub-period for each cash flow, and calculate the RoR for each of these.

Investors then add “1” to each of the return amounts. This simplifies the calculation of negative return numbers, and assures the formula works correctly.

Then, they multiply the rates of return for each sub-period, and subtract “1” to yield the time-weighted return.

TWR Formula

TWR = ((1+HP1) x (1+HP2) x (1+HPn)) – 1

TWR = Time-Weighted Return

HP = (End Value – (Beginning Value + Cash Flow)) / (Beginning Value + Cash Flow)

n = Number of Periods

HPn = Return for sub-period n

In addition to the basic TWR formula, two other calculations can clarify the portfolio performance — Simple and Modified Dietz methods.

Simple Dietz method

Since TWR doesn’t account for cash flows that likely occur during the holding period, the Simple Dietz method can be used to address this. This method assumes that cash flows occurred either at the beginning, middle, or the end of the measured periods (day, month, or year).

It compensates for external cash flows. The formula is:

R = B – A – C / A + C/2

R = rate of return,

A = beginning market value

B = ending market value

C = net external inflow during the period

Modified Dietz Method

The Modified Dietz Method is the most common way of calculating time-weighted returns.

There’s also the Modified Dietz method, which adjusts for cash flows daily. This method fits the Global Investment Performance Standards (GIPS).

The Modified Dietz method is also the most common way of calculating TWR. However, it’s not perfect, and may skew the results in certain circumstances.

Issues with timing

One of the main issues with calculating portfolio performance is the assumption that all transactions happen at the same time within each sub-period. If the sub-period is one day, we calculate the data as if all transactions happen at the beginning and end of the day.

This can lead to errors, as sometimes the change in the portfolio is equal to zero and we can’t apply some formulas. In such cases, experts would have to further adjust the Modified Dietz method for better results.

Issues with negative or zero capital

The average capital is usually positive. However, if a larger outflow occurs, the average capital could go to zero or become negative. This can cause the Modified Dietz calculations to show a negative balance when there’s an actual profit, and vice versa.

One of the solutions is to catch a moment when the outflow happens, account for it, and use the simple returns calculation for specific period returns.

Excel Sheet

Some fund managers like to use Excel to calculate the time-weighted return. They either download an existing template, or use formulas in the sheet.

Others create their own Excel sheet. They enter the portfolio data manually, starting with the beginning and ending values for each period. Then, they calculate the return for each of the sub-period.

To get to the TWR, experts should add 1 to each of the results (to mitigate the negative returns), use the geometric mean function, and finally subtract one at the end. Excel can then turn it into a percentage form.

Automatically Calculating TWR With The Navexa Portfolio Tracker

If you’re looking for an easier way to get the accurate time-weighted return, the Navexa portfolio tracker uses a version of the Modified Dietz method. Our performance calculation accounts for the performance of assets, and the size, and frequency of cash flows for each sub-period.

This provides a clear idea actual investment performance. Simply upload the portfolio data you need to track, and Navexa will calculate the returns. Plus, the tracker will also annualize the numbers for an easier overview.

Navexa does so using live market data from the ASX, NASDAQ, NYSE and global cryptocurrency markets, displaying intra-day pricing and performance. 

Advantages of the Time-Weighted Return

There are several advantages to the time-weighted return method. It:

  • Is a solid indicator of investment performance,
  • Eliminates the impact of cash flow,
  • Provides a clear picture of returns after each deposit/withdrawal,
  • Is suitable for measuring investment managers’ performance,
  • Links periodic returns.

Disadvantages of the Time-Weighted Return

Due to the complex nature of investing, TWR still has some disadvantages. This calculation can turn out to be challenging when the money moves in and out of the portfolio more often. The common changes may skew the final number, and provide less accurate results.

Additionally, the TWR doesn’t measure how long the money has been invested, or when it was invested. This is why some investors may prefer IRR instead.

TWR is often used to track performance month over month. However, using the TWR is tricky if there’s an increased cash flow occurring within each month or day.

Examples of Using the Time-Weighted Return

The best way to understand how the time-weighted rate of return works is through an example. Let’s say that an investor has the portfolio of this value:

  • Dec. 31, 2011 — $100,000
  • Jan. 31, 2012 — $110,000
  • Apr. 30, 2012 — $103,000
  • Nov. 30, 2012 — $120,000
  • Dec 31. 2012 — $135,000

This makes four time periods we should observe:

  • Dec. 31, 2011 to Jan. 31 2012 (HP1)
  • Jan. 31, 2012 to Apr. 30 2012 (HP2)
  • Apr. 30, 2012 to Nov. 30, 2012 (HP3)
  • Nov. 30, 2012 to Dec 31. 2012 (HP4)

Additionally, this person made a $12,000 withdrawal on March 3, 2012 (occurred during HP2) and a $20,000 deposit on December 20, 2012, (HP4).

Now we should calculate the holding period return for each period:

HP1 = 110,000- 100,000 / 100,000 = 0.100

HP2 = 103,000 – 110,000 + 12,000 / 110,000 = 0.0455

HP3 = 120,000 – 103,000 / 103,000 = 0.1650

HP4 = 135,000 – 120,000 – 20,000 / 120,000 = 0.0417

To get to time-weighted rate of return, we should now add 1 to each of the period results and multiply them together, then subtract one:

( (1 + 0.100) x (1 + 0.0455) x (1 + 0.1650) x (1 + 0.0417) ) – 1 = 0.2840

To get a percentage, multiply the result by 100, which equals 28.4%.

The Navexa Portfolio Tracker automatically tracks portfolio performance using the Modified Dietz Method and money-weighted return calculation.

Summary: Time-Weighted Return Calculation

The time-weighted rate of return is a great method of measuring portfolio performance. It’s a preferred method among financial experts, bankers, and fund managers. The TWR formula focuses on time periods when cash flows occurred, and helps experts calculate growth for each period.

Time-weighted return is considered a standard in portfolio management, but still has some flaws. But by adjusting the calculation, fund managers and investors can overcome these issues, and measure growth correctly.

A money-weighted return, on the other hand, measures compound growth in the value of all funds invested in a portfolio over the evaluation period.

Navexa is one of the easiest tools to use for understanding your returns and portfolio performance. Our advanced performance calculation utilizes the Modified Dietz method.

Not only that, but when you track your performance in Navexa, you can examine performance at both the portfolio and individual investment level, and toggle between simple and compound returns in a single click.

Categories
Financial Literacy Investing

The Rule of 72: What Is It, and How You Can Use It In Your Investing?

Using the Rule of 72 is a simple method for getting an approximate idea of how long it takes for your money to double. So how can you use it in tracking your investments?

In a perfect world, investors would like to know, in advance, how long it will take to double their money in the stock market. Knowing exactly how long this will take is helpful in planning out portfolio diversification, and eventually achieving financial freedom.

But, how does one go about working out how long it might take to double the value of a portfolio?. Investors can easily become confused. Especially when it comes to accounts that receive annual interest. Then, they may reach for complex formulae, and spreadsheets. 

But, there’s a simpler, better way of calculating the period it will take to double one’s investment.

One of the best ways is to use the Rule of 72 — one of the simplest methods of calculating when one’s portfolio will double in value.

What is the Rule of 72?

The Rule of 72 refers to the mathematical concept that shows how long it will take an investment to double in value (in theory). It’s a simple formula that anyone can use to determine the approximate time when an investment will double at a given annualized rate of return.

However, the Rule of 72 only works for calculating compounding growth. Investors can use the Rule of 72 only for an account that earns compound interest, not simple interest. Additionally, the Rule of 72 works better with an interest rate ranging from 6% to 10%.

Besides being used to show exponential growth of a portfolio, the Rule of 72 is also used to show exponential decay. For example, the loss of purchasing power caused by inflation, or the drop in the population numbers.

Compound Growth vs. Simple Growth

Interest helps the portfolio growth, and allocating a certain amount of money to an account that earns interest is a smart move investors make. There are two types of growth, or interest — simple and compound, and these are crucial for using the Rule of 72.

Compound interest is added to the already existing interest, plus the principal amount of the loan or deposit.

This type of interest is calculated with the following formula:

A = P (1 + r) (n)

On the other hand, simple interest is added only to the original investment. The formula for simple interest is:

A = P (1 + Rt)

Compound interest is better, as it can reduce the time required to double the money in an account, and grows the investments exponentially.

In other words, compounding interest grows an investment more and more every year, since the interest gets calculated on progressively larger amounts. Whereas simple interest doesn’t compound on itself over time. 

Origins of the Rule of 72

While it may sound surprising, the Rule of 72, and the concept of interest aren’t new ideas. Even ancient civilizations, such as the Mesopotamian, Greek, and Roman, used them in transactions, and basic money management.

While it may not have been called the Rule of 72, it was always around. For example, lenders always wanted to know how to manage their investments, and the rate of return.

Who Came up With the Rule of 72?

The first person to ever take note of the Rule of 72 was Luca Pacioli. Pacioli was an Italian mathematician. He mentioned the Rule of 72 in his book Summa de Arithmetica, Geometria, Proportioni et Proportionalita (Summary of Arithmetic, Geometry, Proportions, and Proportionality), published in 1494.

Pacioli stated that people who wish to know how many years it will take to double their investment should always ‘keep the number 72 in mind.’

Pacioli never went deeper into defining or explaining the reasoning behind 72.

With that in mind, it could have happened that someone else invented the number to improve their calculation of the interest rate, and portfolio growth. Some even say that Albert Einstein was the one to invent the Rule of 72, but that was never confirmed.

Why Is It Called the Rule of 72?

There’s no specific reason this rule is called the Rule of 72. Still, it serves to replace the complex logarithmic calculation that most investors are having trouble dealing with. The exact formula for determining how many years it takes to double your money based on compounding interest, or growth, is:

ln(2) / ln(1 + (interest rate/100))

where “In” represents the natural log value.

Good mathematicians could use this formula to get accurate results by observing return rates, and natural logs. The actual number that’s derived from the formula is 69.3. However, since this number is not easy to work with, people usually replace it with 72, since it’s equally good in showing the approximate number of years necessary to double the investment.

Navexa’s portfolio tracker is even easier to use. Our portfolio tracker automatically calculates every aspect of portfolio performance for shares, cryptocurrency, cash accounts and more. 

How to Use the Formula?

To calculate how long it would take for the investment to double in value, one can use the following formula:

Years to double = 72 / expected rate of return

This method can also be used to calculate the expected rate of return.

Investors should divide 72 with the years to double to get the rate of return on their investment (expected rate of return = 72 / years to double).

This principle handles fractions, or portions of the year. Plus, the resulting rate of return includes compounding interest on the investment.

However, there are a few things to pay attention to:

  • the interest rate should not be a decimal
  • this formula should be applied to an investment that receives annual interest (compounding)
  • the farther the interest rates are from 8%, the less accurate the results would be
  • to calculate lower interest rates, one can drop the number to 71
  • this formula is easily divisible, but not perfectly accurate

Rule of 72 — Variations

Since this principle provides an approximate result, sometimes investors use slight variations, like the Rule of 69, Rule of 70, or Rule of 73.

These numbers are used in the same way, and serve to calculate the years required for the investment to double in value.

Rule of 72 — Examples

Here’s a simple example of using the method to calculate how long it takes for the investment to double:

Let’s say an account earns 4% of annual interest.

dividing 72 by 4 would give the years it takes for the money to double – 18.

When used to show inflation, and other deprecating numbers, the formula is the same.

However, the final result will show the years it will take for the amount to be cut in half.

Since this principle provides an approximate result, sometimes investors use slight variations, like the Rule of 69, Rule of 70, or Rule of 73.

Both novice, and experienced investors could use the Rule of 72 to estimate the doubling time of their holdings. Since the Rule of 72 is easy to use, almost anyone can estimate how long it will take for a certain number to double in value.

Who Uses The Rule of 72?

Since this rule can be used outside of personal finance and investing, it’s also used by other experts who need to estimate how many years it will take for a value to double.

What Is the Rule of 72 Good For?

The Rule of 72 is a good method that can be applied to anything that grows (or decays) exponentially. For example:

  • GDP
  • Inflation
  • Investment compounding interest rate
  • Credit card debt
  • House mortgage
  • Car loan refinancing

How Does the Rule of 72 Work?

By using the Rule of 72, investors can get an approximation of the years it will take for their assets to double in value.

This makes the Rule of 72 one of the key personal finance formulae to understand for investingt. Plus, this rule gives a general idea of how many “doubles” an investor might get during their lifetime, or for a certain period.

Does It Show Accurate Results?

When it comes to the accuracy of this rule, the Rule of 72 provides approximate information about the desired time period.

This formula is a simplification of the more complex logarithmic equation. Investors who wish to get an accurate result would have to do the entire calculation, or use an electronic spreadsheet calculator.

Navexa’s smart portfolio tracker replaces the spreadsheet. It automatically shows portfolio growth, and helps investors get a clear insight into the years it takes to grow their wealth.

What Are the Things the Rule of 72 Can Determine?

As we previously mentioned, this rule is usually used to determine the rate of return on the investment. However, experts in various industries can also apply this principle to anything that is compounding, and this doesn’t necessarily involve money.

For example, a city’s population that grows/decreases by a certain percentage per year can also use the rule to check how long it would take for the population to double, or halve.

Limitations of This Principle

Besides not being completely accurate in showing data, this formula is also mainly applied to compounding interest accounts, not simple interest ones. What’s more, the Rule of 72 works better for lower interest rates, and is less precise as the interest rate increases.

Additionally, this calculation can’t be used to forecast how long it might take to get a double return with decentralized finance and cryptocurrency, due to high market volatility, and sudden changes in prices.

In fact, no calculation can give anyone a 100% accurate prediction of what their investments may or may not do in the future. 

Speculating Future Returns With The Rule Of 72

When people invest, they often want to know how long it will take to double their money. However, predicting the exact number of years can be tricky. 

This is why the Rule of 72 exists. When used correctly, with an investment that involves compound interest,this formula is generally fairly accurate — provided, of course, the annualized rate of return remains consistent.

here are certain limitations investors should be aware of. This mathematical concept works only with accounts that receive compounding annual interest at lower rates. 

The higher the rates go, the less accurate the results will be. 

This principle doesn’t work with simple interest.

On the other hand, investors can slightly change the number, based on their annual interest rate. For example, some may use 69.3, or 73, depending on the percentage of their rate.

The Navexa portfolio tracker and reporting platform is a fast, accurate way to determine your annualized rate of return across shares, ETFs, cryptos, cash accounts and more. We handle all portfolio performance calculations behind the scenes so you can focus on better understanding your portfolio and returns. 

Categories
Financial Literacy Investing

How to Calculate Cash Dividends: A Complete Guide

Managing a complex portfolio and calculating cash dividends might be challenging. Here’s how it can be done with ease with a few formulas — and with the Navexa portfolio tracker.

Most people who consider investing are familiar with owning stocks. Some are also highly interested in receiving a dividend payout. Those who go deeper into researching an investment, might decide on purchasing stocks of companies because that pay cash dividends.

Dividends might help investors maintain a stable portfolio, remain invested in quality companies, and earn a profit, all while holding shares.

However, novice investors may find dividends confusing — especially when it comes to calculating their dividend yield per share. 

The traditional way to calculate dividend per share is using the company’s income statement and similar reports. But, there are other, easier methods, too.

Dividends Explained

Cash dividends are payments companies make to shareholders from their profits.

A dividend is defined as a distribution of a company’s earnings or stocks to a class of its shareholders. Dividend payouts are determined by the board of directors, and shareholders receive them for as long as they hold the stock.

A dividend is a form of reward to shareholders for investing in the organization and for holding the stock. Dividends may also help a stock’s price remain relatively stable.

Some companies offer dividend payments and prefer to keep the shareholders satisfied. Others decide not to pay dividends, instead reinvesting profits back into the company.

Dividends are paid monthly, quarterly, or annually, depending on the company. They’re paid at a scheduled frequency, so investors always know when they’ll receive the profit from holding shares.

Receiving a dividend based is a great way to increase one’s income, but there’s more to it.

Shareholders also pay attention to other factors, such as dividend yield, rates, retention ratio, and other key numbers.

Dividend Rate vs Dividend Yield

The dividend rate is a percentage that shows how much the company pays in dividends annually, relative to its stock price. The dividend rate can be fixed or adjustable, and it’s expressed as a dollar figure.

The dividend rate is calculated with the following formula:

Dividend rate = dividend per share / current price

On the other hand, the dividend yield is expressed as a percentage, and shows the ratio of a company’s annual dividend payout, compared to its share price.

Shareholders can calculate the dividend yield by using the following formula:

Dividend yield = annual dividends per share / current share price x 100

Navexa helps share investors by calculating dividend performance automatically. Navexa’s app is easy to use, and tracks multiple types of investments. This includes tracking and reporting on cryptocurrency investments.

Dividend Payout Ratio vs. Retention Ratio

The dividend payout ratio shows how much of the company’s earnings after tax are paid to the shareholders. It’s in direct relation to the organization’s net income amount, and it’s used to measure the net income percentage.

It’s calculated by the following formula:

Dividend payout ratio = total dividends / net income

On the other hand, the dividend retention ratio represents the percentage of net income that the company keeps to grow the business, instead of paying it out to the shareholders as dividends.

It’s calculated by the following formula:

Retention ratio = retained earnings / net income attributed to stockowners

Calculating Dividends per Share and Earnings per Share

Dividends per share (DPS) is the number of stated dividends paid by companies for each of the shares outstanding. It represents the number of dividends each shareholder receives based on the shares they own.

DPS is often used to calculate dividend yield, and the formula goes as follows:

DPS = total dividends paid over a period – special dividend payout / shares outstanding

On the other hand, earnings per share (EPS) are useful in calculating how profitable the company is based on measuring the net income for each of the company’s outstanding shares. 

EPS is also an important number used to determine share price.

EPS shows whether investing in a certain company and holding its shares would benefit the shareholders and improve their net income.

For example, if the company reports an EPS that’s below a certain estimate, that might cause its share prices to drop.

The formula for calculating earnings per share goes as follows:

EPS = net income – preferred stock dividends / outstanding shares

Types of Dividends

Four types of dividends include cash, stock, property, and liquidating dividend.

There are several types of dividends that a company may pay to the shareholders. These include:

  • Cash dividend
  • Stock dividend
  • Property dividend
  • Liquidating dividend

Cash dividends are the most common. They represent a simple distribution of funds to incentivize shareholders to hold their shares, improve the shareholders’ equity, and increase confidence in the organization.

What Are Cash Dividends?

Cash dividends represent money a company pays to the shareholders per share they own. The money can come from the organizations’ current earnings or accumulated profit. Cash dividends are paid regularly, usually by quarterly or annual payments.

Once the shareholders receive this dividend, they may have the option to accept the cash payment, or reinvest in additional shares (known as a dividend reinvestment plan) and improve their position in the market.

The willingness of the company to pay cash dividends shows a solid financial strength, and positive performance, although that’s not always the case. Sometimes the companies may keep paying dividends, but still be in a poor financial position and eventually shut down.

This is why potential stock owners must be careful when investing and take everything into consideration before they invest in the organization.

Which Company Can Afford to Pay a Cash Dividend Yield?

Many companies have outstanding earnings, and can afford this form of dividend payout. These are just some of the companies that offer dividend payouts across the ASX, NASDAQ and NYSE:

  • IBM
  • AT&T
  • Johson & Johnson
  • QUALCOMM
  • Fortescue Metals Group
  • BHP
  • Magellan Financial Group

More experienced investors can easily determine which company has a solid income statement, and capital, which helps them invest in profitable shares. On the other hand, novice investors may struggle in finding the dividend shares worth investing in.

Potential stock owners must be careful when investing and take everything into consideration before they invest in the organization.

Still, investing in shares that pay these types of dividends can help both new and experienced investors increase capital.

Additionally, those who wish to invest often check out the company’s trailing 12 months (TTM). 

This is a set of performance data that shows how the organization managed finances in the last year. TTM is beneficial for understanding a company’s growth and potential.

Example of a Cash Dividend Payout

Here’s a simple example of a cash dividend:

One investor owns 100 shares of company X. At the end of a quarter, the company X calculates its financial performance for that quarter. 

The board of directors then reviews the information, and decides on a $0.50 dividend per share for the quarter.

This means that the investor is entitled to $0.50 x 100 shares = $50

How Does a Cash Dividend Work?

When a company earns enough, it may decide to distribute part of its earnings to the shareholders. This part of the earnings is most commonly distributed via cash dividends paid in regular intervals, usually quarterly.

While these dividends are a great way of motivating shareholders to stay with the company, they may cause the stock price to drop. Still, investors love companies that offer dividends, as they know they can count on regular payouts.

Why Does a Cash Dividend Matter?

There are many reasons these dividends are important to shareholders. For example, the cash dividends could signal whether the company has good financial health.

It may show that a company is more effective in using its capital, compared to companies that don’t pay dividends.

Dividend payment per stock also increases the chance of shareholders remaining invested in the stock. This means the company’s stock price may stay more stable.

Are Cash Dividends Better Than Stock Dividends?

When it comes to the cash dividend, shareholders have no other option but to either keep it, or reinvest it and increase the number of shares they own.

Even though these dividends are a more common way of paying shareholders, stock ones are sometimes considered better.

When it comes to the cash dividend, shareholders have no other option but to either keep it, or reinvest it and increase the number of shares they own.

With a stock dividend, they can keep the shares or turn them into cash. Plus, stock dividends aren’t treated as taxable, as they’re usually not turned into income.

The Advantages of Cash Dividends

There are many advantages of the dividend payout for shareholders. One of the main advantages is the steady income. These dividend payouts are regular, so shareholders know when they’ll receive the funds.

Regular payouts are especially beneficial for those who build a large portfolio with a view to living on the income.

Receiving dividend payments can also be a good way of establishing a market hedge. This defends the shareholders from the stock price dropping, which often happens during a bear market.

Furthermore, they know that companies that pay dividend yield may be more careful with their financial decisions, as they want to keep people invested in their shares.

The Disadvantages of Cash Dividends

While these types of dividends are common, and can yield great profit for investors, there are certain financial disadvantages for companies.

One of the major disadvantages to paying the dividend is that the money that’s paid to shareowners can’t be used to further develop the business. In a way, paying the dividend prevents the company from investing in increasing sales and profits. Instead, offering a healthy dividend might sustain or even raise the share price — effectively raising capital for the business. 

When it comes to shareholders, dividend payments mean they’ll have taxable income. However, if an investor has an income that’s too low to make them liable for tax, they may be entitled to a refund from the Australian Taxation Office.

Do Cash Dividends Go on the Balance Sheet?

A balance sheet is a financial statement that involves the company’s stock, other assets, liabilities, and shareholder equity. This sheet is also used to evaluate the business.

Dividends do impact the balance sheet, as they will show a decrease in the company’s dividends payable, and financial balance. The balance will be reduced.

To check the total amount of paid dividends, investors should also use a financial statement. This statement shows how much money is entering and leaving the company.

Why Do Shareholders Prefer Cash Dividends?

According to financial theory, investors don’t care much about whether they’ll receive cash or stock dividends, for as long as they have the same value. However, this approach doesn’t include other complexities, such as taxes, transaction costs, dividend payout, demographic attributes of investors, etc.

On the other hand, the theory states that investors would pay additional expenses for receiving cash dividends, and they may prefer them over stock dividends.

Some shareholders would rather pay the taxes and receive cash for their outstanding shares, than receive additional stocks, simply because of direct financial compensation.

Accounting for the Cash Dividend

These forms of dividends are usually accounted for as a reduction of a company’s retained earnings. After the board of directors allows this type of dividend payout, the company debits the retained earnings account, and creates a liability account called ‘dividends payable’.

By moving funds to a dividends payable account, the company reduces equity, which is instantly shown in the company’s balance sheet even though no money has been paid out yet. This, in turn, increases liability.

Once the payment date comes, the company then reverses the dividend payable with a debit entry, and credits the cash account for the cash outflow.

In that way, these forms of dividends don’t actually affect the company’s income statement. Still, all companies that pay these dividends must report the payments in the cash flow statement.

Calculating Cash Dividend

Calculating the dividend payout for the given year is done by subtracting the retained earnings from the beginning of the year from the end-of-the-year numbers.

Based on the complexity of these types of dividends, potential stockholders may struggle in finding the appropriate information they can use to calculate the dividend payout. In general, companies report their dividends in a statement they send together with their accounting summary to their stock owners.

Some organizations share the date in press releases. However, that’s not always the case.

Those who can’t find this data officially, usually consult the company’s balance sheet, which can be found in the annual reports.

Calculating Cash Dividend From a Balance Sheet and Income Statement

If the dividend payout is not explicitly stated in any public document, potential shareholders can look into two things:

  1. Balance sheet
  2. Income statement

The balance sheet is a record of the organization’s assets and liabilities. This document reveals how much the organization has kept in terms of retained earnings. Retained earnings are all earnings of the company that weren’t paid out as dividends.

The second document, which can be found in the annual report, measures the organization’s financial performance for a certain time period. The income statement shows how much net income a company had during a certain year.

This document helps determine what changes would occur in retained earnings if the organization had decided not to offer a dividend payout for that time period.

Calculating the dividend payout for the given year is done by subtracting the retained earnings from the beginning of the year from the end-of-the-year numbers.

This will give the net change in retained earnings, which should then be subtracted from the net income for the year.

The final number shows the total amount of dividends paid during the stated period.

Cash Dividend Per Share Formula

Those who wish to do their own accounting can easily calculate the earnings they receive from per-share dividend yield. After purchasing a stock that pays dividends per share, the shareholder would usually get quarterly dividend checks.

To find the dividend payment per share, the quarterly dividend payout should be divided by the number of shares.

To get annual numbers, the shareholder can multiply the quarterly dividend yield by four.

However, with Navexa, there’s no need to use complicated formulas to calculate the growth of a portfolio. 

Navexa is a smart portfolio tracker that manages accounting for its users. Our app makes investing simple, as it automatically calculates portfolio changes.

Navexa tracks and records every dividend payment — cash and reinvested — in a portfolio and provides insights into which holdings are earning the most and least in a given period. 

Plus, Navexa can annualize portfolio performance, and automate portfolio income tax reporting.

the Navexa portfolio tracker
The Navexa Portfolio Tracker allows you to track dividends alongside capital gains, trading fees & more.

Final Word On Calculating Cash Dividends

Owning dividend-paying stocks is an attractive proposition and a key part of many investors’ long-term wealth building strategies.

But while earning income from an investing is good, it’s vital that investors keep track of their dividend performance — whether that’s from cash dividends or reinvested dividends. 

This is important not just to understand and analyze how much a portfolio is generating in income (and how much that income contributes to overall performance), but because investment income is taxable.

Tax reporting requirements require that investors provide full details of their investment income.

That’s why we’ve built the Navexa portfolio tracker’s automated taxable income calculator. The tool calculates every last cent worth of income an investor needs to report for a given tax year, including details on franking credits (for Australian investors). 

It’s part of our mission to empower investors to build brighter financial futures with simple, but powerful, automated investment analytics and reporting tools.