September 23, 2024
Three trends, one quarter
Dear Reader,
Three financial phenomena are colliding.
In the final quarter of 2024, we’ll find out who’s going to run the United States government for the next four years.
We’ll learn the impact of central bankers jacking up interest rates for the first time since 2020.
And, we’ll enter a period in which stocks historically perform well.
So, what can we expect to happen from here?
The fourth quarter trend
About three quarters of the time since 1945, the S&P 500 has risen in the fourth quarter of any given year.
In 77% of the past 79 years, to be exact.
Meaning the odds are decent that stocks pop between now and year’s end.
The market gained 26.29% total return in 2023, having been down18.11% in 2022.
At the time of writing, the S&P 500 is up 20% year-to-date, having just made new highs.
This historically robust quarter for stocks delivers, on average, a 3.8% gain.
These three strong months tend to follow the toughest month of the year:
But, of course, this is market performance in isolation.
And the market, as we know, is a measure for many things — not just what people are prepared to buy and sell stocks for.
Mark Hackett, chief of investment research for Nationwide Mutual Insurance, explains the factors feeding into this particular fourth quarter:
‘We anticipate continued volatility through November as investors await greater clarity on Fed policy, macroeconomic trends, and, of course, the upcoming election. However, our outlook for the end of the year remains positive. We expect a strong fourth quarter, driven by seasonal tailwinds, diminished election uncertainty, and Fed [rate cuts].’
The ‘seasonal tailwind’ he’s talking about is the market’s historical tendency to rise in Q4, most of the time.
Just to be clear, most of the time does not mean all of the time.
A 77% chance stocks go up is just another way to say a 23% chance they go down.
The past gives us perspective, but it doesn’t predict the future.
As for the election and the Fed, well, let’s take a look.
The election year trend
On November 5, the world will know who’s going to be running the United States for the next four years.
Who wins the election will, no doubt, have an impact on the stock market.
But exactly what impact?
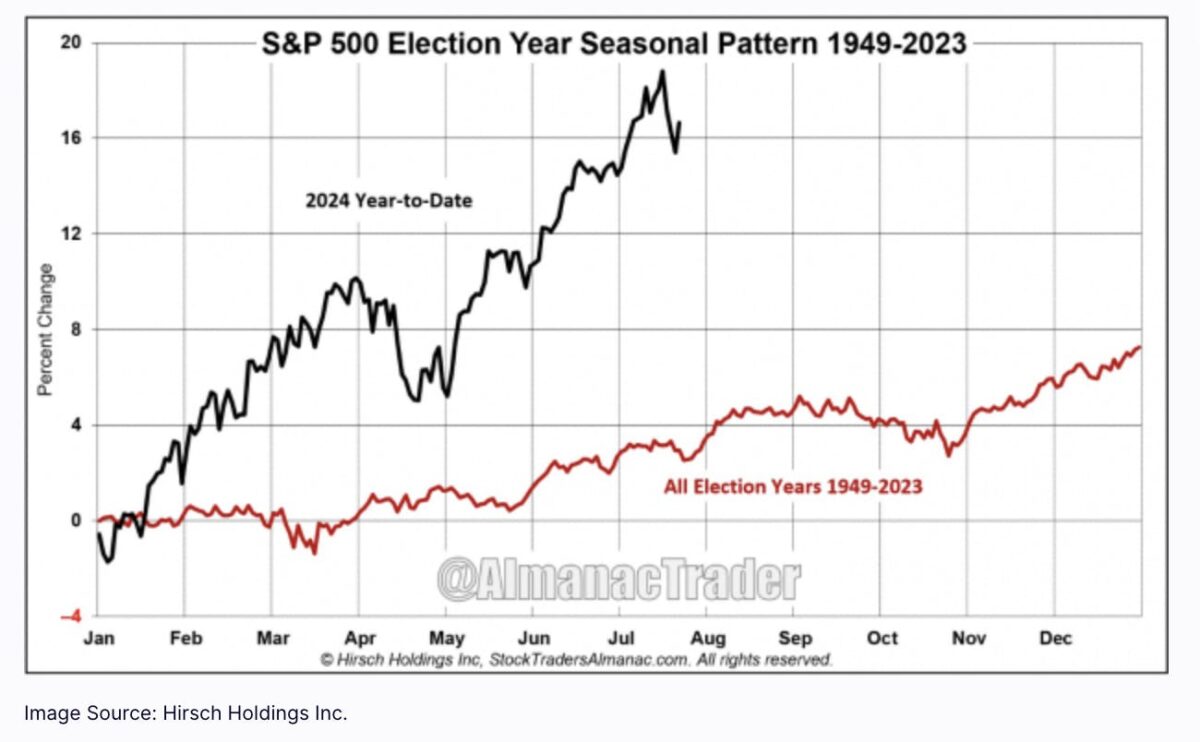
Take a look at the chart below.
It’s the S&P 500 up until a couple of months ago, compared to the average of every election year performance from 1949 to 2023.
The market is already trading way higher than your average election year.
Maybe the Q4 trend and the Fed’s anticipated rate cut is going to drive those lines apart even more.
But back to who runs the most important economy on the planet.
If I asked you which candidate was going to be better for the financial markets, you might say Trump.
I would have, until I found this from the WSJ:
The Dow Jones Industrial Average has risen at an annualized rate of 8.2% under Democratic presidents.
For Republican presidents? Just 3.2%.
Adjust for inflation, and those numbers come to 3.7% and 1.4%, respectively.
Source
Democrat presidents, on average, are more than twice as good for stocks than Republicans.
Of course, correlation does not imply causation.
But with the Democratic candidate polling higher, at the time of writing, than the Republican, could that imply another tailwind for stocks going into Q4?
Fed makes hotly-anticipated interest rate cut
Last week, the Federal Reserve cut interest rates by half a percentage point.
It’s now 4.875%. The Fed states they want to get that down to about 2.9%.
While it’s not a simple case of inverse correlation, we can say that, generally speaking, stocks go up when interest rates go down.
There are exceptions, of course, but generally this is the case.
The initial reaction was no exception.
The real question, beyond the initial market reaction, is how the expected trend of continued rate cuts will impact the stock market and economy.
(The economy, historically, takes longer to respond to interest rates than the markets, which can price in sentiment about the future pretty much instantly.)
Some expect the market to soar from here.
Source
Only time will tell if this rate cut marks the resuming of what some believe is a secular bull market, or will merely apply a weak handbrake to what others believe is an inevitable recession.
But for the quarter ahead, the stage would appear set for a historically strong final three months of the year.
How to check an investment strategy is working
Navarre’s latest video walks you through how to make sure your investment strategy is working using the Navexa Portfolio Tracker.
Check it out now:
That’s it for The Benchmark this week.
Forward this to someone who’d enjoy it.
If one of our dear readers forwarded this to you, welcome.
Invest in knowledge,
Thom
Editor, The Benchmark
Unsubscribe · Preferences
All information contained in The Benchmark and on navexa.io is for education and informational purposes only. It is not intended as a substitute for professional financial or tax advice. The Benchmark and any contributors to The Benchmark are not financial professionals, and are not aware of your personal financial circumstances.
