Pen and paper. Then a spreadsheet. Now digital apps. You no longer need to do napkin maths to figure out how your investments are doing thanks to automated portfolio trackers like Yahoo Finance and Navexa (that’s us!).
Portfolio trackers consolidate disparate data about holdings, kept in different accounts (stocks, bonds, mutual funds, crypto, etc) and provide real-time analytics about your assets’ performance. So that you can know how much you’re earning each day and stay on track with your financial goals.
But a modern portfolio management tool does more than suggest when to buy or sell. The best-in-class apps also provide a snapshot of your investment returns, which include annualized capital gains, dividend payouts, and brokerage fees. With this data, you can proactively adjust your stakes in different asset classes and minimize risk exposure.
In this post, we compare Yahoo Finance and Navexa — two popular trackers, used by Australian and global investors alike.
Yahoo Finance
Yahoo Finance is best known as the go-to financial data hub for quantitative and qualitative research on new stocks, mutual funds, or alternative investment funds. But Yahoo also offers a simple portfolio tracker, which allows you to monitor the assets’ performance in real time via a spreadsheet-like online dashboard.
Main features:
- Real-time data on financial market performance (including crypto)
- Ample fundamental market data for technical analysis
- Custom alerts for tracked assets and asset classes
Navexa
Navexa is an investment portfolio tracking app with tax reporting features. Connect your online brokerage accounts to track all your investments from one dashboard. Improve your asset allocation with real-time reports on asset performance, capital gain returns, and dividend income.
Main features:
- Convenient portfolio performance analytics dashboards
- Integrated tax calculators for CGT, trust, and foreign-sourced income
- Reports inclusive of dividends, currency fluctuations, and brokerage fees
Features and Functionality
For this review of portfolio management software, we’ve set up test accounts on Yahoo Finance and Navexa to assess the main features from a new user perspective.
Both apps promise to facilitate portfolio monitoring. But the scope of offered functionality differs a lot.
Investment Portfolio Tracking
Yahoo Finance offers two portfolio tracking options:
- Basic, which supports only Buy transactions and doesn’t support cash management or Lot trades.
- Portfolio 2.0, which supports other transaction types (Buy, Sell, Short, Buy to Cover Transactions), plus cash accounts, lots, and dividend management.
Disclaimer: At the moment of writing, Portfolio 2.0. functionality was still in beta and the dividend feature didn’t work properly during tests.
Yahoo Finance allows adding multiple investment portfolios to one account. For each, you get a separate dashboard view. That’s convenient if you’re just selecting stocks or private equity funds and want to model different asset allocation scenarios.
Once you’ve listed your holdings (manually or by linking a brokerage account), the main account dashboard comes to life:
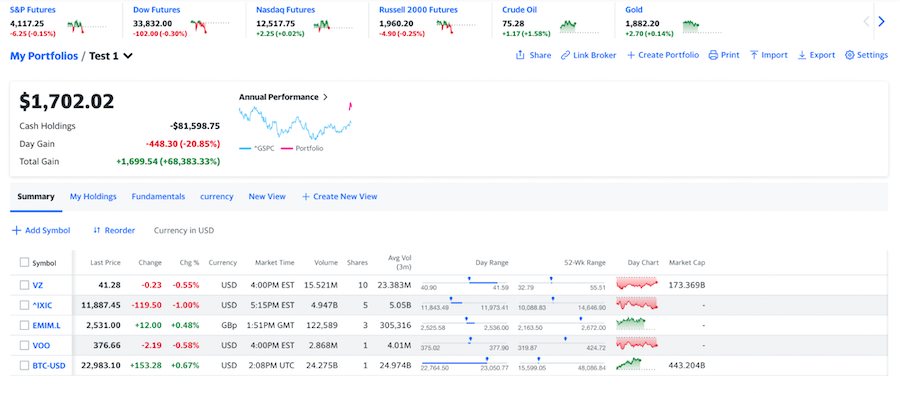
All investment data is updated in real-time, while the markets are open. You can monitor metrics like last sell price, price changes, trading volumes, and day/week price ranges. It’s especially convenient for investors who want to trade actively during market hours.
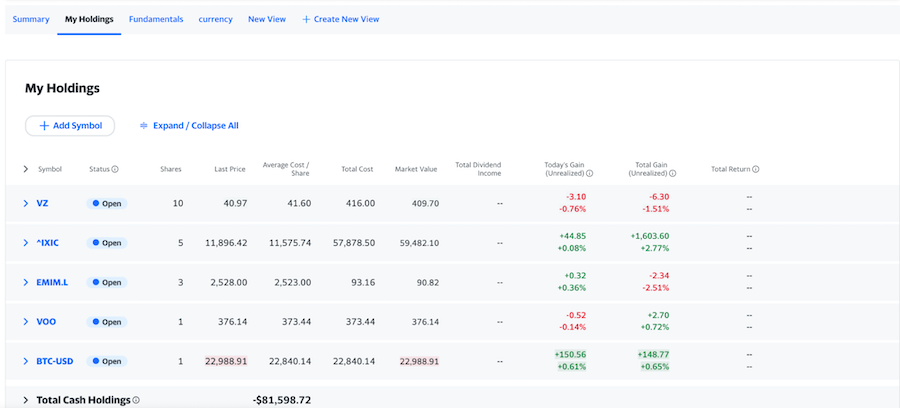
My Holdings tab provides extra per asset data. Here you can also record all buy/sell transactions.
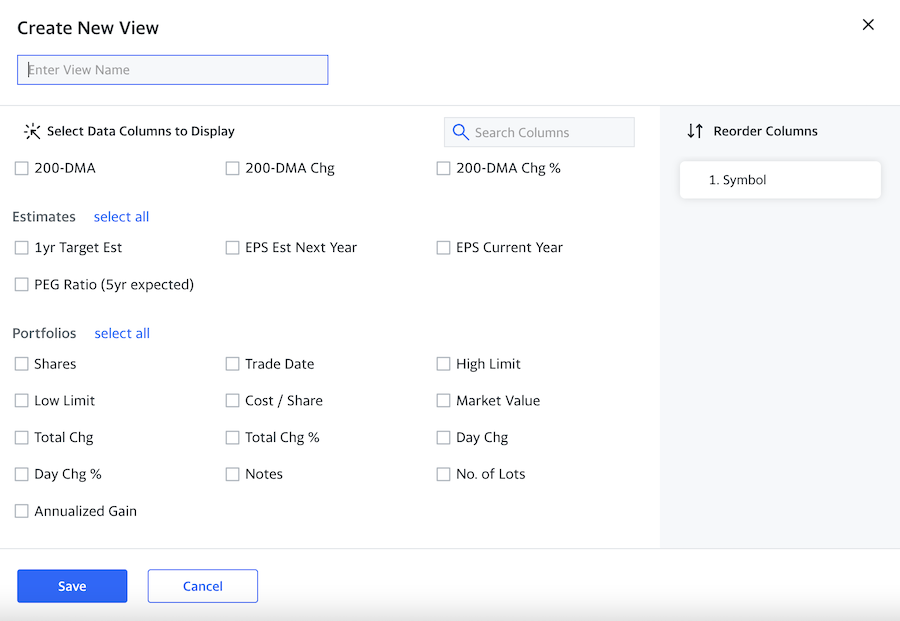
You can also create a custom portfolio view, based on the supported metrics. These include basics like currency, volume, day rate; technical data (e.g. market cap, Price/Book, forward annual dividend rate, etc); and portfolio items like daily change, annualized gains, trade dates, etc).
Most metrics are geared towards hedge fund administrators who need to know how the markets are hailing day or night. But passive investors may find Yahoo Finance dashboards overwhelming.
The definite advantage of Yahoo Finance is its global market data. The platform tracks all major stocks, ETFs, mutual funds, indices, futures, and crypto assets. That’s why it’s a go-to tool for leading financial institutions.
The downside, however, is how Yahoo Finance reports on portfolio performance.
You don’t get to see your current portfolio value. Instead, you can only monitor your daily gains and all-time gains (which don’t include information on dividends, brokerage fees, or foreign currency fluctuations).
Soundly, you have Navexa as an alternative portfolio tracker.
Our share portfolio management software supports just as many asset classes as Yahoo Finance but delivers more accessible portfolio performance reports. The main report provides a birds-eye view of key portfolio stats: Current value, capital gains, income returns, and currency gains.
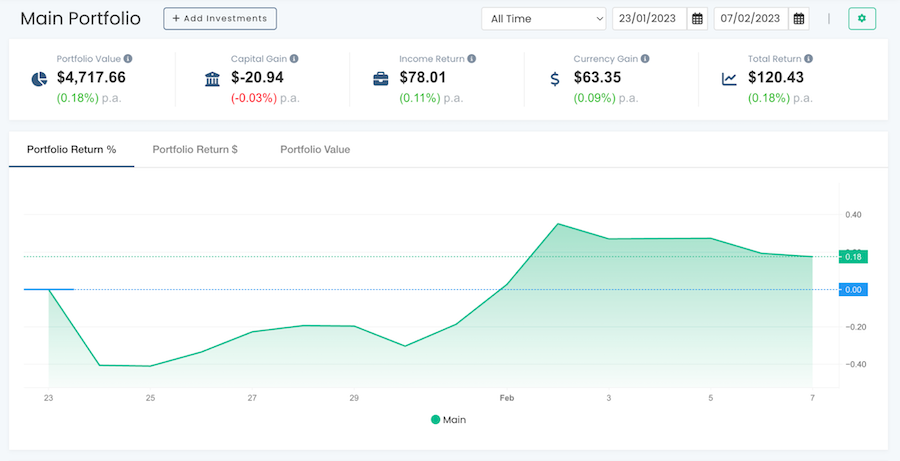
You can also host multiple portfolios with Navexa and view them independently. Or create portfolio groups. This feature helps manage complex portfolios with different asset classes more efficiently.
Unlike Yahoo Finance, Navexa provides portfolio performance data for any custom range — last week, three months, one year, or between June 15 and June 18th. At any time, you can zoom back in time to understand how your assets performed then versus now.
Similar to Yahoo Finance, Navexa also provides a per asset summary view featuring sale dates, current prices, and total returns.
Portfolio Performance Reporting
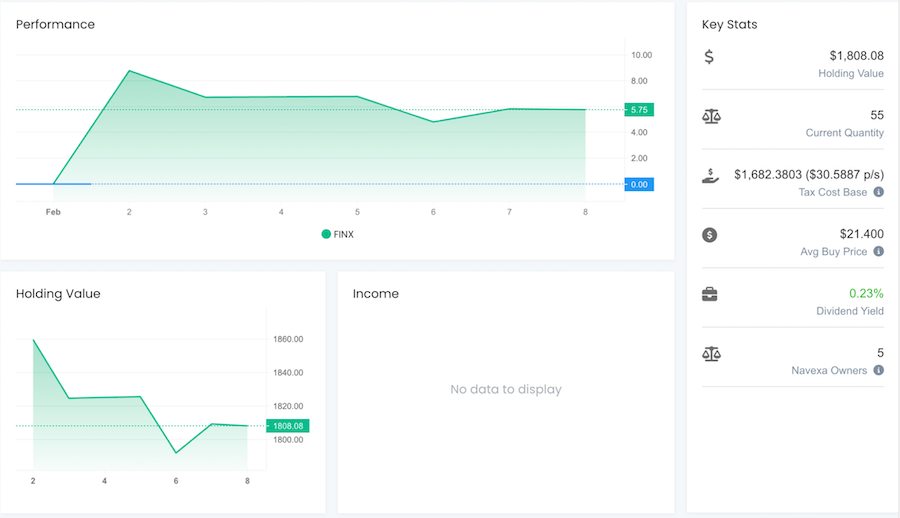
Navexa stock portfolio organizer presents all key metrics at glance: Total portfolio value, capital gains, income returns, currency gains, and total return. You can also monitor your portfolio growth trends in percentage or dollar-based equivalent.

To understand how you’re doing compared to the market, you can benchmark your investment portfolio against popular indices like SPDR 200 Fund, FTSE 100, or S&P 500.
Unlike Yahoo Finance, Navexa also reports on dividends (and factors them when calculating your portfolio returns). You get a heads-up on the upcoming dividends payouts, based on the data released by issuing companies. So that you could proactively manage your dividend income.
Compared to Navexa, Yahoo Finance’s reporting features are less robust. You get three key numbers: Cash holdings, Day Gain, and Total Gain. The tiny chart on the right also shows your annual portfolio performance against the S&P 500 index (^GSPC). But there’s no way to get a full-screen view of it.

You also get a day performance chart for each tracked asset (which can be enlarged). But…that’s all the portfolio performance reporting Yahoo Finance provides on a free plan. You can get access to extra technical charts with 100+ tracked metrics and the ability to overlay stocks on a Yahoo Finance Plus Plan only.
Stock Alerts
You can set up custom stock alerts with Yahoo Finance mobile app (Android & iOS). Alerts are useful if you want to quickly respond to price dips or increases. The setup process is easy and alerts arrive almost instantly.
Navexa doesn’t support real-time stock alerts yet. But we’re working on this feature!
Brokerage Account Integration
Yahoo Finance integrates with online brokerage accounts from US banks and several popular online trading platforms like eToro and Interactive Brokers.
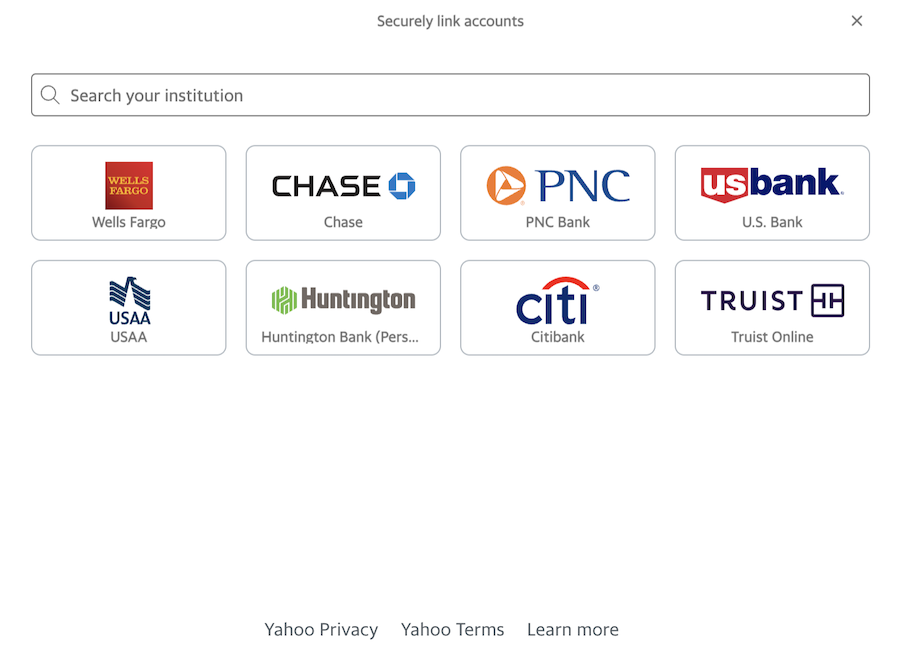
But international and global investors would be more disappointed as their financial institution is likely not supported. No popular Australian brokers integrate with Yahoo Finance.
With Navexa you can auto-import data on historical trades from 10 brokers (CommSec, CMC Markets, ANZ Share Investing, etc). You can also auto-sync trading data from 14 brokers. Alternatively, you can upload a custom spreadsheet to add all your investments to a Navexa account. Yahoo Finance also allows data imports as CSV files.
Both portfolio trading wizards also allow manual data entries. Also, you can link up a cash account.
Tax Reporting
Yahoo Finance offers no help with tax reporting. You can export your portfolio dashboard as a CSV file and calculate capital gains yourself. Or share the numbers with your accountant.
Navexa gets Australian investors all set for tax time. You can generate capital gains tax reports (CGRT) at any time or get a tax estimate on your portfolio’s income in a given financial year. To optimize your end-of-year bill, you can also model different tax scenarios using strategies like FIFO, LIFO, maximize/minimize gain, etc.
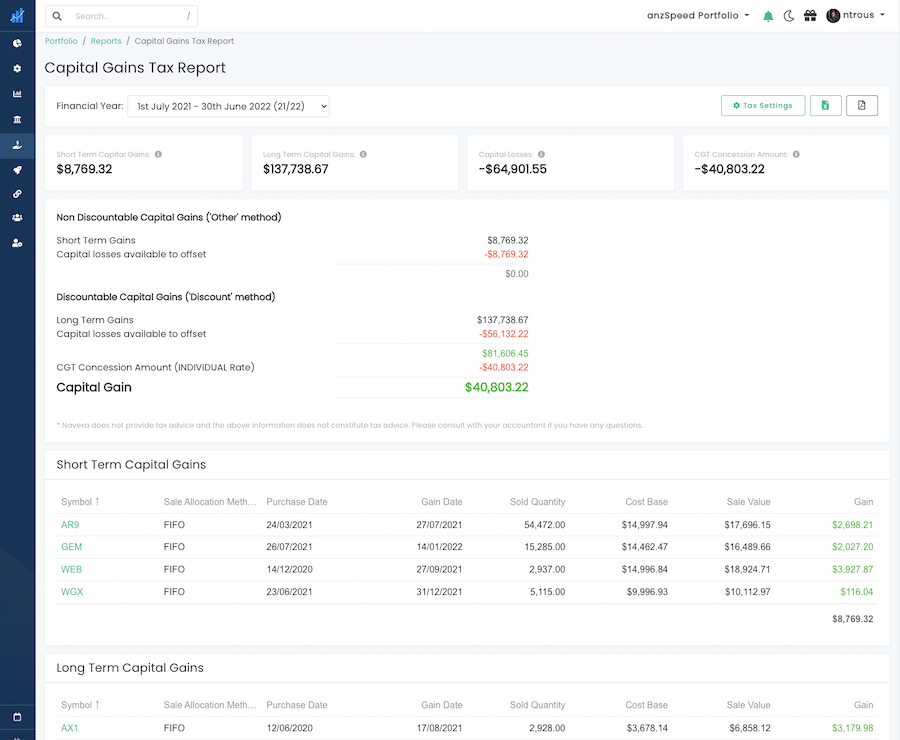
Our tax reports factor in trust income, franked distributions and foreign-sourced income (e.g. dividend payouts from a US company). In just a few clicks, you get a full breakdown of your tax obligations per each held asset. By modelling your numbers in advance, you can better divvy up your sales to avoid getting pressed with a humongous bill.

Overall User Experience
Yahoo Finance stock portfolio tracker errs on the side of simplicity. You have a no-frills spreadsheet-like dashboard, a couple of simple graphs, and custom indicators for creating technical reports.
Navexa offers a more comprehensive portfolio management system with extra reporting dimensions and financial calculations. Our reports factor in currency fluctuations, dividend payouts, and all incurred trading fees. Yahoo Finance allows listing brokerage fees manually but doesn’t account for currency volatility.
Manually reporting stock transactions is also easier with Navexa. The app auto-suggests the closing price of the share for the selected date, so you don’t have to look that up and suggests the current USD to AUD exchange rate. Yahoo Finance selectively suggests closing prices for some assets (e.g. it pitched a BTC rate, but didn’t suggest anything for a VOO trade).
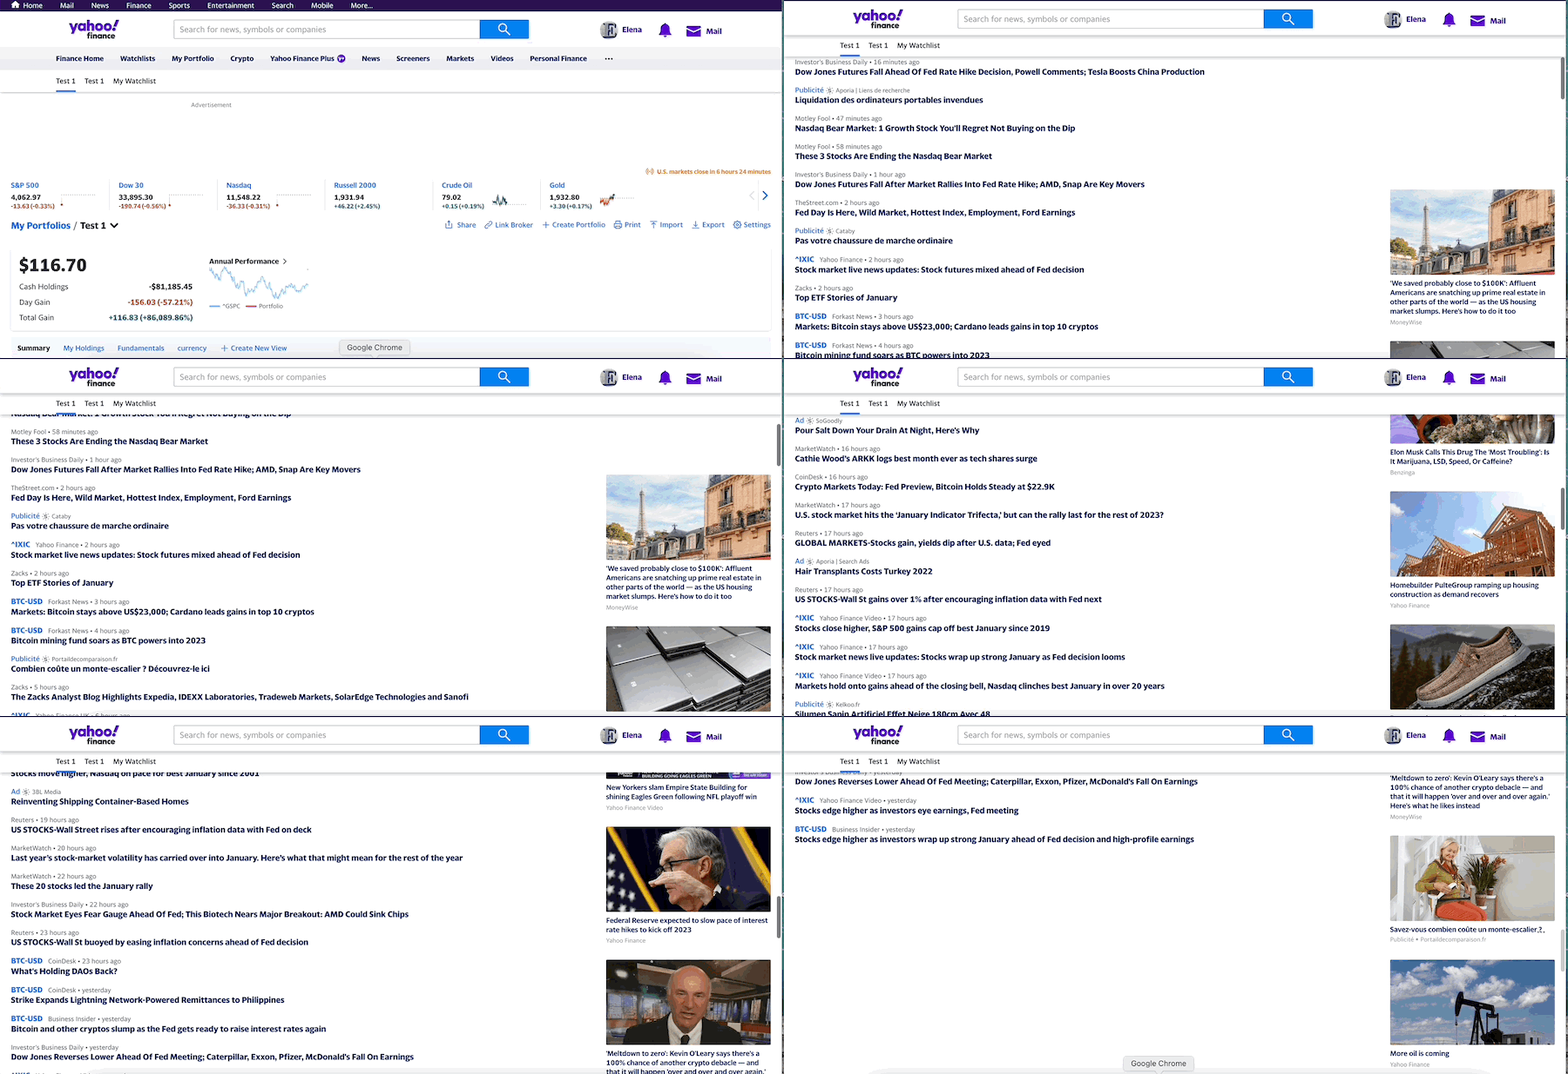
Overall, Yahoo Finance portfolio tracker appears more cluttered. You see (not always relevant) news headlines and ads plastered everywhere. Sure, it’s a free portfolio management tool, but Yahoo could have toned down the message madness just a bit.
Navexa has clean, intuitive interfaces. All the essential data is presented upfront. Whether you’re on desktop or mobile, all charts are viewable and you can easily navigate between different report types.
Data and Analytics
Yahoo Finance offers real-time access to fundamental market data, which makes it a great tool for researching stocks and assets for alternative investment portfolios. All data is updated in real-time.
But Yahoo Finance has a lot of indicators passive or casual investors mostly don’t need. It’s more trader-focused and can feel overwhelming for some users.
Navexa’s focus is on portfolio performance analysis. Our portfolio tracker shows you how much money you’re making from individual assets and from your portfolio in total. Beginners and large portfolio Australian investors find Navexa analytics equally useful because of our investment performance insights.
Portfolio Performance Analysis
A free Yahoo Finance account doesn’t offer many details on client investments. You only get numbers on day gain/loss and total gain/loss over the account lifespan.
If you upgrade to Yahoo Finance Plus, then you get extra tools for figuring out the optimal asset allocation in your financial portfolio. For example, you can benchmark all your investments against popular indices. Navexa also supports benchmarking on a Basic account plan, which is 2.5X times cheaper than Yahoo’s.
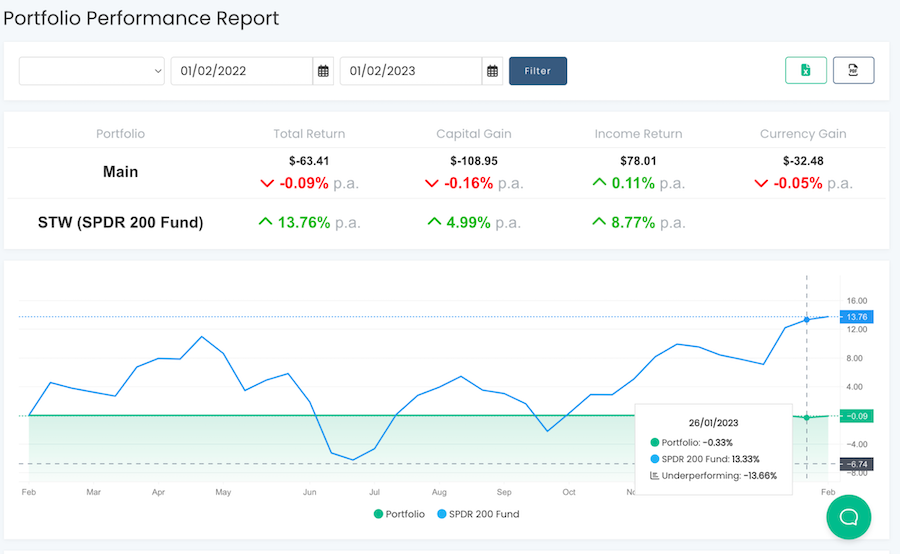
A paid Yahoo Finance plan also gives you a new risk analysis dashboard, showing a percentage-based volatility score for holdings. Also, you get a valuation dashboard, suggesting which of your assets may be over- or undervalued. If you want to further optimize your risk radar, you can play with other risk analysis measures like Alpha, R-squared, Beta Trend, Correlation, and Sharpe Ratio. All of these reports help create a less risky investment management strategy.
Finally, a paid account also unlocks extra investment research, including personalized investment recommendations. Yahoo’s asset management technology will send you new stock ideas, based on held assets, fundamental, and technical analysis.
Navexa supplies you with more portfolio and tax reports than Yahoo Finance Plus does. As mentioned earlier, our general portfolio performance analytics is based on the Modified Dietz Method: ROR = (EMV-BMV-C) / (BMV + W*C)
- ROR – for rate of return.
- EMV – ending market value.
- BMV – beginning market value.
- W – weight of each cash flow.
- C – cash flow.
Our portfolio tracker also annualizes all the calculated returns to give you a more accurate picture of your asset performance.
The above methodology also powers other competitive analytics features:
- Portfolio diversification report shows how many holdings you have within one industry. This comes in handy for risk minimisation when you select target allocation.
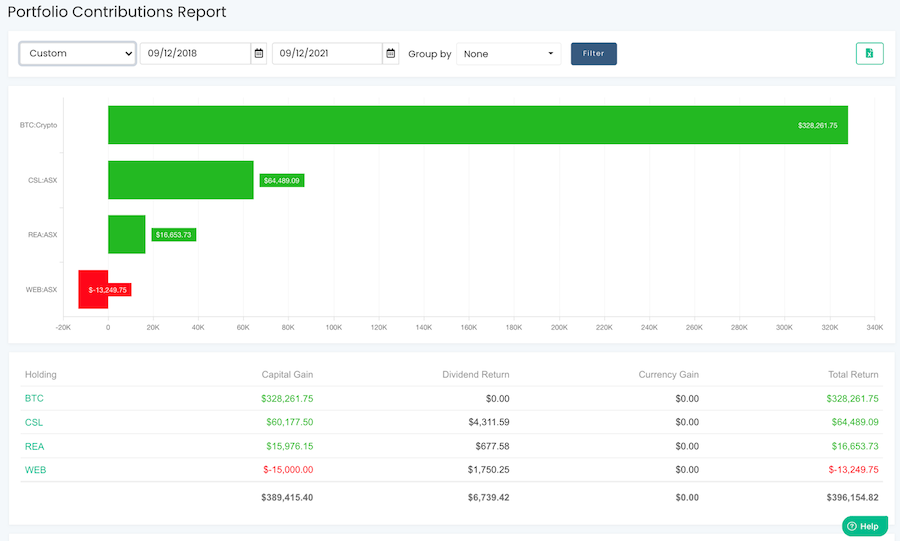
- Portfolio contributions report highlights underperforming assets in your portfolio within a selected date range. This way you can avoid sinking money into low-performing assets.
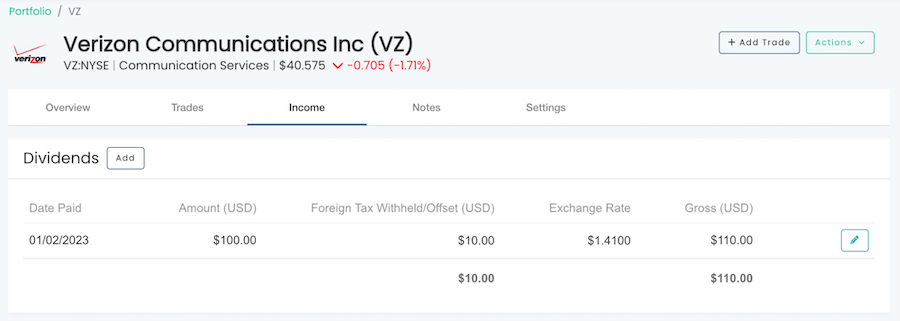
Finally, we also keep tabs on all your dividends. These are pulled automatically from a connected brokerage account. Or you can create manual entries for each holding. Our app auto-calculates the total income return for dividend payouts and keeps you posted on the average dividend yield and upcoming dividend payouts.
Real-Time Stock Analytics
The definite advantage of Yahoo is its daily asset performance graphs. You can access market data in real-time and track price fluctuations all throughout the trading day. Prices are updated based on a mix of real-time/15/20/30 mins schedules.
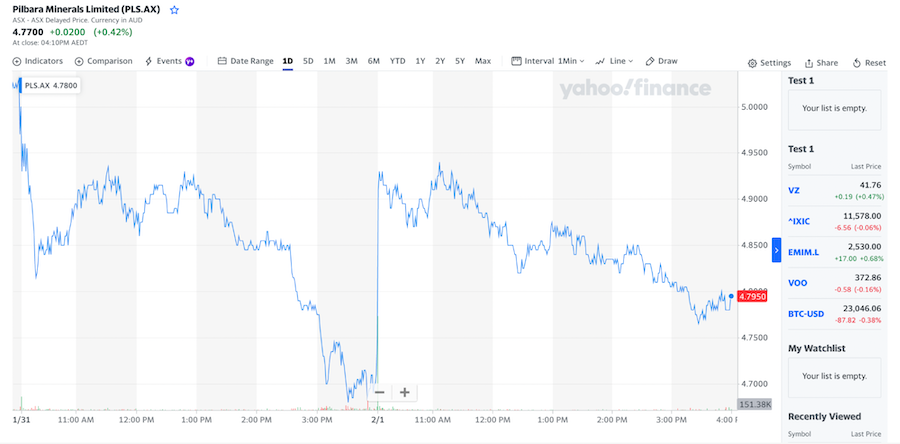
Separately, global investors can zoom in on each asset to get fresh data on trade volumes,
daily/weekly range, historical performance, and all included holdings (for EFTs/mutual funds).
Navexa doesn’t provide real-time data on stock trades. We pitch list average buy price for all assets and suggest current or closing prices when you list trades manually. The market data you see in Navexa comes with a standard 20-minute delay from the exchanges.
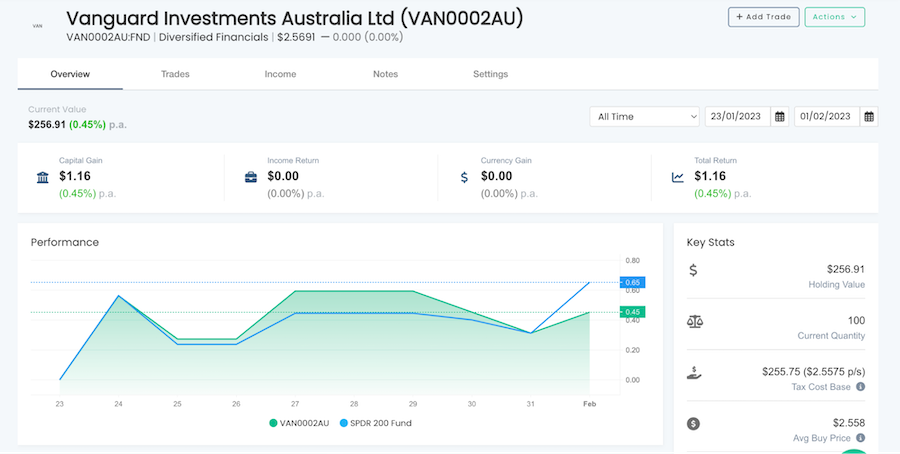
That said, we provide another type of reporting: Analytics on performance. You can track capital gain, currency gain, income, and dividends for each holding in your portfolio in real time.
Historical Stock Data
Yahoo Finance lets you look up to 5 years backward on asset performance. You can track performance across custom ranges too. That’s handy when you’re researching new assets for your portfolio.
Navexa only provides backward data on your portfolio performance, but not the markets at large.
Pricing and Support
Yahoo Finance is one of the free investor tools. But the tracker has tons of ads and lacks essential portfolio monitoring features. If you want the extras, Yahoo offers Finance Plus (+), priced at $20.83 per month.
Premium accounts include 24/7 support via email and live chat on desktop. A free Yahoo Finance plan only includes email support, which is hard to access. So your best helper is an extensive FAQ section.
Navexa portfolio management software has a free tier, which allows you to have 1 portfolio with up to 10 holdings. Paid plans start at US $8 per month for tracking one portfolio and US $15/mo for up to three portfolios.
Our free and Basic plan includes access to a self-help portal and a community forum. Standard and Premium plans include fast email support.
Yahoo Finance vs Navexa: Full Comparison Table
|
|
Navexa |
Yahoo Finance |
|
Desktop version |
✔️ |
✔️ |
|
Mobile app |
✔️ |
✔️ |
|
All major stocks, EFTs, mutual funds tracked |
✔️ |
✔️ |
|
Cryptocurrency tracking |
✔️ |
✔️ |
|
Integration with broker accounts |
All popular Australian platforms |
Mostly US brokerage platforms |
|
Investment portfolio reporting |
Comprehensive Total portfolio value, capital gains, income returns, currency gains, and total return (which factor in currency gains, dividends, trading fees, and annualization) |
Basic Total cash holdings, day gain, and total gain (which excludes currency fluctuations and dividends). |
|
Portfolio benchmarking |
Customizable Select any popular index as your benchmark. |
Limited S&P 500 is set as a default option for free accounts. |
|
Lot trades |
✔️ |
✔️ |
|
Dividend reports |
✔️ |
❌ |
|
Tax reports |
✔️ For Aussie investors: CGTR, taxable income, Unrealised capital gains. |
❌ |
|
Stock alerts |
❌ |
✔️ |
|
In-depth portfolio performance analytics over time |
✔️ |
❌ |
|
At-risk / underperforming assets analysis |
✔️ |
✔️ On Premium Plans only |
|
Portfolio diversification suggestions |
✔️ |
❌ |
|
Upcoming dividend payouts |
✔️ |
❌ |
|
Real-time market analytics |
❌ |
✔️ |
|
Historical stock data |
❌ |
✔️ |
|
Pricing |
Freemium
|
Freemium
|
TL: DRs
Yahoo Finance and Navexa both offer portfolio trackers. But each platform has a different focus.
Yahoo Finance offers ample real-time data for investment research and technical analysis, with tracking added as an afterthought. Navexa focuses primarily on portfolio analysis aka showing you real-time data on your portfolio value, capital gains, and income returns. Unlike Yahoo Finance, we provide daily and historical portfolio tracking data for your entire portfolio and individual assets. Plus, hook you up with tools to generate tax reports.
Overall, Yahoo Finance is best suited for active traders, rather than passive investors or people new to wealth management. If technical analysis is your jam, you’ll love Yahoo Finance for ample, real-time data and custom market indicator overlays.
But if you’re more interested in progressively building out your wealth for the future (and profiting from some trades today), Navexa offers you better tools for portfolio evaluation, optimization, and growth. Open a free account with Navexa to sample all our features.
