Categories
The Benchmark

How Bitcoin could break into the S&P 500

September 30, 2024


The Bitcoin bet that left Wall Street in its dust

Dear Reader,

August 11, 2020.

MicroStrategy announces its first Bitcoin purchase.

It would prove to be the first of many. The company now holds more than quarter of a million BTC.

Nobody at the time — save for the company’s then CEO, Michael Saylor — would have predicted the seismic shift it would trigger in the company’s fortunes.

Four years later, let’s see how this particular Bitcoin bet has played out.

David vs. Goliath: MSTR takes on the S&P 500

Since that fateful day in August 2020, MicroStrategy (MSTR) has embarked on a journey that would make even the most bullish tech investors blush.

While the S&P 500 has delivered a respectable 70% return over this period, MSTR has gained 1,071%.

Check it out:


Let that sink in for a moment.

While the broader market was busy navigating pandemic recovery, inflation fears, and geopolitical tensions, MicroStrategy was quietly (or not so quietly) outperforming nearly every other stock in the index.

The numbers don’t lie

At the time of writing, MSTR is trading at $165.98, up 9.24% in a single day.

Compare this to the S&P 500’s current level of 5,648.40, which represents a 25.31% increase over the past year.


MSTR performance over the past five years

MicroStrategy’s market cap is $30.37 billion.

The company’s 50-day moving average price is $142.38, while its 200-day moving average is $120.86.

MSTR’s trading volume has exploded, with 16,889,560 shares changing hands compared to an average volume of 11,784,407.

These figures paint a picture of a stock that’s not just growing but accelerating.

Driving this acceleration, of course, is the company’s massive Bitcoin holdings.

As of the latest reports, the company holds 252,220 BTC, purchased at an average price of $39,456.

This translates to an unrealized gain of 61.92%, or $6.1 billion.

It’s worth noting that while MSTR has outperformed Bitcoin itself (which is up 425% since 2020), it’s the company’s leveraged position that has amplified these gains for shareholders.

It’s also worth noting that Saylor regards the basic strategy as something anyone can replicate:


MicroStrategy’s performance becomes even more impressive when we stack it up against the tech giants that typically dominate market discussions.

Since August 2020, MSTR has outperformed the ‘Magnificent 7’ — Apple, Microsoft, Alphabet, Amazon, Nvidia, Meta, and Tesla.

MicroStrategy currently ranks 306th in terms of market capitalization among publicly traded U.S. companies.

This puts it squarely in the middle of the S&P 500 pack, despite its outsized returns.

Entering the S&P on the back of buying BTC?


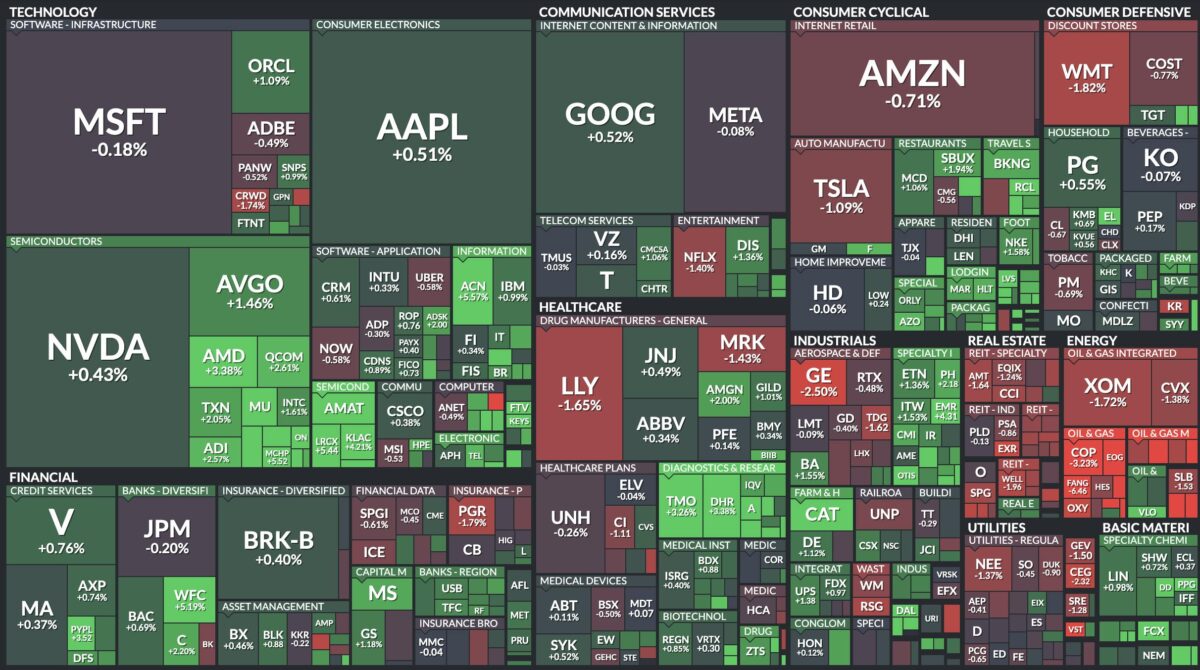
S&P 500 heatmap

With such stellar performance, why isn’t MicroStrategy already part of the S&P 500? The answer lies in the index’s stringent inclusion criteria.

To be considered, a company needs:

  • A market cap of at least $11.2 billion — check.
  • 50% of stocks in free circulation — check.
  • A ratio of annual turnover to market cap of at least 0.3.
  • Monthly traded value higher than 250,000 shares for six consecutive months.

MicroStrategy’s focus on Bitcoin and its issuance of convertible bonds have been hurdles. However, come January 1, 2025, new FASB rules on digital asset holdings could change the game.

If MSTR reports positive earnings on October 29, 2024, it could be a strong contender for S&P 500 inclusion, potentially adding $3 billion to its undistributed profits.

Flash in the pan, or new paradigm?

The company’s strategy is high-risk, high-reward, tying its fortunes closely to the volatile cryptocurrency market.

But, MicroStrategy’s journey since August 2020 has been extraordinary. Its 1,071% return has left the S&P 500’s 70% gain in the dust, challenging conventional wisdom about corporate treasury management and investment strategies.

The question now: Is MicroStrategy a outlier, or a harbinger of a new era in corporate finance? Time will tell, and Wall Street will be watching closely.

Just this month, Saylor announces MicroStrategy had scooped up another batch of BTC:

twitter profile avatar
Michael Saylor⚡️Twitter Logo
@saylor
MicroStrategy has acquired 18,300 BTC for ~$1.11 billion at ~$60,408 per #bitcoin and has achieved BTC Yield of 4.4% QTD and 17.0% YTD. As of 9/12/2024, we hodl 244,800 $BTC acquired for ~$9.45 billion at ~$38,585 per bitcoin. $MSTR https://www.microstrategy.com/press/microstrategy-acquires-18300-btc-achieves-btc-yield-of-4-qtd-17-ytd-now-holds-244800-btc

link visual
microstrategy.com
MicroStrategy Acquires 18,300 BTC and achieve…
MicroStrategy Acquires 18,300 BTC and achieves BTC Yield of 4.4% QTD and 17.0% Y…
2:7 PM • Sep 13, 2024
4794
Retweets
27385
Likes
Read 1745 replies

Run an SMSF? New video for you:

Managing an SMSF can be painful, or it can be easy.

Navarre’s latest walks you through how to make it the latter.

Click to watch.

video preview

That’s it for The Benchmark this week.

Forward this to someone who’d enjoy it.

If one of our dear readers forwarded this to you, welcome.

Invest in knowledge,

Thom
Editor, The Benchmark

Unsubscribe · Preferences

All information contained in The Benchmark and on navexa.io is for education and informational purposes only. It is not intended as a substitute for professional financial or tax advice. The Benchmark and any contributors to The Benchmark are not financial professionals, and are not aware of your personal financial circumstances.
Categories
The Benchmark

Rate cut rally & weird election year market facts

September 23, 2024


Three trends, one quarter

Dear Reader,

Three financial phenomena are colliding.

In the final quarter of 2024, we’ll find out who’s going to run the United States government for the next four years.

We’ll learn the impact of central bankers jacking up interest rates for the first time since 2020.

And, we’ll enter a period in which stocks historically perform well.

So, what can we expect to happen from here?

The fourth quarter trend

About three quarters of the time since 1945, the S&P 500 has risen in the fourth quarter of any given year.

In 77% of the past 79 years, to be exact.

Meaning the odds are decent that stocks pop between now and year’s end.

The market gained 26.29% total return in 2023, having been down18.11% in 2022.

At the time of writing, the S&P 500 is up 20% year-to-date, having just made new highs.

This historically robust quarter for stocks delivers, on average, a 3.8% gain.

These three strong months tend to follow the toughest month of the year:

But, of course, this is market performance in isolation.

And the market, as we know, is a measure for many things — not just what people are prepared to buy and sell stocks for.

Mark Hackett, chief of investment research for Nationwide Mutual Insurance, explains the factors feeding into this particular fourth quarter:

We anticipate continued volatility through November as investors await greater clarity on Fed policy, macroeconomic trends, and, of course, the upcoming election. However, our outlook for the end of the year remains positive. We expect a strong fourth quarter, driven by seasonal tailwinds, diminished election uncertainty, and Fed [rate cuts].’

The ‘seasonal tailwind’ he’s talking about is the market’s historical tendency to rise in Q4, most of the time.

Just to be clear, most of the time does not mean all of the time.

A 77% chance stocks go up is just another way to say a 23% chance they go down.

The past gives us perspective, but it doesn’t predict the future.

As for the election and the Fed, well, let’s take a look.

The election year trend

On November 5, the world will know who’s going to be running the United States for the next four years.

Who wins the election will, no doubt, have an impact on the stock market.

But exactly what impact?

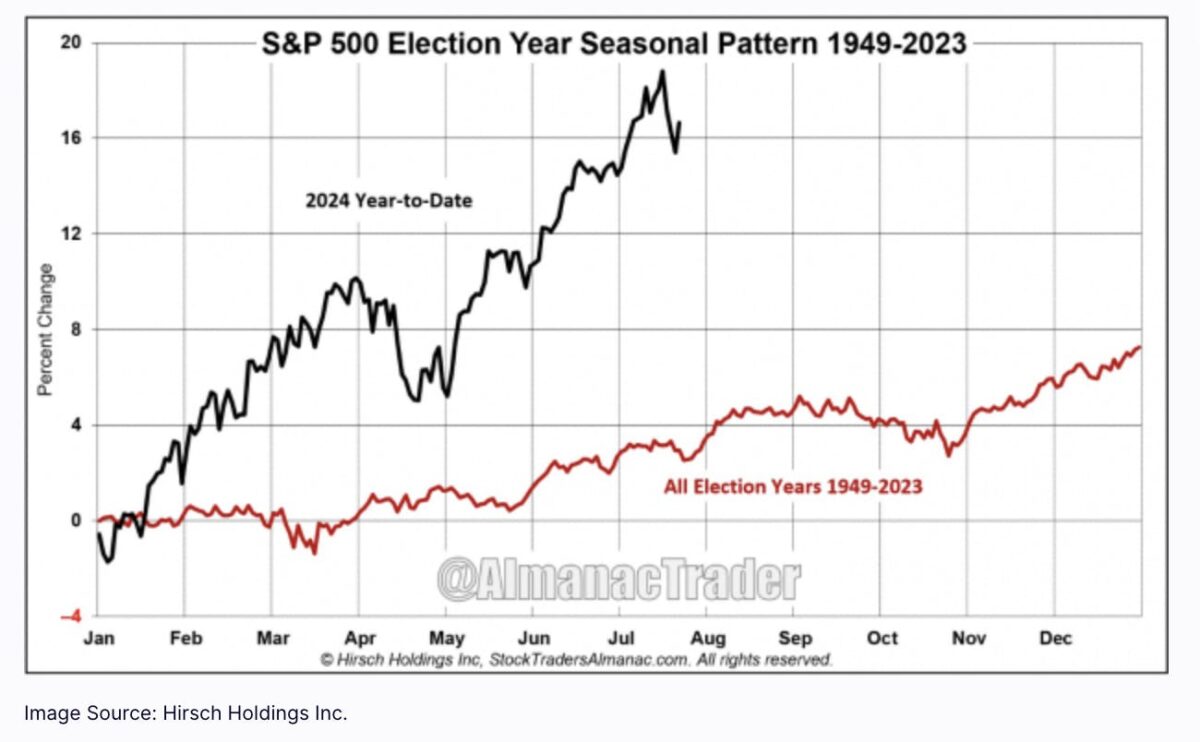
Take a look at the chart below.

It’s the S&P 500 up until a couple of months ago, compared to the average of every election year performance from 1949 to 2023.


The market is already trading way higher than your average election year.

Maybe the Q4 trend and the Fed’s anticipated rate cut is going to drive those lines apart even more.

But back to who runs the most important economy on the planet.

If I asked you which candidate was going to be better for the financial markets, you might say Trump.

I would have, until I found this from the WSJ:

The Dow Jones Industrial Average has risen at an annualized rate of 8.2% under Democratic presidents.

For Republican presidents? Just 3.2%.

Adjust for inflation, and those numbers come to 3.7% and 1.4%, respectively.


Source

Democrat presidents, on average, are more than twice as good for stocks than Republicans.

Of course, correlation does not imply causation.

But with the Democratic candidate polling higher, at the time of writing, than the Republican, could that imply another tailwind for stocks going into Q4?

Fed makes hotly-anticipated interest rate cut

Last week, the Federal Reserve cut interest rates by half a percentage point.

It’s now 4.875%. The Fed states they want to get that down to about 2.9%.

While it’s not a simple case of inverse correlation, we can say that, generally speaking, stocks go up when interest rates go down.

There are exceptions, of course, but generally this is the case.

The initial reaction was no exception.


Source

Source

The real question, beyond the initial market reaction, is how the expected trend of continued rate cuts will impact the stock market and economy.

(The economy, historically, takes longer to respond to interest rates than the markets, which can price in sentiment about the future pretty much instantly.)

Some expect the market to soar from here.


Source

Only time will tell if this rate cut marks the resuming of what some believe is a secular bull market, or will merely apply a weak handbrake to what others believe is an inevitable recession.

But for the quarter ahead, the stage would appear set for a historically strong final three months of the year.

How to check an investment strategy is working

Navarre’s latest video walks you through how to make sure your investment strategy is working using the Navexa Portfolio Tracker.

Check it out now:

video preview

That’s it for The Benchmark this week.

Forward this to someone who’d enjoy it.

If one of our dear readers forwarded this to you, welcome.

Invest in knowledge,

Thom
Editor, The Benchmark

Unsubscribe · Preferences

All information contained in The Benchmark and on navexa.io is for education and informational purposes only. It is not intended as a substitute for professional financial or tax advice. The Benchmark and any contributors to The Benchmark are not financial professionals, and are not aware of your personal financial circumstances.
Categories
The Benchmark

The other Great Depression

September 16, 2024


The new railroad across America the world

Dear Reader,

Most people think the Great Depression started with Wall Street’s notorious 1929 crash.

This is because most people have short memories. Few bother digging into history very far.

As a Benchmark reader, you are clearly not one of these people.

Sometimes, we can learn more about the present and near-term future by paying attention to things that happened a long time ago.

Especially when those things perhaps seemed implausible in their time.

Today, I want to take you on a ride to the 19th Century.

More specifically, a ride that starts with great promise and winds up running off the rails into chaos and ruin.


AI train wreck

The promise & peril of new tech

The United States of America would not be what it is today had the railroad industry not taken off there in the 1800s.

The railroad allowed the industrial revolution early in the century to explode out of the northeast of the country and propel settlement and developments in the west.

Journeys that previously took months now took only days; the frontier was wide open.

The first passenger and freight line opened in 1827 and gave rise to nearly 50 years of continuous building.

Until, that is, the Great Depression few today remember. More on that in a second.


The first transcontinental railroad

It didn’t take long for speculation and regulation to poison the pure promise of the railway revolution.

Building railways cost lots of money. This meant borrowing, over-leveraging and rampant speculation.

This speculation began to influence the industry itself: While there were plenty of short railways initially, most of these were folded into trunk lines due to a fast-developing financial system based on Wall Street’s appetite for railway bonds.

(Credit to Thomas Pueyo at Uncharted Territories for the summary.)

As so often happens when speculation runs wild — especially concerning a novel and significant technological development — consequences quickly followed.

The other Great Depression

After the American Civil War, the railroad boom went to another level — companies laid 33,000 miles, or 53,000km, of track in just five years.

Grants, subsidies and speculation fuelled the boom.

The railroad industry become one of the largest employers in the country.

Over-expansion hit hard. Mountains of money became tied up in projects that offered no immediate return.

The market for railway bonds collapsed. The companies that had borrowed all the money couldn’t repay it when the banks came calling.

In 1873, 55 railroad companies failed. Another 60 collapsed inside 12 months. Development and growth fell off a cliff.

This triggered a chain of bank failures and closed the NYSE.

Strikes, riots and protests broke out.

The contagion spread to Europe and marked the beginning of two decades of economic pain for Britain that became known as the Long Depression.


Schwarzer Freitag (Black Friday) on the Vienna Stock Exchange as the railroad crash hit Europe

Until 1929, the US knew this crash as the Great Depression, when the subsequent crisis stole the moniker by setting a new standard for financial crisis and economic strife.

So, Reader, 150 years on, what can we do but observe the parallels?

AI = 21st Century railroad?

We’re living in the AI boom times.

The market is projected to more than double in the next few years.

NVIDIA — current king of the AI jungle — recently became worth more than most nations’ GDP.

Here’s some parallels between the AI and railway booms.

Rapid growth and expansion: The AI industry is currently going through explosive growth, with an expected annual growth rate of 37.3% from 2023 to 2030.

Rampant speculation: The AI market is already commanding substantial investment, with the market size expected to grow from $454.12 billion in 2022 to around $2,575.16 billion in the near future. Analysts are currently mid-freakout regarding how far NVIDIA and the other big tech companies can go riding the AI wave.

Transformative impact: Railroads revolutionized transportation and commerce in the 19th century, becoming the largest employer outside of agriculture. Similarly, AI is poised to transform pretty much every aspect of life and business.

Overexpansion concerns: The railroad boom led to economic overexpansion, with most capital invested in projects offering no immediate returns. While the AI industry hasn’t faced a similar crisis, there are concerns about the rapid proliferation of AI technologies and their potential economic impacts.

Competition and market saturation: Many railroads overbuilt, leading to ruinous competition for freight traffic. In the AI industry, we’re seeing a proliferation of AI models and applications, which could potentially lead to market saturation and intense competition.

But that’s not all.


Watercolour Van Gogh by AI

Perhaps most alarming of the parallels is the cost to build AI products.

According to Thomas Pueyo:

‘ Foundation models are the software that power OpenAI’s ChatGPT, Anthropic’s Claude, Meta’s Llama, Google’s Gemini, and the like. It’s very expensive to make them. Today, it’s in the order of hundreds of millions of dollars. In the not-too-distant future, it will likely reach billions, and within a decade, it might reach a trillion.’

What that means, is despite AI’s seemingly limitless promise and potential, it actually costs loads to produce.

And that cost is only going higher.

Take a look:


This has a lot to do with the bullishness around NVIDIA — they produce most of the chips that make is possible to build AI.

Will AI send the market off the rails?

History doesn’t repeat itself, but it does rhyme‘, as Mark Twain famously said.

He also said ‘denial ain’t just a river in Egypt‘.

Well, this being one of the more dense and expansive Benchmark emails I’ve written to you, I think it’s only appropriate I defer to a higher intelligence to try to give you a takeaway insight.

At least, that’s what I tried to do.

I asked my current AI tool of choice, Perplexity, this question:

What’s the likelihood that the AI boom crashes the economy in the next five years?

This is what I got back:


Let’s hope this crash doesn’t spiral into a stock market and economy-wide contagion that dwarfs our current definition of Great Depression and consigns 1929 to lesser-known history.

Quote of the week

In the 1848 gold rush to California, most gold diggers didn’t make much money, but the shovelmakers made a fortune. NVIDIA is today’s shovelmaker.’

— Thomas Pueyo

Earn dividends? You should see this…

Navarre’s latest video covers a massively misunderstood aspect of investing.

This common mistake once nearly led him to sell a stock he’d made a great return on, thinking it had lost him money.

How does that happen, and how do you avoid such mistakes?

It’s actually very simple. Check out the video here:

video preview

That’s it for The Benchmark this week.

Forward this to to share the insight with someone who’d enjoy it.

If one of our dear readers forwarded this to you, welcome.

Until next week!

Invest in knowledge,

Thom
Editor, The Benchmark

Unsubscribe · Preferences

All information contained in The Benchmark and on navexa.io is for education and informational purposes only. It is not intended as a substitute for professional financial or tax advice. The Benchmark and any contributors to The Benchmark are not financial professionals, and are not aware of your personal financial circumstances.

Categories
The Benchmark

The stock market vs. the ‘real’ world

September 8, 2024


Teetering stocks & the harsh reality of not owning them

Dear Reader,

This week’s email is a shameless chart party.

One of our team here at Navexa kindly shared a treasure trove of fascinating charts with me recently, which led me down many different and thought-provoking rabbit-holes.

First up, take a look at this:

Risk is was back on the menu, boys


Source: https://www.chartstorm.info/p/weekly-s-and-p500-chartstorm-20-may

What you’re looking at above is evidence that Wall Street’s appetite for risk has returned after a couple of years of fear and uncertainty.

At least, that’s how it looked at the end of May.

The S&P Global investment manager index had measured risk appetite and near-term market outlook returning to late 2021 levels.

Stocks were at or near all-time highs, and institutional investors were brimming with optimism.

Callum Thomas, who runs ChartStorm, noted that we’re in a ‘cyclical bull market’:

The takeaway or bullish suggestion would be that this cyclical bull is relatively normal, and also mid-lower pack… and most of all, looks like it still has time and space to go up to the right if history is any guide.’

Three months later, however, you can see just how fast sentiment can swing in the stock market:

Tech stocks flirting with bearish trend


Source

Callum says of the chart above:

‘After failing to breach that key overhead resistance level, tech stocks have rolled over again — at this point now notching up a lower high. From a classical technical analysis standpoint this is not a good sign, you want to see a series of higher highs and higher lows to be confident in the bull trend, whereas a transition to lower highs brings into prospect the possibility of a bear trend establishing.

‘To remain constructive at all on tech stocks and by extension US equities as a whole, it is going to be critical for the Nasdaq to avoid making a lower low (and avoid breaching that rising bar of the 200-day moving average)
.’

I try, in this email, not to get too caught up in dangerous short-termism.

Stocks are going to do what they’re going to do. Up one day, down the next, irrational exuberance and panic dished out by turn as the great financial circus constantly unfolds.

So let’s zoom out now and go big picture.

Check this out:

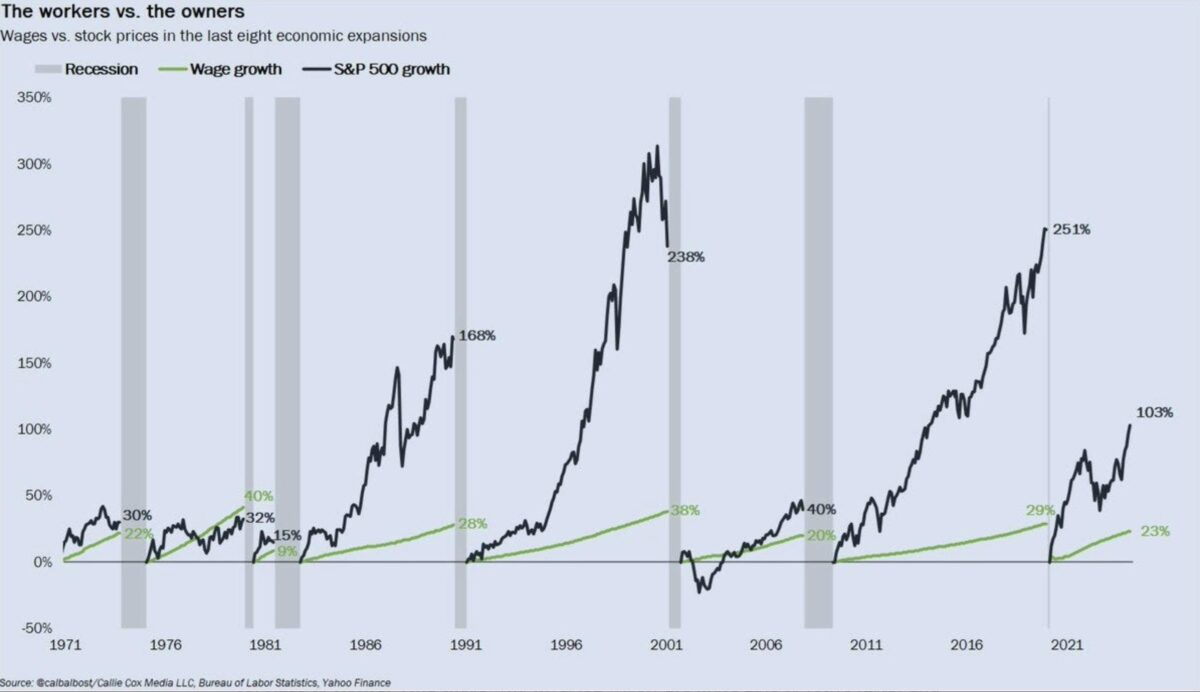
Wage growth vs. stock market growth


Source

Work a job, earn money, save some, invest some, retire comfortably, right?

That used to be the dream for most people. For some, it perhaps still is.

But what you see on the chart above is the reality of working for money, versus putting money to work in the markets.

In the 1970s and early 1980s, wage growth more or less kept up with stock prices — in the late ’70s even beating the stock market’s performance by nearly 10%, imagine that!

But after that, as you can see, the stock market left wage growth in its dust.

From ’91 to ’01, there was a 200% difference.

Across the half-century of data represented in the chart, its clear that those who owned stocks built many times more wealth than those who relied solely on income from a job.

And speaking of jobs, here’s a lesser-talked about aspect of the relationship between the stock market and the employment market.

82% of U.S. jobs are not on the S&P 500


Source

There are 158 million people employed in the U.S. economy.

But only 29 million, or 18%, of them work for S&P 500-listed companies.

In other words, most of the U.S. workforce is employed outside of the biggest companies in the country — meaning the vast majority of the economy is in private, rather than public, markets.

Why is that? Ben Carlson shared a brilliant Sam Ro chart a while back that sheds light on this:


Source

Ben notes:

The stock market is mostly corporations that make and sell things. The economy is mostly the stuff we do with those things. Most of the time the stock market and the economy are moving in the same direction but they also diverge on occasion. The S&P 500 also receives roughly 40% of revenues from overseas. For technology stocks, that number is closer to 60%.’

And now, to our final chart of this week’s email.

This one might surprise you.

Buffett’s (relatively) late bloom as billionaire


Source

We tend to think of Warren Buffett as supremely wealthy. Which he is.

But we also tend to presume he was always supremely wealthy.

As you can see on the chart above, this is simply not the case.

Warren didn’t crack a billion-dollar net worth until he was more than half a century old.

It took him until his early sixties to hit five billion.

But then the power of compounding really started to go to work, and Buffett’s net worth began climbing steeply.

While the chart only goes up to 2019, today, Warren is worth about $139 billion.

He’s built that wealth, of course, by buying and holding shares in the highest-quality companies in the world (and by selling shares in his legendary holding company, Berkshire Hathaway).

Imagine what his net worth might be today had Buffett worked a job, instead of buying stocks and building businesses?

Now, if, like Warren, you’re building wealth by investing in the stock market, you’re going to need some specialist knowledge re: tax.

Specifically, you’re going to need to understand capital gains tax to a far greater degree than the average tax-payer.

Because, as you’re about to see, far too many investors get caught out by the three CGT lies Navarre exposes in his latest video guide.

Click the player to watch:

video preview

That’s it for The Benchmark this week.

Forward this to someone who’d enjoy reading.

If one of our dear readers forwarded this to you, welcome.

Until next week!

Invest in knowledge,

Thom
Editor, The Benchmark

Unsubscribe · Preferences

All information contained in The Benchmark and on navexa.io is for education and informational purposes only. It is not intended as a substitute for professional financial or tax advice. The Benchmark and any contributors to The Benchmark are not financial professionals, and are not aware of your personal financial circumstances.
Categories
The Benchmark

The 0.00000001% investing mindset

September 2, 2024


Your mind, your money
and my unsolicited TED talk

Dear Reader,

I never wanted to do this.

Write one of those ‘book club’ emails.

You know, the ones where the writer does the email equivalent of sidling up to you and chewing your ear off about ‘this fantastic’ book they’ve been reading…

How you’ve ‘just got to read it’…

Please.

If it’s so good why don’t you go back to reading it instead of administering an unsolicited TED talk.

With that, Reader, I hereby lower myself to the level of the book review email writer.

Technically, it’s not my first time, but the last time I wrote to you about a brilliant investing book, I did not have my hands on a physical copy.

Today, I’m going all the way. Here’s the offending article:

Luck, risk and the profound
power of financial subjectivity


The Psychology of Money isn’t your average investing or finance book.

If it were, I wouldn’t be writing to you about it.

Author Morgan Housel isn’t your average investment writer, either.

While most bestsellers in this space come from portfolio managers, economists, advisors or personal finance gurus, Housel was a journalist, columnist and analyst before he wrote his book.

He spent the best part of a decade at financial publisher The Motley Fool — competitors to my former employer, Agora.

I think this is what makes The Psychology of Money so good.

Because I know, first-hand, that analyzing and writing about the markets for independent publishers demands you look outside the mainstream for rare insights readers can’t get from the usual channels.

Having spent so long writing for such a business seems to have resulted in one of the finest, clearest books on investing and personal finance you’ll likely ever read.

You can sprinkle in his contributions to the Wall Street Journal as testament to his journalistic pedigree.

Part of the reason for this is that Housel hasn’t really written ‘a book’ per se.

Rather, he’s edited and collated 20 essays from his career, with the goal of shedding light on why we think and feel certain ways about money and investing.

Here’s three of the my favourite insights from the book.

The 0.00000001% mindset

What seems to make perfect financial sense to me might seem insane to you.

Such is the profound impact of our individual experience, that it largely defines how we think and feel about money.

Here’s one of many great examples:

‘The person who grew up in poverty thinks about risk and reward in ways the child of a wealthy banker cannot fathom if he tried

The stock broker who lose everything during the Great Depression experienced something the tech worker basking in the glory of the late 1990s can’t imagine.’

Housel reckons our personal experiences make up about 0.00000001% of what’s happened in the world.

But, they also account for about 80% of how we think the world works.

Nothing is what it seems

Housel explains the extent to which confirmation bias distorts our perception of success and luck (both good and bad).

Bill Gates is renowned as a pioneer of personal computing and a gifted businessman.

Turns out, he just happened to attend one of the only schools on the planet that had a computer.

Thanks to a forward-thinking teacher, Gates and his friends — one of whom joined Gates in founding Microsoft — got to play with a Teletype Model 30 computer as early as 1968.

Out of 303 million high school-age people in the world at that time, Gates was among the 300 who attended the school that had a computer.

When Housel interviewed Nobel Prize in economics-winner, Robert Shiller (of Shiller P/E ratio fame), he asked him: ‘What do you want to know about investing that we can’t know?

Shiller’s answer: ‘The exact role of luck in successful outcomes.’

The time dividend

University of Michigan psychologist, Angus Campbell, sums up the ‘common denominator of happiness’ thus:

Having a strong sense of controlling one’s life is a more dependable predictor of positive feelings of wellbeing than any of the objective conditions of life we have considered.’

Money’s true value to us an individuals, Housel writes, is its power to give us control over our time.

Having worked as an intern investment banker and managing to last only one out of the four months he signed up for, Housel experienced what it feels like to be a time slave, working longer hours than most human beings could handle.

In fact, even doing something we love on a schedule we can’t control can turn that activity into something we hate.

Money can only make you happy when it hands you more control of your time.

This should be obvious by now, but I highly recommend you read The Psychology of Money — I’ve only scratched the surface of this book’s brilliance in this email!

3 ETF tax mistakes hurting Aussie investors

One way investors try to get back their time is by investing in ETFs for capital appreciation and income.

In principal, this is a great approach. But, there’s some pitfalls few investors know about.

Navarre just published his latest YouTube video explaining three ETF investing hurting Australian investors at tax time.

Click the player to watch now:

video preview

Quote of the week

The world is full of obvious things which nobody by any chance ever observes.’

Sherlock Holmes

That’s it for The Benchmark this week.

Forward this to someone who’d enjoy reading.

If one of our dear readers forwarded this to you, welcome.

Until next week!

Invest in knowledge,

Thom
Editor, The Benchmark


Unsubscribe · Preferences

All information contained in The Benchmark and on navexa.io is for education and informational purposes only. It is not intended as a substitute for professional financial or tax advice. The Benchmark and any contributors to The Benchmark are not financial professionals, and are not aware of your personal financial circumstances.