A year in which the S&P 500 has climbed almost 30% — about triple its annual return:
A year in which central banks began slashing interest rates having battled the highest inflation of the past 25 years:
A year in which a resurgent Donald Trump led the Republican Party back to power in the U.S.:
A year in which NVIDIA surpassed Apple to become the most valuable company on the planet:
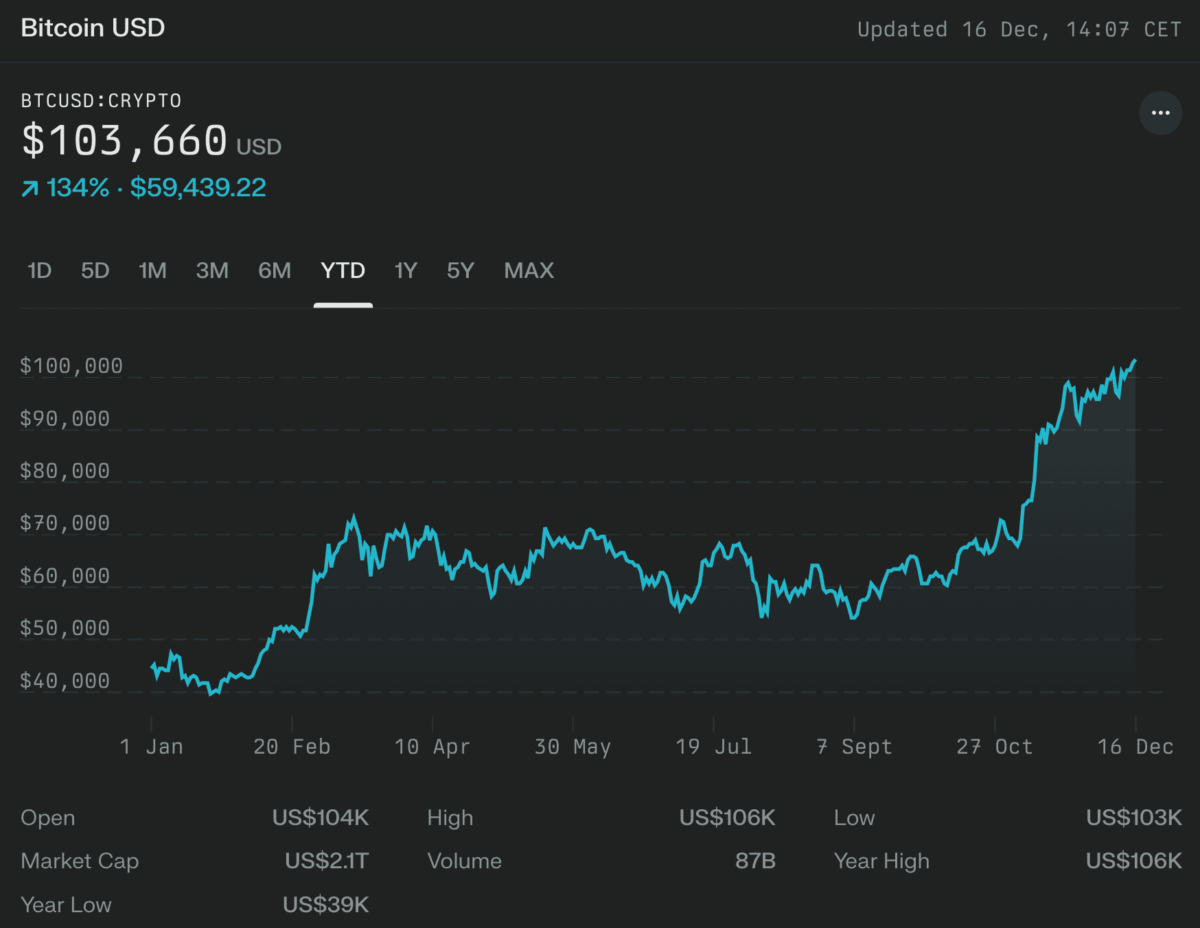
In which Bitcoin hit a six-figure valuation for the first time:
And in which Michael Saylor’s MicroStrategy both became the first ‘Bitcoin treasury’ company, and the first such company to enter the NASDAQ 100.
You could say that the theme of this year for investors has been up and/or to the right.
How much further this bull market runs, as always, we must wait to see.
For The Benchmark, however, it doesn’t matter whether prices are rising or falling.
There’s stories and insights everywhere.
After writing nearly 40 of these emails this year, as I take a pause before writing at least that many next year, here’s five of the most-read Benchmark stories from 2024.
The 0.00000001% investing mindset: This is the investing email I promised I’d never write, and the one worth breaking that promise for. It’s about the obvious things all around us that we ignore.
The other Great Depression: Most people think the Great Depression started with Wall Street’s notorious 1929 crash. As you’ll see though, people are all too easily tricked by their short memories.
Unskilled 24-year-olds running Wall Street: Never before have so many unskilled twenty-four-year-olds made so much money in so little time as the characters you’ll read about in this one.
The stock market vs. the ‘real’ world: Behold the stark reality of working for money, versus putting money to work in the markets — and a stack of other confronting charts about the markets and economy.
Why this elite ex-trader ditched Wall St for fast food: The ultimate arbitrage trade? Taking your earnings from seven years trading for ‘the hedge fund king’ and investing it into a Mexican takeaway empire on the other side of the planet.
These are some of the stories subscribers enjoyed most this year.
All information contained in The Benchmark and on navexa.io is for education and informational purposes only. It is not intended as a substitute for professional financial or tax advice. The Benchmark and any contributors to The Benchmark are not financial professionals, and are not aware of your personal financial circumstances.
I’ve been writing in the financial world for more than a decade.
I was a copywriter and a financial research business for many years.
Before that I was a news editor and print journalist.
This isn’t to brag. Just to say I’m not some random dude who decided to start writing an investing email with zero experience.
Anyway, here’s one thing I’ve learned about writing this type of stuff:
You don’t need to have any original ideas.
You need to synthesize publicly available information in order to offer a fresh insight or perspective.
So here’s my confession about The Benchmark, which I’ve now been writing for about seven months:
I don’t really ‘write’ these emails.
I collate them.
I do that by maintaining a diet of high-quality financial journalism and content.
I subscribe to a selection of the top finance and investing publications on the planet.
The Wall Street Journal.
Bloomberg.
Shortly, I’ll probably add The Economist into the mix.
Big stories and ideas are all around us; sources like these make it quick and easy to plug into what’s going on, and how the markets are feeling about what’s going on.
It was a WSJ headline that led me down the Arabian peninsula oil discovery rabbit hole (the one where I found out the guy who discovered all that oil went to the same high school as me in New Zealand).
Morgan Housel’s excellent book The Psychology Of Money got me thinking about the 0.00000001% investing mindset and the extent to which our subjective experiences bias our view of the world around us.
And Bloomberg’s various pieces of hard news and opinion helped me make sense of how Norway has managed to tax itself poorer by driving their wealthiest out of the country.
So yeah, a lot of what I do in this email is zoom in on a story or idea that’s captured my attention amid the daily financial media and content noise.
And there is a lot of noise. More than ever.
But I don’t only use big-name publications and books like those above to find the stories I want to write to you about.
There’s a host of ‘new media’ sources I’ve come to value just as highly.
While several Benchmark readers have written to me telling me they like these weekly emails, and often don’t enjoy the overwhelming volume of news and opinion than can all-too-easily clog an inbox…
Today I want to make a case for adding a few more things into your financial media diet.
The Opening Bell Daily
Phil Rosen is a former senior reporter at Business Insider, where he found his voice writing a popular daily financial newsletter.
Now, he’s doing this under his own steam with his new email.
It’s among the best free financial emails you’ll find anywhere on the internet.
According to Phil, the mission is to give readers ‘access to Wall Street through original reporting and exclusive interviews — all delivered with more nuance and even-handed analysis than what’s typically found behind paywalls at mainstream outlets’.
Phil’s an exceptionally experienced and credentialed writer. This shines through in his work, which I highly recommend you check out if you value a pithy, insight-rich daily take on the stories moving the markets.
The Opening Bell Daily has a co-founder, who happens to be my second recommendation for you…
If, that is, you have the stomach for Bitcoin and crypto news.
If you don’t, best skip to my third recommendation.
The Pomp Letter
Anthony Pompliano is well worth reading and listening to — even if you share Warren Buffett’s views on crypto.
An entrepreneur and investor who’s founded, scaled and sold multiple businesses, Pomp helped Phil Rosen launch The Opening Bell Daily.
But he also has his own daily email — The Pomp Letter.
I read this most days. Why? Not only because I’ve been following the crypto story about a decade, but because Pomp gives you an insight into that world through an institutional investor and businessman’s lens.
This, in my opinion, is a far better way to keep up with crypto — and more specifically Wall Street’s relationship with crypto — than by sifting through an X feed full of pump-and-dump crypto bros.
There’s a bigger story here. And Pomp’s is one of the more rational, calmer voices in the conversation.
So there you have it. This is how I write The Benchmark — by regularly reading exceptionally good financial and investing writing from people with an exceptional talent for finding signals in the noise.
I’d love to know what you read or recommend — feel free to reply to this email and let me know.
Quote of the Week
‘In America the President reigns for four years, and Journalism governs forever and ever.’
— Oscar Wilde
That’s it for The Benchmark this week.
Forward this to someone you know who’d enjoy reading.
And if one of our dear readers forwarded this to you, welcome.
All information contained in The Benchmark and on navexa.io is for education and informational purposes only. It is not intended as a substitute for professional financial or tax advice. The Benchmark and any contributors to The Benchmark are not financial professionals, and are not aware of your personal financial circumstances.
These days it feels like nobody can shut up about NVIDIA.
Especially this past week, when the current stock market darling announced its Q3 earnings — $30.8 billion in revenue, beating analysts’ expected $29 billion, and up 112% on Q3 2023.
The company’s winning streak, according to CEO Jensen Huang, comes amid ‘the age of AI’.
But let’s step back from the quarter timeframe, and consider the bigger picture.
Before the AI hype of the past few years, there was another wave of (possibly irrational) optimism that propelled NVIDIA towards its current towering heights.
And before that, yet another source of opportunity, capitalization and greed.
Here’s what came before, and what might come after, the hype that surrounds, drives and threatens the lord of the microprocessors, NVIDIA.
1990s: Birth of a GPU empire
NVIDIA started life in the Denny’s restaurant pictured above in San Jose, California, where three engineers agreed to form a new startup.
It was 1993, and the three co-founders — Jensen Huang, Chris Malachowsky and Curtis Priem — could see computing hitting the mainstream.
Specifically, they reasoned that graphics-based processing would become a huge market.
Thus began the first age of NVIDIA; a company that won business and renown for building the best graphics processing units for computer games.
They won contracts with companies like Sega and Microsoft, and replaced the outgoing Enron in the S&P 500 in 2001, as most other tech companies faded in the fallout of the dot-com bubble.
This, of course, was only the beginning.
2009-18: Shovels for the crypto gold rush
NVIDIA’s Voyager & Endeavour buildings in Santa Clara
In 2009, Bitcoin launched.
While most people focus on crypto as an asset class or a financial story, it also represented a deep shift for the microprocessor market.
A new era of ‘digital prospecting’ began.
Bitcoin miners needed powerful computers to solve complex mathematical puzzles to earn their digital gold.
Suddenly, NVIDIA’s GPUs weren’t just useful for computer games — but for making money.
These graphics cards, with their ability to perform multiple calculations simultaneously, were perfect for the task.
So many crypto miners began buying up NVIDIA’s GPUs, that demand soared and even created supply shortages.
At the peak of the crypto mining boom in 2017-2018, NVIDIA’s GTX 1080 Ti was the crown jewel for miners.
NVIDIA’s stock price more than doubled in 2017, riding the wave of crypto enthusiasm, while GPU prices rose so much that this single component became worth more than what you used to pay for an entire computer.
Like in all gold rushes, though, the mines eventually ran dry.
By 2022, several factors had conspired to end NVIDIA’s crypto mining dominance:
Bitcoin mining shifted to specialized ASIC hardware, leaving GPUs behind.
Ethereum, the last bastion of GPU mining, moved to a Proof-of-Stake model, eliminating the need for energy-intensive mining.
China, once a crypto mining powerhouse, banned the practice outright.
It seemed the party was over for NVIDIA.
As you know, though, and can see from the chart above, the company was far from finished.
The age of AI = the age of NVIDIA
NVIDIA GB200 Grace Blackwell Superchip: $70K each
With crypto mining no longer the way forward for NVIDIA’s GPU development and sales, artificial intelligence appeared as if on cue.
The same parallel processing power that made NVIDIA’s chips great for crypto mining also made them ideal for training AI models.
In 2018, NVIDIA began integrating Tensor Cores with ‘custom matrix multiplication’ units into its GPUs, enhancing their AI capabilities.
The result? NVIDIA’s data center revenue, driven largely by AI applications, grew from $3 billion in fiscal year 2019 to $15 billion in fiscal year 2023.
And that was just the beginning.
In 2023, as generative AI tools like ChatGPT captured the world’s imagination, demand for NVIDIA’s AI chips went parabolic.
NVIDIA’s H100 GPU became the gold standard for AI training, with some calling it ‘the most valuable chip in the world’.
Companies scrambled to get their hands on these chips, leading to waitlists and supply shortages.
You can see how much this demand now accounts for the company’s revenue (see ‘data center’):
The company’s stock price is up 1,146% since its October, 2022 low, and is now the world’s largest publicly-traded company by market cap.
Too big to fail succeed?
One problem with being on top, writes Dan Gallagher in the Wall Street Journal, is there is often nowhere to go but down.
NVIDIA’s exceptional growth over the past couple of years has created optimism and pessimism in equal measure.
The bulls feel this is the company to own in the still-nascent age of AI.
The bears feel that the stock’s run up is too much, too fast, and must come with a corresponding downside.
Because with growth comes complexity, and complexity can create risk.
All information contained in The Benchmark and on navexa.io is for education and informational purposes only. It is not intended as a substitute for professional financial or tax advice. The Benchmark and any contributors to The Benchmark are not financial professionals, and are not aware of your personal financial circumstances.
I wrote to you recently about an oft-overlooked Austrian economist who believed that every stock purchase was not just a bid for personal profit, but a vote cast in the economic democracy of the free market.
If that is so, then the days since Donald Trump won the United States presidential election have shown us very clearly what the market wants.
This is how the biggest financial markets in the world are looking as of this morning (performance for year to date):
S&P 500: +23.7%
NASDAQ: +26.5%
Bitcoin: +145%
Say what you want about Trump and the incoming administration; you simply cannot argue his victory has not been good for stocks.
This week, The Benchmark takes a look not just at what’s happened in the weeks since this latest election, but at what happened after Trump’s previous win — and what some of the market’s most influential voices are calling for in 2025 and beyond.
The ‘Trump Bump’ 2.0
History doesn’t repeat, yet it often rhymes.
In 2016, Trump won the U.S. election for the first time.
Fewer people expected it then than this time.
But the stock market conditions were similar.
The S&P 500 was making new all-time highs. As you can see in the chart below, it took off to even higher ones post-election.
The 2016 Trump Bump
This time, it’s a similar setup.
Stocks had made new all-time highs in the run-up to this election, and now appear to be off to the races — and making the late-2016 rally look trivial by comparison given the stock market’s performance since 2016.
The S&P 500 crossed 6,000 points for the first time.
The NASDAQ crossed 19,000 for the first time.
And, love it or hate it, Bitcoin has gone ballistic, up 32% in the past month alone.
‘Larger than 2016’ — JP Morgan
JP Morgan Chase & Co.’s head of US market intelligence wrote in a note to clients last week ‘I expect 2024 returns to be larger than 2016’.
The bank expected the big tech stocks to push the markets even higher, with financial stocks outperforming the rest of the S&P 500 for the remainder of 2024.
This post-election rally, they said, would be even stronger than in 2016, due to three main factors:
✅ Corporate tax cut promises
✅ Expectations around deregulation
✅ Increased infrastructure spending
Investors seem to feel more confident about a Trump presidency than they did in 2016. The market will tell us, in time, how these bets play out.
Crypto storms the senate & house
As I write this, Bitcoin has just hit $90,000 for the first time.
The last time the original cryptocurrency went this crazy, it topped out at about $70,000 in late 2021.
The crypto world has made its Trump vote very clear.
The industry reportedly spent more than $100 million on backing crypto-friendly candidates this election — a sign the once fringe financial-tech movement is maturing and finding more traditional ways to establish itself in the mainstream.
Not only has Trump promised to put America at the centre of the digital asset industry, to appoint more crypto-friendly regulators, and indicated he wants to create a national strategic Bitcoin reserve…
But the senate and house representatives the crypto world backed will shortly be displacing less favourable counterparts in the country’s halls of power.
But, there’s two sides to every story – especially when things get extreme.
Buffett keeping (lots of) powder dry
Warren Buffett’s Berkshire Hathaway is one of the biggest investors in the world.
But it’s worth noting that the company has never kept so much cash out of the market as it’s currently holding back.
They have about $325 billion in cash and treasury bills on their balance sheet — money they believe is wiser kept out of the stock market, even as it melts faces with new high after new high in the wake of the election result.
The Wall Street Journalnotes that this amount of money could buy all but the most valuable 25 or so listed companies in the U.S.
While stocks have been climbing since late 2022, Berkshire Hathaway has been growing its cash stash:
It’s up over 20% year-to-date and sitting at all-time highs in November.
The last two times this happened? 1954 and 1958.
The market finished the year higher both times.
Quote of the Week
‘As a bull market continues, almost anything you buy goes up. It makes you feel that investing in stocks is a very easy and safe and that you’re a financial genius.’
— Ron Chernow
That’s it for The Benchmark this week.
Forward this to someone who’d enjoy it.
If one of our dear readers forwarded this to you, welcome.
All information contained in The Benchmark and on navexa.io is for education and informational purposes only. It is not intended as a substitute for professional financial or tax advice. The Benchmark and any contributors to The Benchmark are not financial professionals, and are not aware of your personal financial circumstances.
Given that, by my estimate, probably 75% of the emails in your inbox over the past week have been trying to get your attention by piggybacking on the biggest political moment of the year — and the next four, for that matter — The Benchmark will not be jumping on that bandwagon.
At least not right now.
Today, I want to talk war, oil and gargantuan national wealth.
The kind of that shapes regions, geopolitics and economies for decades and centuries at a time.
Let’s start with the war that changed war forever.
Have oil, will win
One hundred and six years ago today, on November 11, 1918, this was the front-page news pretty much everywhere on the planet:
World War I was over. About 40 million people were dead, the world order forever changed.
While most modern history focuses on the treaties, the borders, the colossal repercussions resulting from the so-called ‘Great War’, there was another huge consequence — one we very much still live with to this day.
One of the reasons the Allied Powers were able to defeat the Central Powers was that they had access to more oil, courtesy of companies like the Anglo-Persian Oil Company (now BP).
This taught the victors that controlling oil was now a key factor in military might and geopolitical strength.
Add to this the fact that the Great War spurred the once-great Ottoman Empire’s breakup.
The Ottomans had controlled much of the Middle East.
In their place, new states formed in the region; Iraq, Kuwait, Yemen, Lebanon, and others — most importantly for our story today, Saudi Arabia.
The Father of Oil
During World War I, a British Army quartermaster, Major Frank Holmes, was tasked with securing food and supplies for the army’s forces in Mesopotamia (Iraq).
Before the war, Frank, had worked as a mining engineer in southern Africa.
(Coincidentally, he also attended the same high school as I did in New Zealand.)
So when he heard rumours of oil seeping up through the desert sands down on the Arabian peninsula, he made it his mission to return after the war to confirm what he suspected might be ‘an immense oil field running from Kuwait right down the mainland coast‘.
Return he did.
Frank Holmes spent the following couple of decades obtaining oil concessions and working out where the Arabian peninsula’s oilfields lay — using his straight-talking manner to sell the impoverished sheikhs on the idea of the vast wealth hiding deep beneath their feet.
While most established opinion at the time was pretty negative about the prospects of finding oil there, Frank proved the doubters wrong.
While there might be a common, if ignorant, assumption that those in the Middle East resent western meddling in their resources, the reality is that Frank Holmes’ self-described ‘nose for oil‘ led to a colossal, sustained boom in both wealth and influence for these countries.
The Arabs even have an affectionate sobriquet for Frank; ‘Abu Naft‘ or the Father of Oil.
From no country, to rich country, to major global tech investor
Riyadh, Saudi Arabia
Spanning an area of more than 2 million sq km, Saudi Arabia is the largest country in the Middle East, and the 12th largest state in the world.
Of all the oil states that Frank Holmes helped create, Saudi Arabia is the one to have cashed in its oil wealth to the greatest effect.
The Saudis possess the second-largest oil reserves on Earth — more than Russia and the U.S. combined, going by Opec’s estimates.
They are the third-largest producer of oil. And current estimates indicate they have nearly 80 years’ production in reserve.
When you talk about Saudi oil, you’re really talking about Saudi Aramco — the national oil company of Saudi Arabia, formerly Arabian-American Oil Company.
Saudi Aramco is the fourth-largest company in the world. It is also the highest-producing oil company — at about 12.8 million barrels a day.
Today, despite not currently being the biggest company in the world, Aramco turns over about half a trillion dollars a year. The Saudi government owns most of the business.
The company’s origin story is stacked with intrigue, intertwined with 20th Century history, and well worth digging into.
For now though, I want to draw your attention to what Saudi Arabia has done with its vast oil wealth.
Fluctuating oil prices, and turbulent regional and international geopolitical developments, make depending solely on oil a volatile strategy.
Eggs in baskets, right?
The government created the Saudi Arabian Public Investment Fund in 1971, right around the time Norway did the same to diversify, distribute and compound its vast — but ultimately finite — oil wealth.
Based on the latest available information, here are the PIF’s top 10 U.S. stock holdings as of Q2 2024:
Uber Technologies, Inc. (UBER) — $5.29 billion, 25.62% of portfolio.
Lucid Group, Inc. (LCID) — $3.59 billion, 17.37% of portfolio.
Electronic Arts Inc. (EA) — $3.46 billion, 16.73% of portfolio.
Take-Two Interactive Software, Inc. (TTWO) — $1.77 billion, 8.59% of portfolio.
Arm Holdings plc (ARM) — $593 million, 2.87% of portfolio.
Linde plc (LIN) — $530 million, 2.57% of portfolio.
Cummins Inc. (CMI) — $454 million, 2.20% of portfolio.
Advanced Micro Devices, Inc. (AMD) — $374 million, 1.81% of portfolio.
Meta Platforms, Inc. (META) — $373 million, 1.81% of portfolio.
Amazon.com, Inc. (AMZN) — $296 million, 1.43% of portfolio.
That’s about $17 billion invested across these 10 stocks alone — and that’s just scratching the surface of what the PIF has invested Saudi Arabia’s gargantuan oil wealth into.
You might be wondering how we got here.
From the armistice that ended World War I…
To one of my high school alumni (well before my time, mind you) wandering in the desert looking for army supplies…
To the birth of a group of Middle East nations out of the ashes of a vanquished empire…
To one of the most influential, powerful and wealthy states on Earth…
And the way it’s taking the enormous wealth it pumps from the ground and deploys it in some of the world’s most profitable and fast-growing companies.
Aramco announced last week that its quarterly net profit had fallen to $27.56 billion — slightly higher than the $26.89 billion analysts had expected, but still, remarkably, warranting the negative tone of the headlines broadcasting the result.
While everybody spent the past quarter obsessing over polls and predictions, and now votes and results, from the U.S. election…
This one company was raking in nearly $30 billion in profit, when the state that owns it didn’t even exist 100 years ago.
This got me thinking, which got me writing.
And now here we are.
Quote of the Week
‘Formula for success: rise early, work hard, strike oil.’
— J. Paul Getty
That’s it for The Benchmark this week.
Forward this to someone who’d enjoy it.
If one of our dear readers forwarded this to you, welcome.
All information contained in The Benchmark and on navexa.io is for education and informational purposes only. It is not intended as a substitute for professional financial or tax advice. The Benchmark and any contributors to The Benchmark are not financial professionals, and are not aware of your personal financial circumstances.
The Cayman Islands. Bermuda. The British Virgin Islands.
You’ve probably heard about such jurisdictions on account of their favourable tax laws, and attractiveness for those looking to protect as much of their wealth as possible.
Tax havens, they call them.
Well, today we’re not looking at a tax haven so much as a tax hell — at least for the very wealthy.
The land of fjords and oil wealth is experiencing a peculiar phenomenon — its richest citizens are taking their money and escaping south, to Switzerland.
Why?
Because the government recently started demanding a bigger slice of their wealth.
‘Store’s tax-the-rich push has pitted traditional Nordic concepts of equality and social justice against claims that the measures penalize success and hurt the economy.
‘The 63-year-old prime minister has called the emigration of wealthy people “a breach of a social contract”.’
Forcing their wealthiest to flee is hitting Norway’s finances.
Kjell Inge Røkke, Norway’s third-richest man, is among the wealth tax refugees.
His move to Switzerland has cost the Norwegian government roughly $16 million annually in lost tax revenue — more than a million dollars a month.
At the time of writing, it looks like nearly 100 wealthy Norwegians have hit the eject button, and taken their money south to Switzerland.
Wealth creation vs. wealth distribution
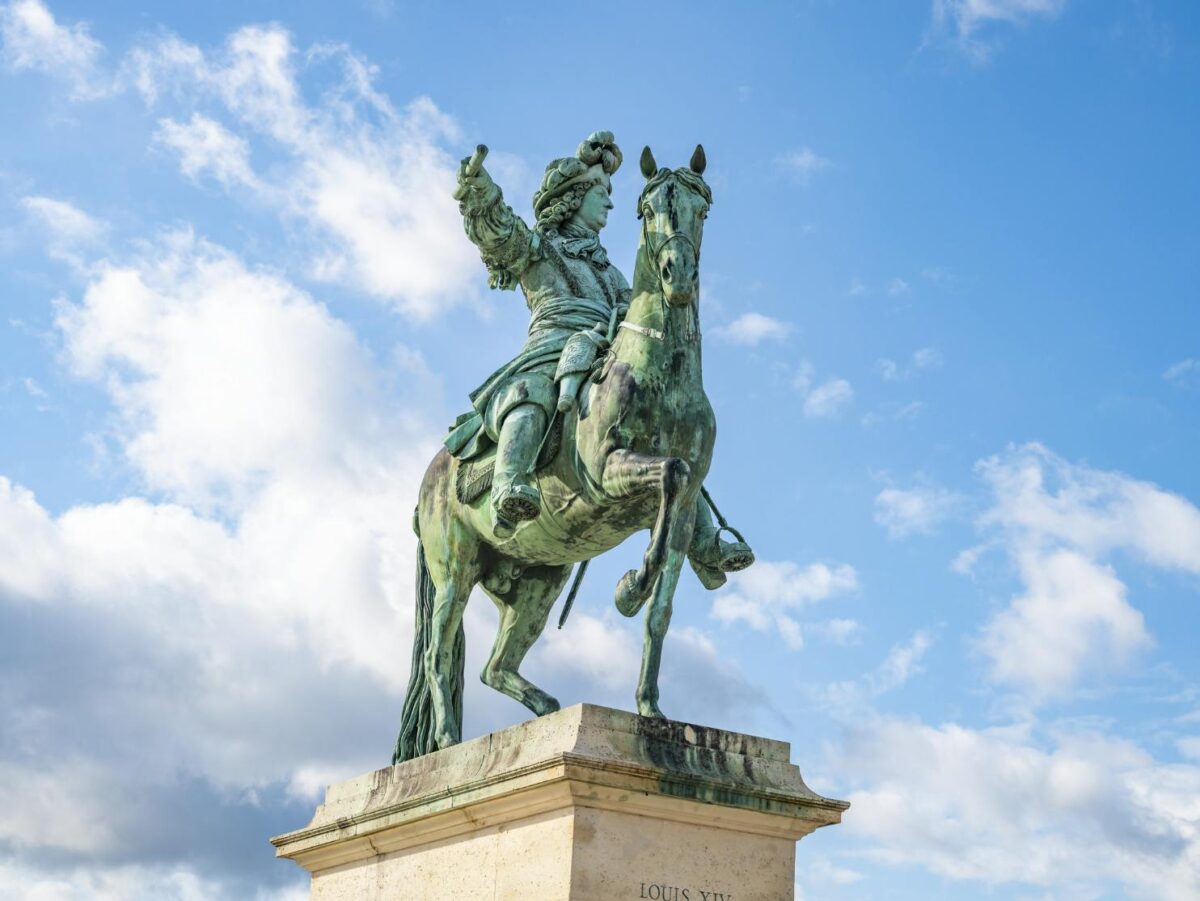
Louis XIV: Taxed the people so hard they revolted
As you can imagine, the situation has inflamed an already heated debate.
Erlend Grimstad, secretary of state at the Norway Ministry of Finance, states:
‘People benefit from free education, national infrastructure, free health care, subsidized preschool child care, generous leave rules, and corporate tax in line with other countries. This means that successful people with this social model should contribute more than others.’
On the other side, the wealth creators argue that the wealth tax forces them to withdraw capital from their companies to pay it, which is bad for growth, business development, and employment.
Tord Kolstad, one of richest 400 Norwegians, says the government’s policy represents a misunderstanding of the nature of his wealth:
‘My value is not in owning money, it’s in factories, houses, buildings… I still have to pay 2% or 3% a year to the government just to own it. And I believe that this taxation is the reason there will be fewer jobs, and less investment — and then less welfare.’
Now here’s the kicker.
The wealth tax, intended to generate more revenue for the state, might end up doing the opposite.
Norwegian Business School professor emeritus, Ole Gjems-Onstad, estimates that the wealthy Norwegians who’ve left took with them a total fortune of $54 billion.
This exodus could result in about 40% less revenue than the wealth tax currently generates.
This ‘mound-shaped’ indicator is a method for determining — if such a thing were to exist — the ideal tax rate.
By ideal, I mean one that helps both the government, and the people that government serves, prosper in equal measure.
It takes its name from economist Dr. Arthur Laffer — although the idea first appears in Muslim philosopher Ibn Khaldun’s 14th-Century work The Muqaddimah.
You can dig into the theory behind the indicator here.
But for now, let these excerpts from Laffer’s theories serve to illustrate, at least in part, what’s happening with Norway’s wealthiest right now (my emphasis added):
‘Higher taxes discourage business activity and drive down tax revenues. ‘For example, high taxes encourage the creation of tax shelters and encourage business activity that generates paper losses from depreciable assets rather than business activity that creates jobs and generates revenue.
‘Money spent on plush office suites, the purchase of private jets, and the leasing of luxury cars becomes more advantageous (because of the ability to lower marginal tax rates) than business activity designed to generate a profit. ‘Businesses may tend to choose to be less productive to be more profitable.’
Benjamin Franklin, the man whose wisdom about investing in knowledge we’ve based this email on, said that nothing could be said to be certain, except death and taxes.
I would add to that by saying that the former, in many ways, is more simple than the latter.
The Norwegians appear to have pushed a little too far along the Laffer Curve.
With capital and wealth more mobile than ever before, the way in which governments treat their highest taxpayers looks like it needs to evolve.
Speaking of evolution…
Brand new Navexa review
Irene Zhu just published her honest comparison of the Navexa portfolio tracker against another popular tool.
This is by far the most detailed, in-depth such video review you’ll see of our platform and everything it helps investors with — including tax calculation and optimization.
‘The art of taxation consists in so plucking the goose as to obtain the largest possible amount of feathers with the smallest possible amount of hissing.’
— Jean-Baptiste Colbert, finance minister to France’s Louis XIV
That’s it for The Benchmark this week.
Forward this to someone who’d enjoy it.
If one of our dear readers forwarded this to you, welcome.
All information contained in The Benchmark and on navexa.io is for education and informational purposes only. It is not intended as a substitute for professional financial or tax advice. The Benchmark and any contributors to The Benchmark are not financial professionals, and are not aware of your personal financial circumstances.
You’ve probably heard of John Maynard Keynes and Adam Smith, right?
Towering figures in economic theory.
But how about Ludwig von Mises?
I didn’t hear the name until I went to work for an independent financial research firm renowned for publishing work well outside the investing mainstream.
This overlooked Austrian economist might just be the most important thinker you’ve never heard in terms of understanding capitalist society.
Given that we believe that investing in knowledge is one of the most intelligent things you can do as an investor, I think it’s time I introduced you.
The free market radical
Ludwig von Mises
Ludwig von Mises was an economist, logician, sociologist and philosopher of economics.
Born in 1881 in what is now Ukraine, Mises was the last torchbearer of the original Austrian School of Economics. I’ll dig into the Austrian school in a future email.
Despite his brilliance, Mises spent much of his career as an outsider in academia, often without a paid university position.
He wrote and lectured on classical liberalism and the power of the consumer.
In other words, he was interested in free market economics and civil liberties. He advocated limited government, political and economic freedom, and freedom of speech, with a particular focus on individual autonomy.
He was not a fan of social policies, taxation and state involvement in the individual’s life.
He defended these views as illiberalism and authoritarianism rose in Europe during the 20th century.
While Keynesian economics — which included the idea that government spending could increase economic output — dominated the 20th century, Mises steadfastly defended free markets and criticized government intervention.
The Nazis burned down his library and forced him to flee to the United States in 1940.
Lemberg, Mises’ birthplace, in modern-day Ukraine
Mises made groundbreaking contributions to economic thought, including:
Calling out socialism: In 1920, Mises argued that socialist economies would inevitably fail due to the impossibility of economic calculation without a price system. This insight remains a cornerstone of free-market economics. He also believed a stock market was a guard against socialism.
Austrian business cycle theory: Mises proposed that business cycles are caused by the expansion of bank credit, leading to malinvestment and eventual recession. This theory offers an alternative explanation to Keynesian models.
Praxeology: Mises developed this approach to economics, based on the idea that economic laws can be derived from the self-evident axiom that humans act purposefully to achieve desired ends.
Capitalist society: Mises’ perspective
For Mises, capitalism wasn’t just an economic system — it was the only viable way to organize a complex society.
Here’s why:
The sovereign consumer: In a free market, consumers ultimately direct production through their buying decisions. This “democracy of the dollar” ensures resources are allocated efficiently to meet actual demand.
The entrepreneur as engine: Mises saw entrepreneurs as the driving force of progress. By taking risks and innovating, they constantly improve products and production methods.
The price signal: Prices in a free market convey crucial information about scarcity and demand, allowing for rational economic calculation. This is impossible in a centrally planned economy.
AI rendering of ‘capitalism’
The stock market: Capitalism’s unsung hero
While many people see the stock market as a casino for the wealthy, Mises viewed it as a vital institution in a capitalist society.
He argued that the stock market efficiently directs capital to its most productive uses, as investors seek the best returns.
By allowing ownership to be divided and traded, the stock market enables risk to be spread across many individuals.
Stock prices provide crucial information about the relative value and performance of companies, guiding further investment decisions.
In his own words:
‘There can be no genuine private ownership of capital without a stock market: there can be no true socialism if such a market is allowed to exist.’
What would Ludwig say about today’s situation?
If you hadn’t noticed, we’re living in an era in which the market practically hangs off government decision-making.
What central banks decide to do with interest rates has a massive impact on what investors decide to do with their money.
While we might feel this is normal, Mises warned against government manipulation of the money supply. He said that such meddling created boom-and-bust cycles.
With central banks around the world engaging in unprecedented monetary expansion, his theories are more relevant than ever.
As governments attempt to direct economic activity, Mises’ critique of central planning provides a powerful reminder of the importance of decentralized decision-making in markets.
Mises’ emphasized entrepreneurial innovation as a driver of progress — not central bank money printing.
Mises’ ideal investor avatar
Ludwig von Mises would have defined a good investor as someone who is:
Wary of government intervention in the economy, which can distort prices and lead to malinvestment.
Understands that stock prices reflect not just current conditions, but expectations about the future.
Recognizes their role as a capital allocator in the broader economy.
Appreciates the stock market as a crucial institution for economic freedom and prosperity.
All pretty sound, right? So…
Why does history overlook this man?
Mises’ relative anonymity in popular economics can be attributed to several factors:
His uncompromising stance against government intervention put him at odds with the prevailing Keynesian orthodoxy.
His works are often considered dense and challenging for the general reader.
He lacked the institutional backing that many of his contemporaries enjoyed.
Despite this, Mises’ ideas have had a profound influence on libertarian thought and continue to shape debates about economic freedom and the role of government in the economy.
In Mises’ view, every stock purchase is not just a bid for personal profit, but a vote cast in the economic democracy of the free market.
Quote of the Week
‘The stock market is the heart of the capitalist system. It is its most characteristic feature. It reflects all the economic conditions of the country and all the circumstances affecting it.’
— Ludwig von Mises
That’s it for The Benchmark this week.
Forward this to someone who’d enjoy it.
If one of our dear readers forwarded this to you, welcome.
All information contained in The Benchmark and on navexa.io is for education and informational purposes only. It is not intended as a substitute for professional financial or tax advice. The Benchmark and any contributors to The Benchmark are not financial professionals, and are not aware of your personal financial circumstances.
Millennial spending wave: Historically, stock market upswings have coincided with growth in the 30-50 age group. Lee sees the rising economic influence of millennials entering their prime spending years driving stocks higher.
Tech filling labour shortages: He expects U.S. tech spending to skyrocket, potentially pushing the tech sector’s weight in the S&P 500 from 30% to 50%. Lee anticipates a surge in technology investment, particularly in AI, to address global labour shortages.
Flood of money into the U.S.: As companies worldwide invest heavily in technology, Lee predicts increased capital flows into the U.S. — strengthening its dominant position as a hub for leading tech firms.
Were these projections to materialize, the market’s annual returns could compound in the high teens. Bullish indeed.
But that’s just one view. What about the other side of the coin?
The bear case: Stagnation and geopolitical risk
On the other end of the spectrum, some analysts, including those at JPMorgan, paint a more cautious picture, at least for the rest of this decade.
Their concerns include:
Can’t go much higher: Many think current equity valuations are stretched, and that there’s little room left to run higher.
War worries: Prolonged, high-stakes global conflict makes analysts nervous about whether the stock market can continue climbing.
Recession Fears: The Fed has just lowered interest rates, but recession fears remain alive and well. Bears don’t see the economy as out of the woods yet.
Under this scenario, the market might struggle to make gains, potentially remaining range-bound or even declining over the next few years.
Grim. But, like all these viewpoints, far from a sure thing.
They see a shift in global market dynamics, and don’t focus only on U.S. markets.
Key points from their forecast:
A bigger share for emerging markets: They project emerging markets’ share of global equity market capitalization to increase from 27% currently to 35% by 2030. That would be a significantly larger slice of the global market cap, which currently sits around $109 trillion.
U.S. market share decline: While emerging markets could increase their share, the U.S.’s could fall from 42.5% today to 35% by 2030.
India’s leading the charge: Goldman Sachs predict India will have the largest increase in global market cap share, potentially reaching 8% by 2050.
This view suggests that while U.S. markets may not see explosive growth, the global investment landscape could offer significant opportunities, particularly in emerging markets.
In other words, while backing U.S. tech stocks today seems like the smartest play, perhaps that won’t be the case 10 years from now.
Basically, this view is ‘things could change’ — which, to be honest, isn’t much of a view at all.
Give me a strong for or against any day.
Another record high, but for how much longer…
While we’re fans of taking the long view here at The Benchmark, we don’t advocate taking your eye off the ball in the short term, either.
Phil Rosen over at The Opening Bell Daily pointed out last week that, having just hit its 46th record high of the year, the S&P 500 could have the best part of a year left to run to its bull market high.
According to the Wall Street Journal, the market historically takes 709 trading days to hit its bull market high.
This current bull run — which started on October 12, 2022 — is just over 500 trading days old.
That would imply there’s just over six months left of rising stock prices.
If only the past were a reliable guide to future events. (It’s not — do your own research and understand the risks, always.)
Quote of the week
‘The individual investor should act consistently as an investor and not as a speculator.’
— Benjamin Graham
That’s it for The Benchmark this week.
Forward this to someone who’d enjoy it.
If one of our valued subscribers forwarded this to you, welcome.
All information contained in The Benchmark and on navexa.io is for education and informational purposes only. It is not intended as a substitute for professional financial or tax advice. The Benchmark and any contributors to The Benchmark are not financial professionals, and are not aware of your personal financial circumstances.
If I told you there was a company whose objective was to wipe out national debt, and that I’d secured a trade monopoly with a vast, rich nation to make it happen…
Would you be interested in investing?
This very proposition drew some of the 18th century’s highest profile players — including pioneering physicist, mathematician and philosopher Sir Isaac Newton — to invest their money into one of the most insane bubble-and-bust stories you’ve ever heard.
This is a tale of greed, speculation, and financial ruin that makes today’s market swings and scandals seem mere ripples on a pond.
The business of saving national economies
The South Sea Company was founded in 1711 by an Act of Parliament.
In 1713, the company was granted a trading monopoly in the South Seas region. This referred to South America and surrounding waters at that time.
This monopoly was granted as part of the Treaty of Utrecht, which ended the War of the Spanish Succession.
Specifically, Britain had been awarded the right to the Asiento (‘Contract’) by the Spanish Crown, giving them monopoly rights to import African slaves into Spanish-held America.
The British government then granted this right to the South Sea Company.
In exchange for this monopoly, the South Sea Company agreed to buy up £9.5 million (some sources say £11 million) of Britain’s outstanding official debt.
In other words, the business was going to free Britain from debt with the enormous profits of its zero-competition business activities.
This one company, with this enormous competitive advantage (secured by the government), quickly became the hottest investment narrative in Britain.
The company’s stock price ran higher on speculation and misleading claims.
At its peak in 1720, South Sea Company stock had risen by over 800%.
Jonathan Swift, who lost a considerable sum himself, captured the chaos in a satirical ballad:
Thus, the deluded Bankrupt raves; Puts all upon a desp’rate Bet Then plunges in the Southern Waves Dipt over Head and Ears – in Debt.
Aftermath: South Seas Company’s sunken dream
The public outrage was, of course, strong.
Parliament — despite having created, promoted and invested in the whole thing — launched an inquiry.
It uncovered a web of insider trading and bribery that would make even the shadiest of modern-day corporate raiders blush.
Several company directors were punished, including prominent Cabinet members.
The Chancellor of the Exchequer was removed from power and imprisoned in the Tower of London.
It was financial and political carnage on a scale we can’t really imagine, today.
Sir Isaac Newton: Abandoned reason to ride the South Seas wave
Too good to be true, too bad to be false
The South Seas Company saga played out about 300 years ago.
But its lessons still burn bright.
If it sounds too good to be true, it probably is.
Speculation can create a dangerous disconnect between stock prices and underlying value.
Even the smartest people (Isaac Newton — seriously) can get caught up in market mania.
Government involvement doesn’t guarantee safety — it might even amplify risks.
As we navigate today’s markets, from crypto booms and busts to AI stock mania (the jury is still out on this), the South Sea Bubble serves as a stark reminder of the dangers of unchecked speculation.
And a reminder, not only of the importance of due diligence — but of weighing the facts independently of public opinion about those facts.
Quote of the week
‘I can calculate the motion of heavenly bodies, but not the madness of people.’
— Sir Isaac Newton
That’s it for The Benchmark this week.
Forward this to someone who’d enjoy it.
If one of our dear readers forwarded this to you, welcome.
All information contained in The Benchmark and on navexa.io is for education and informational purposes only. It is not intended as a substitute for professional financial or tax advice. The Benchmark and any contributors to The Benchmark are not financial professionals, and are not aware of your personal financial circumstances.
Seth Andrew Klarman is a billionaire. The private investment partnership he founded in 1982 has realized a 20% compounded return for 40 years.
Let that sink in for a moment.
Twenty percent a year. For 40 years.
An annualized return that strong turns $100,000 into $147 million.
Klarman’s Baupost Group hedge fund started with around $270 million in funds under management.
Today, it’s worth around $25 billion.
Since 1982 the stock market has — according to Wikipedia — crashed 10 times.
The 1987 Black Monday crash alone was enough to inflict serious, lasting financial damage to someone close to me.
The rest of their life they lived with the consequences, and regret, of having sold in panic as investors all over the world rushed to get out.
That fear and anxiety investors feel when markets are bad and everybody is racing to the exit, you could characterize as impatience.
And as Warren Buffet says, the stock market is essentially a machine that transfers wealth from the impatient to the patient.
Seth Klarman is one such patient investor. He’s even known as the ‘Oracle of Boston’, placing him alongside Buffet’s ‘Oracle of Omaha’ moniker.
Seth Klarman — one of the world’s most patient investors
Over Klarman’s 40+ years running managing his investment fund, none of the 10 crashes have, in the long term, impeded him from racking up what most of us would agree is a highly impressive return.
According to him:
‘The daily blips of the market are, in fact, noise — noise that is very difficult for most investors to tune out.’
‘Klar’, by the way, is German for ‘clear’.
Whether or not Klarman’s name had any bearing on the way he views the markets, it’s certainly clear that ignoring the so-called ‘noise’ in favour of a long term strategy has been immensely profitable for him and his investors.
Ignoring noise = essential for long-term returns
When we talk about market noise, we’re talking about a lot of things.
Daily price movements, economic changes that impact the markets, interest rate chatter, and current events are all standard examples.
Here’s a quick example of just how useless most noise is — and why smart investors like Seth Klarman ignore it, preferring instead to focus on their strategy.
The chart shows you the S&P500 index between 2009 and mid 2017. As you can see, annotated along the line is every time the financial media claimed ‘the easy money has been made’.
In other words, nine times they claimed the good times were over for the S&P500…
That things were about to get tough for investors…
That you should perhaps be scared about what was about to happen to the stock market.
And yet, while in the short term the S&P500 did indeed fluctuate — sometimes severely and abruptly — over the seven-and-a-half years this chart shows, it still doubled in value.
We can’t know how many people were scared into selling their stocks each time they read a ‘the easy money…’ headline.
But, you can bet there were quite a few, because for every buyer there must be a seller.
The impatient and the patient.
I know people who won’t even get into the stock market — on account of the fact values can fall — let alone stay in stocks they own through volatile or uncertain times.
Such is their meagre appetite for investment risk — or perhaps their inability to ignore the noise.
‘Get rich quick’ has become virtually synonymous with ‘scam’. You read those words and you know there has to be a catch.
While it’s true that some investors do bag huge gains from speculative investments like penny stocks, it’s very rare that they’re able to repeat those successes by applying any sort of discipline or formula.
Getting rich quick, you could say, depends on luck.
You have to buy the right investment at precisely the right time and you sell it at the right time. The odds of doing both of these things, consistently, are very low.
Getting rich slowly, on the other hand — building financial freedom and exponential wealth by investing like the Seth Klarmans and Warren Buffets of this world — depends on something else.
It demands investors maintain discipline, patience and a healthy amount of ignorance to allow the daily and weekly ‘noise’ to pass as exactly that — short-term blips on a much longer journey.
CGT options you didn’t know you had?
Tax is a fact of (legal) life.
Capital gains tax on investments, too.
But, you’d be amazed how many investors don’t understand the (very much legal) options available to them in calculating and reporting their capital gains for tax purposes.
Navarre’s latest walks you through the four main CGT strategies in his latest vid.
All information contained in The Benchmark and on navexa.io is for education and informational purposes only. It is not intended as a substitute for professional financial or tax advice. The Benchmark and any contributors to The Benchmark are not financial professionals, and are not aware of your personal financial circumstances.